Research in East London Data Analysis

Verified

Added on  2020/01/07

|24
|2294
|277
Report
AI Summary
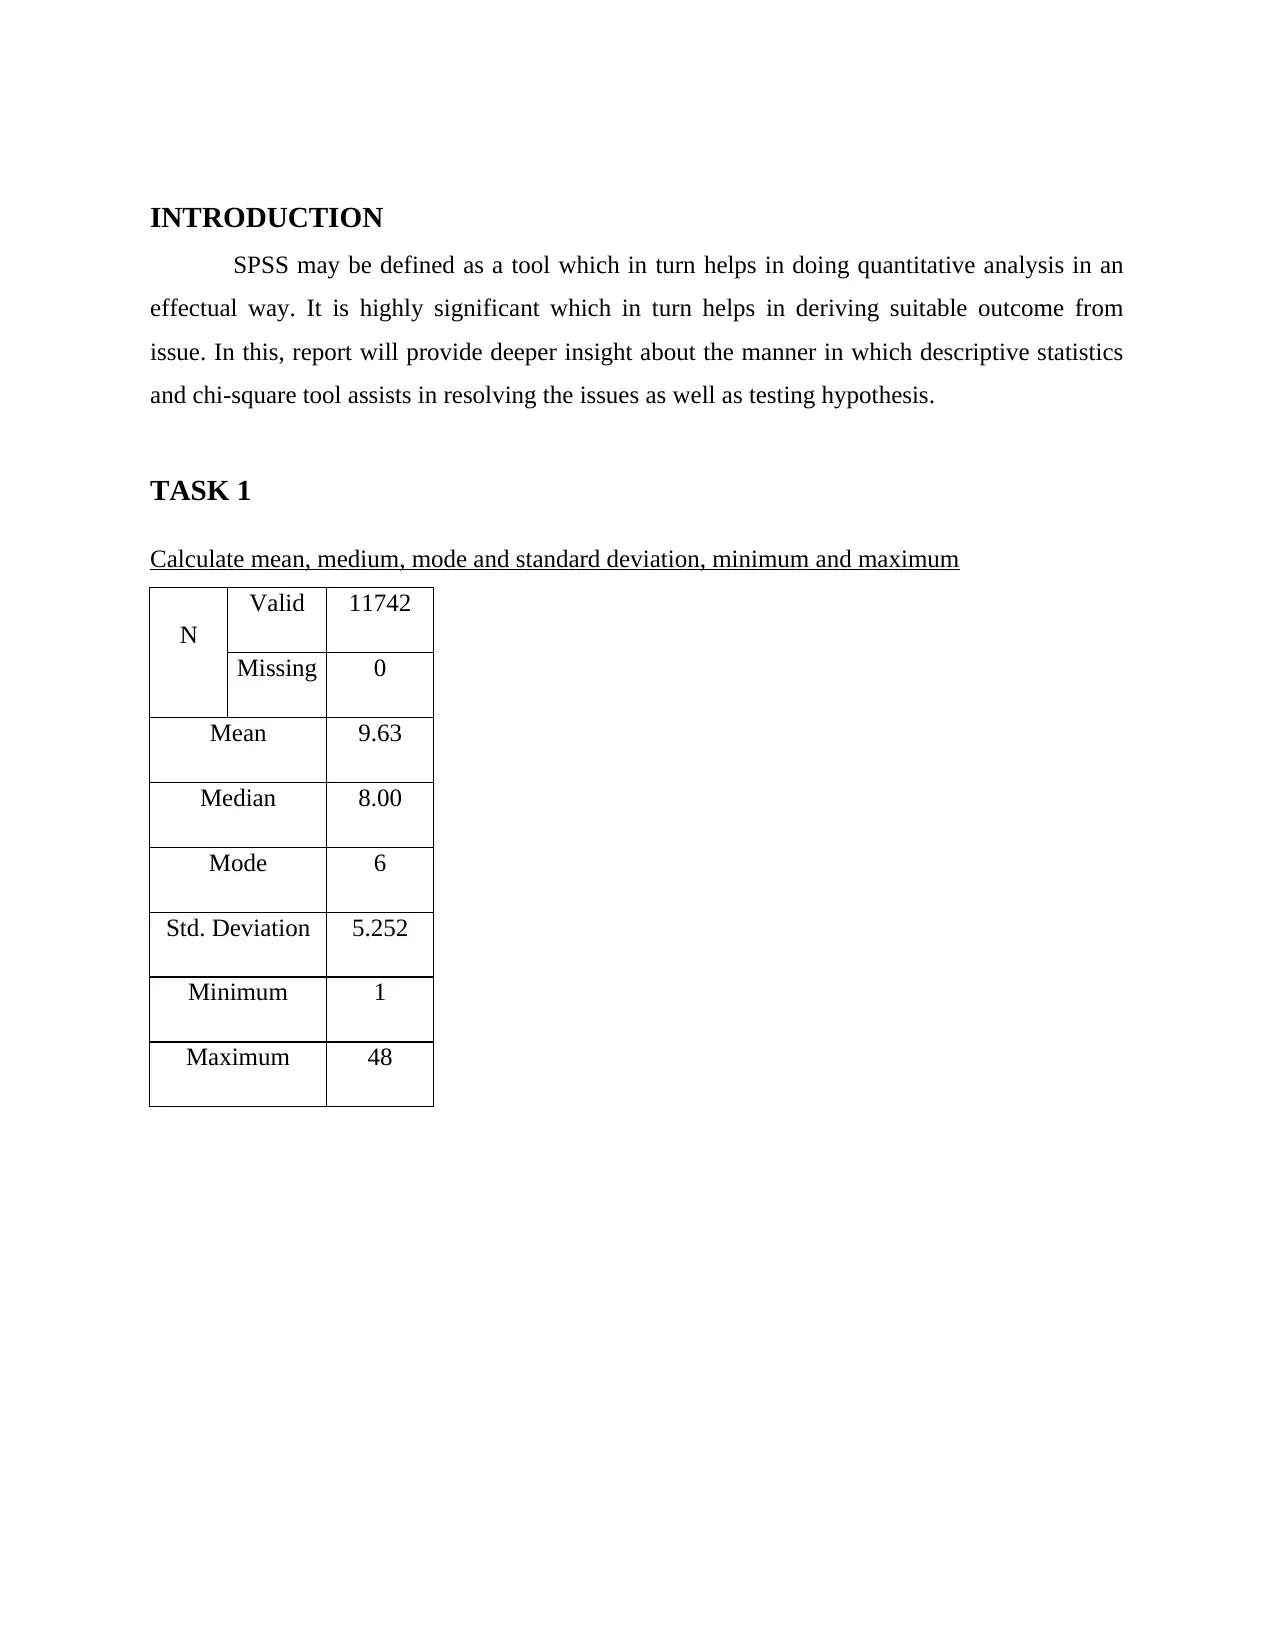
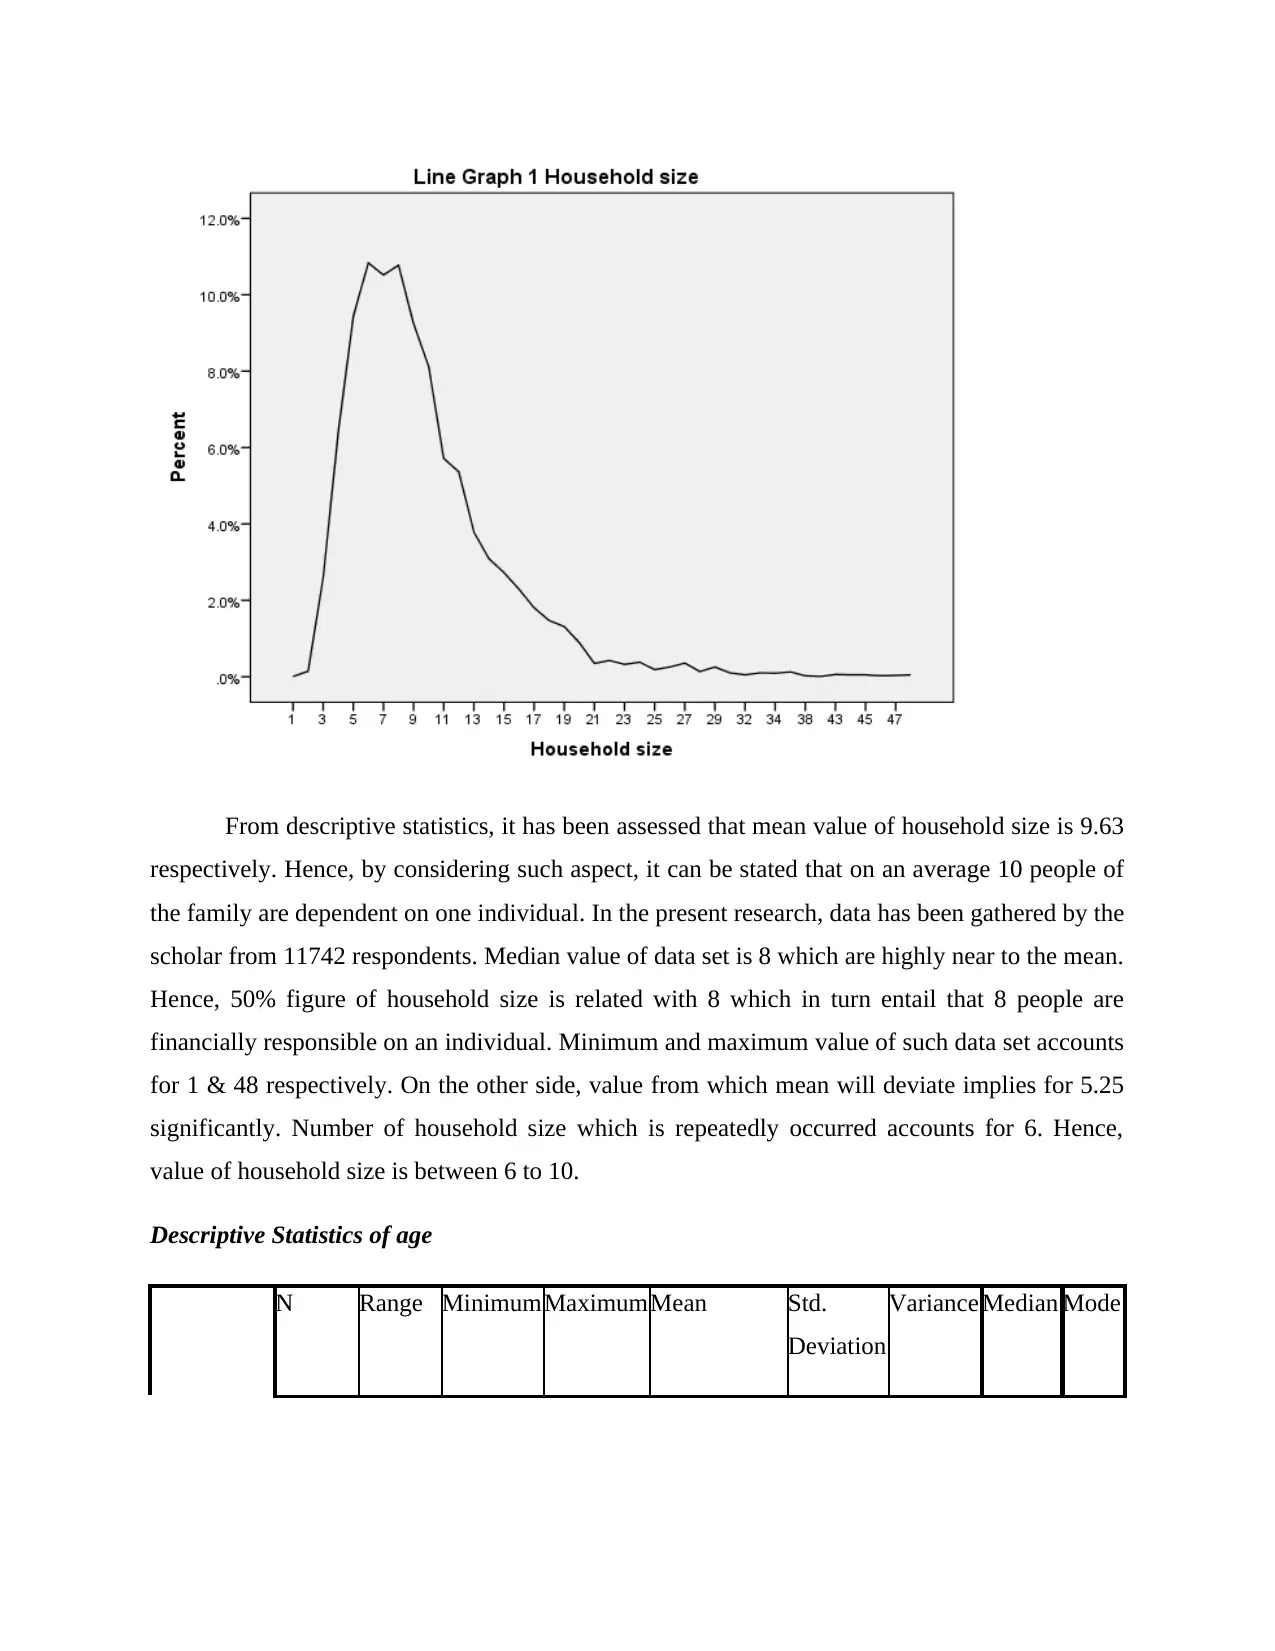
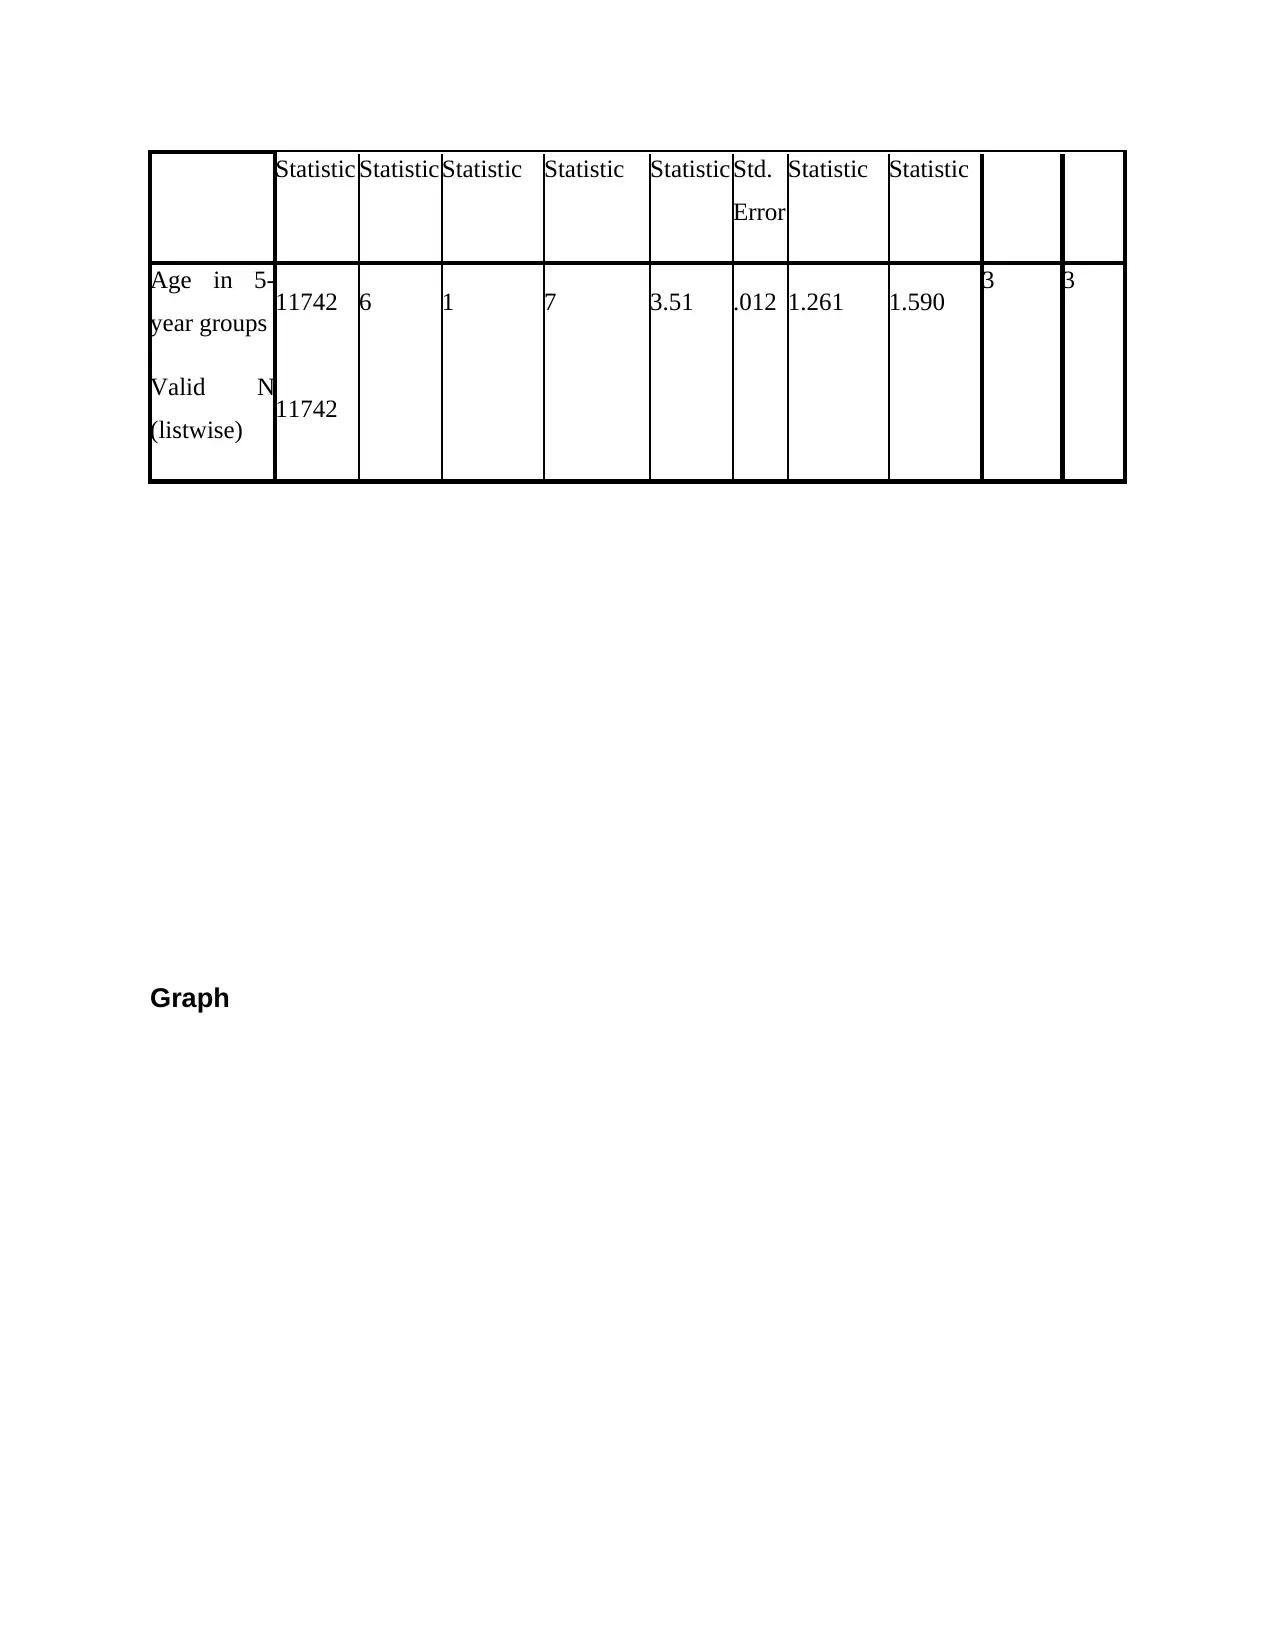
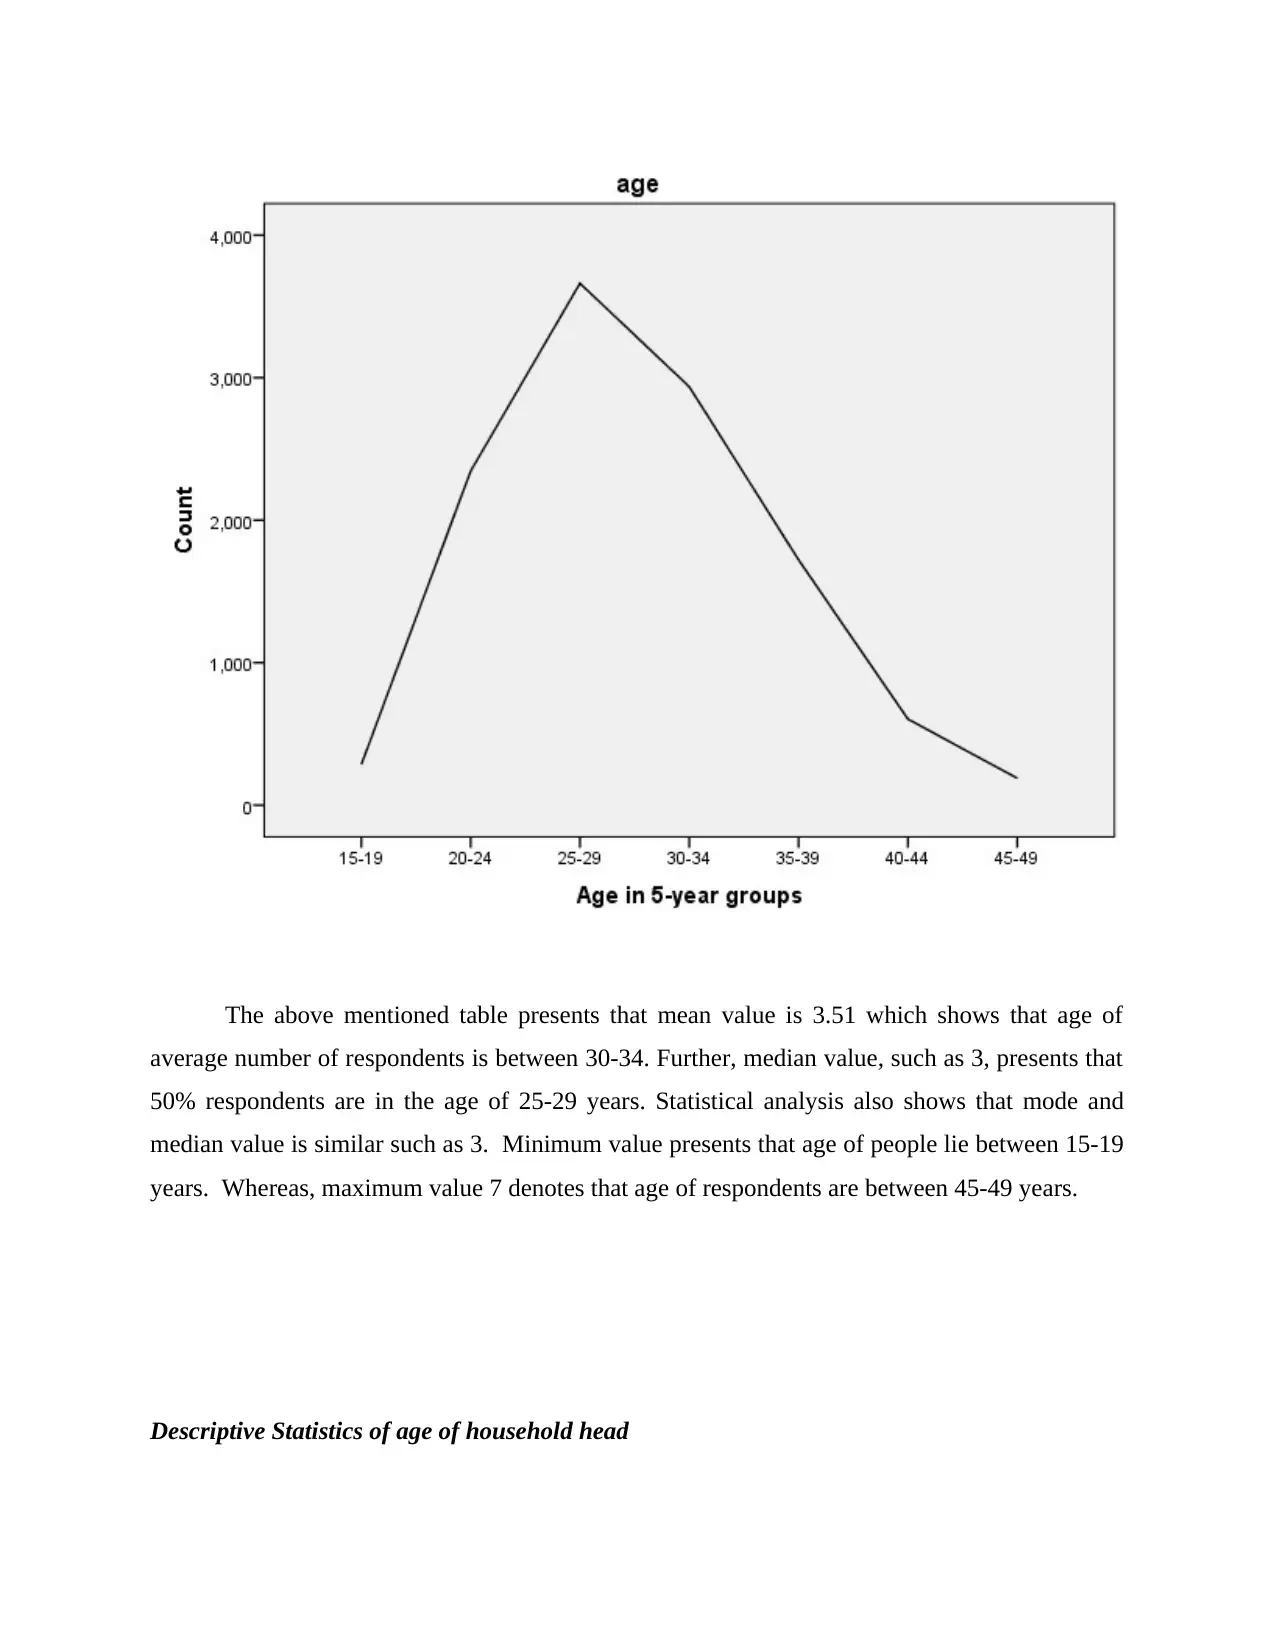
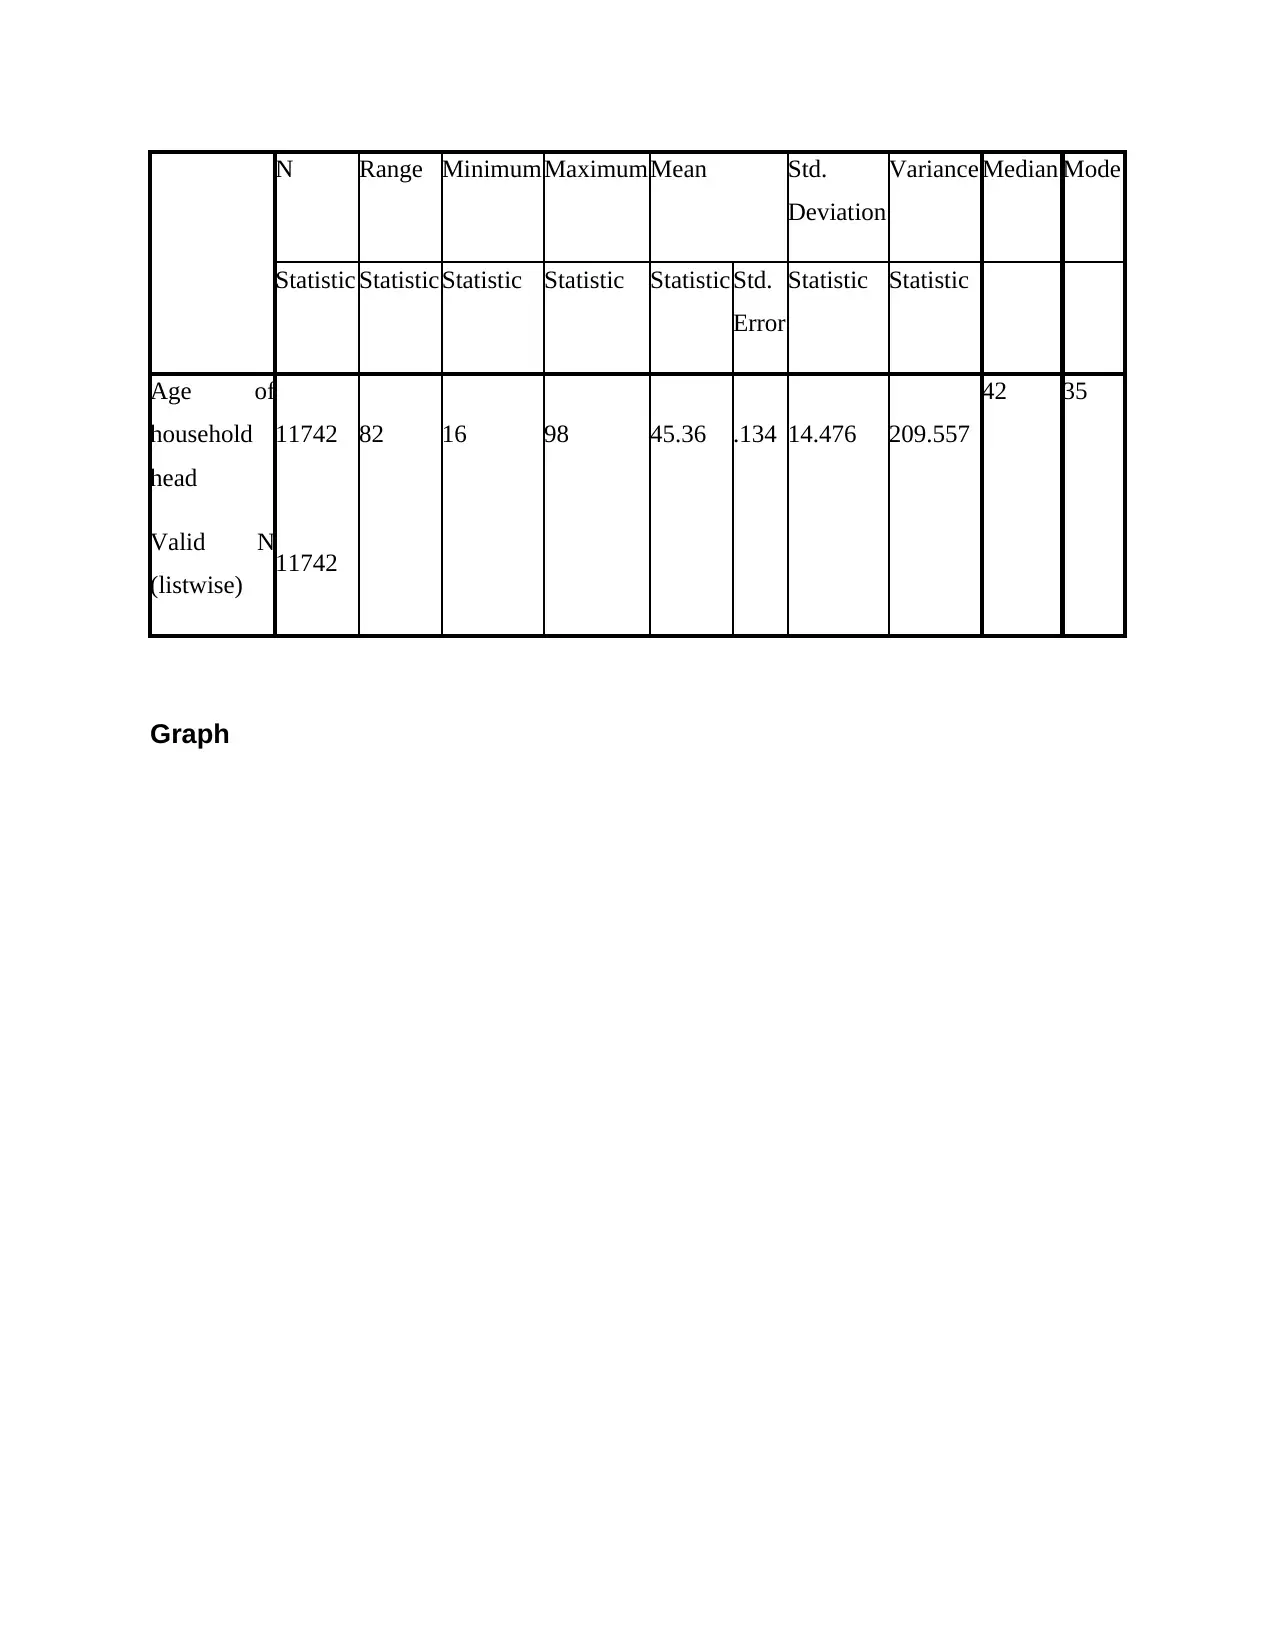
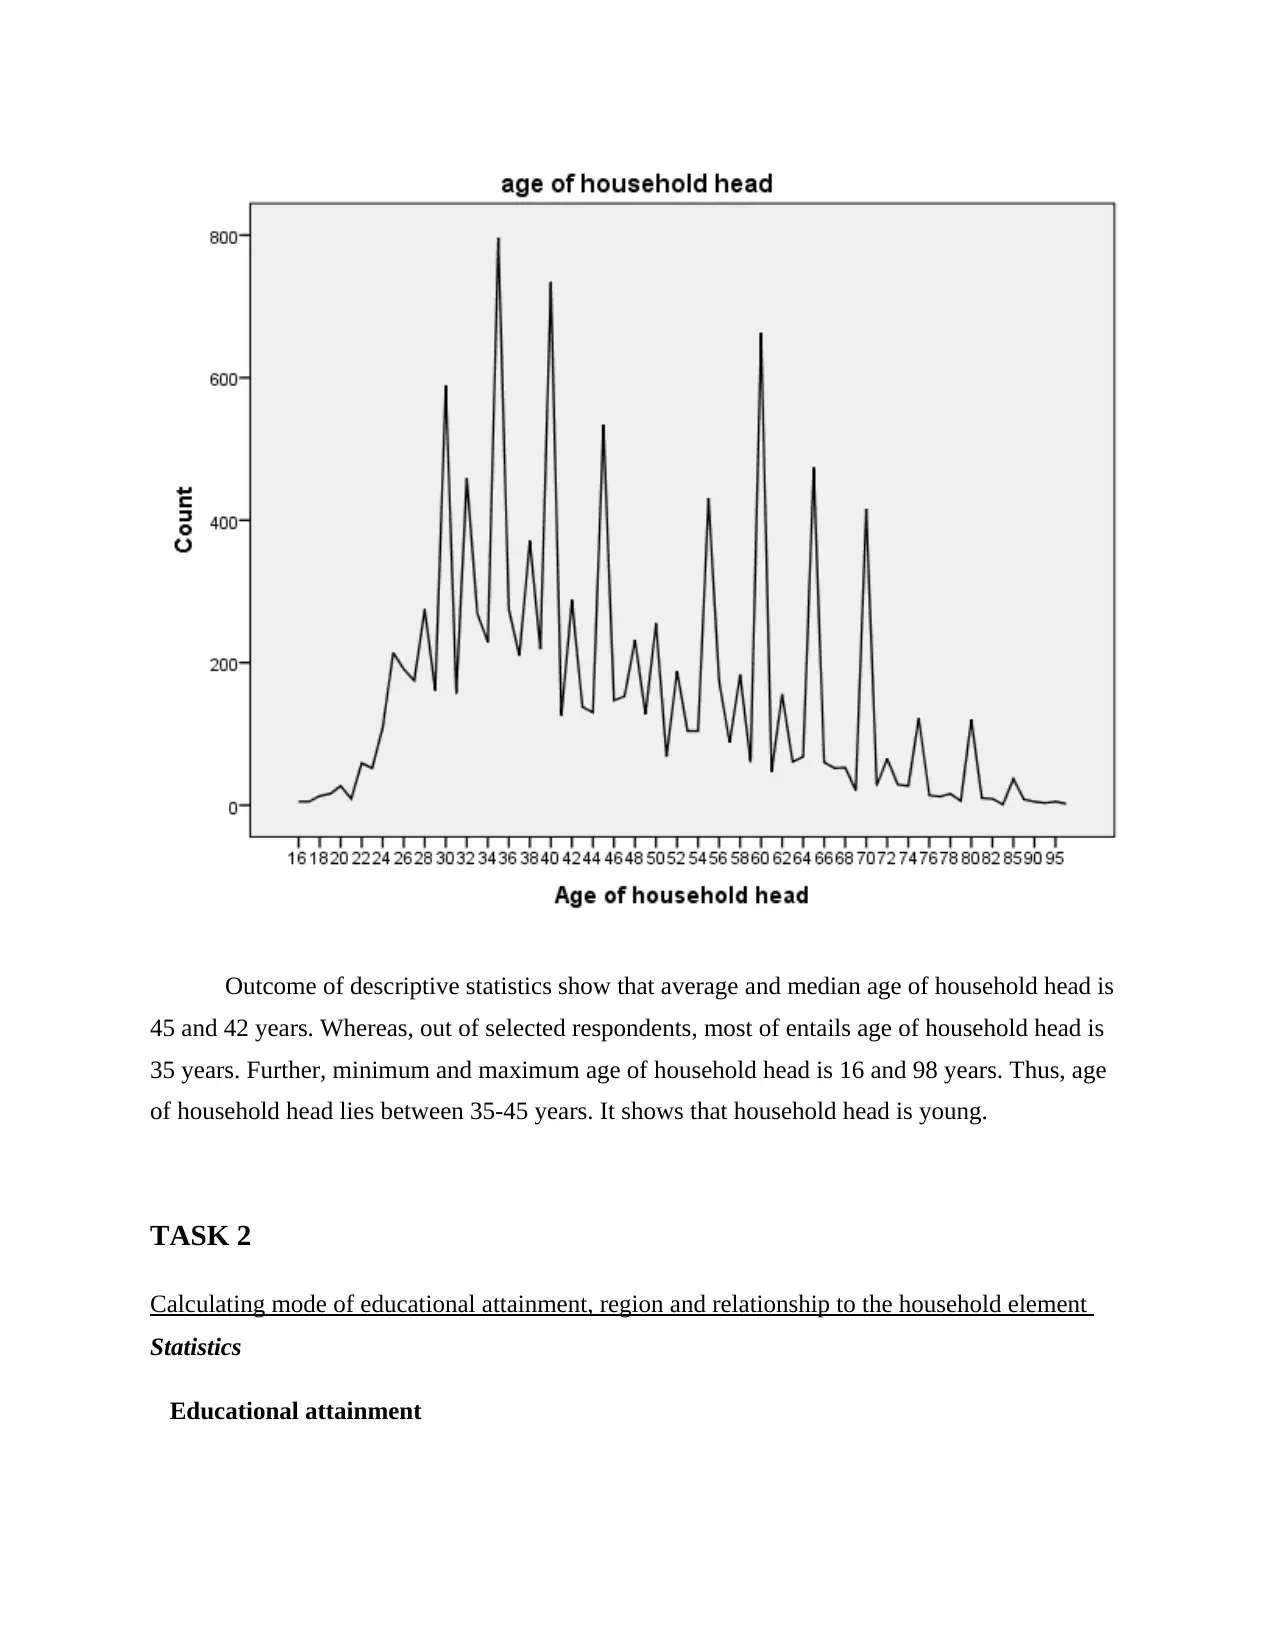
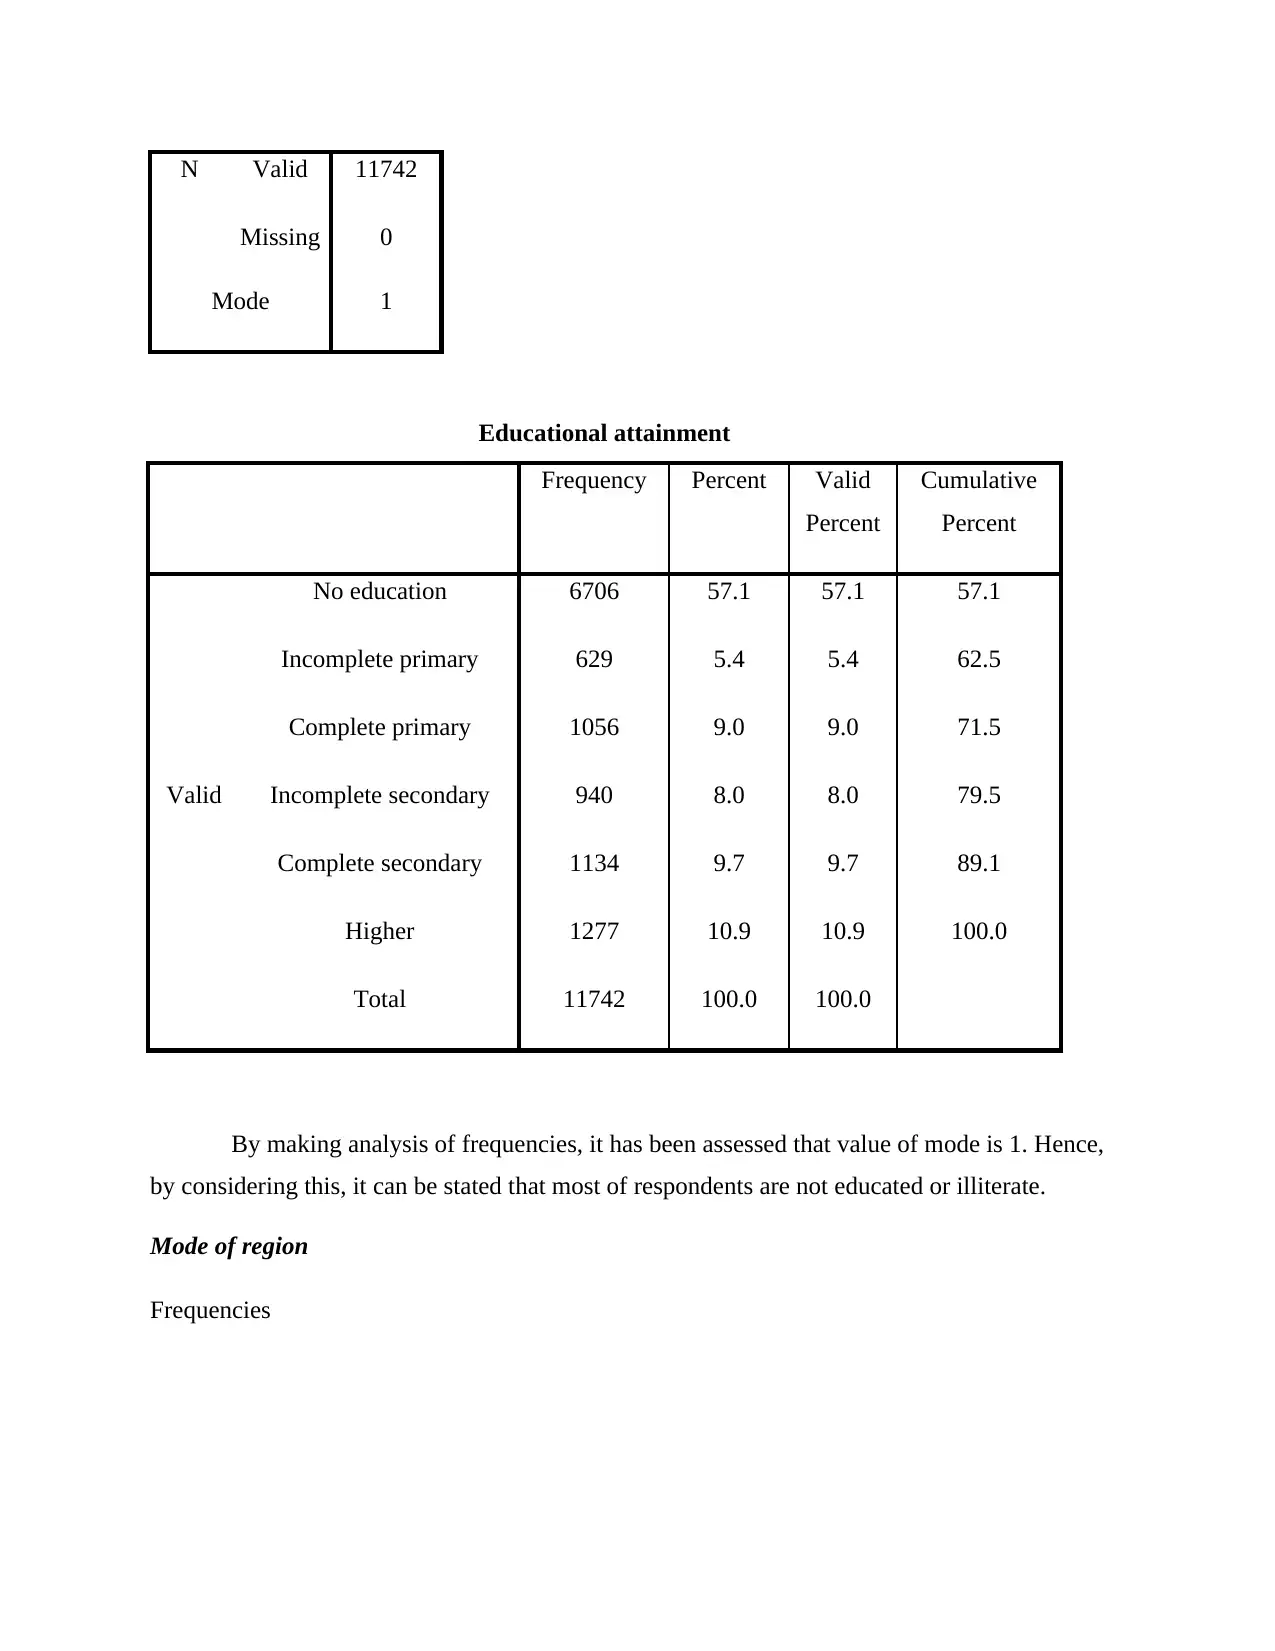
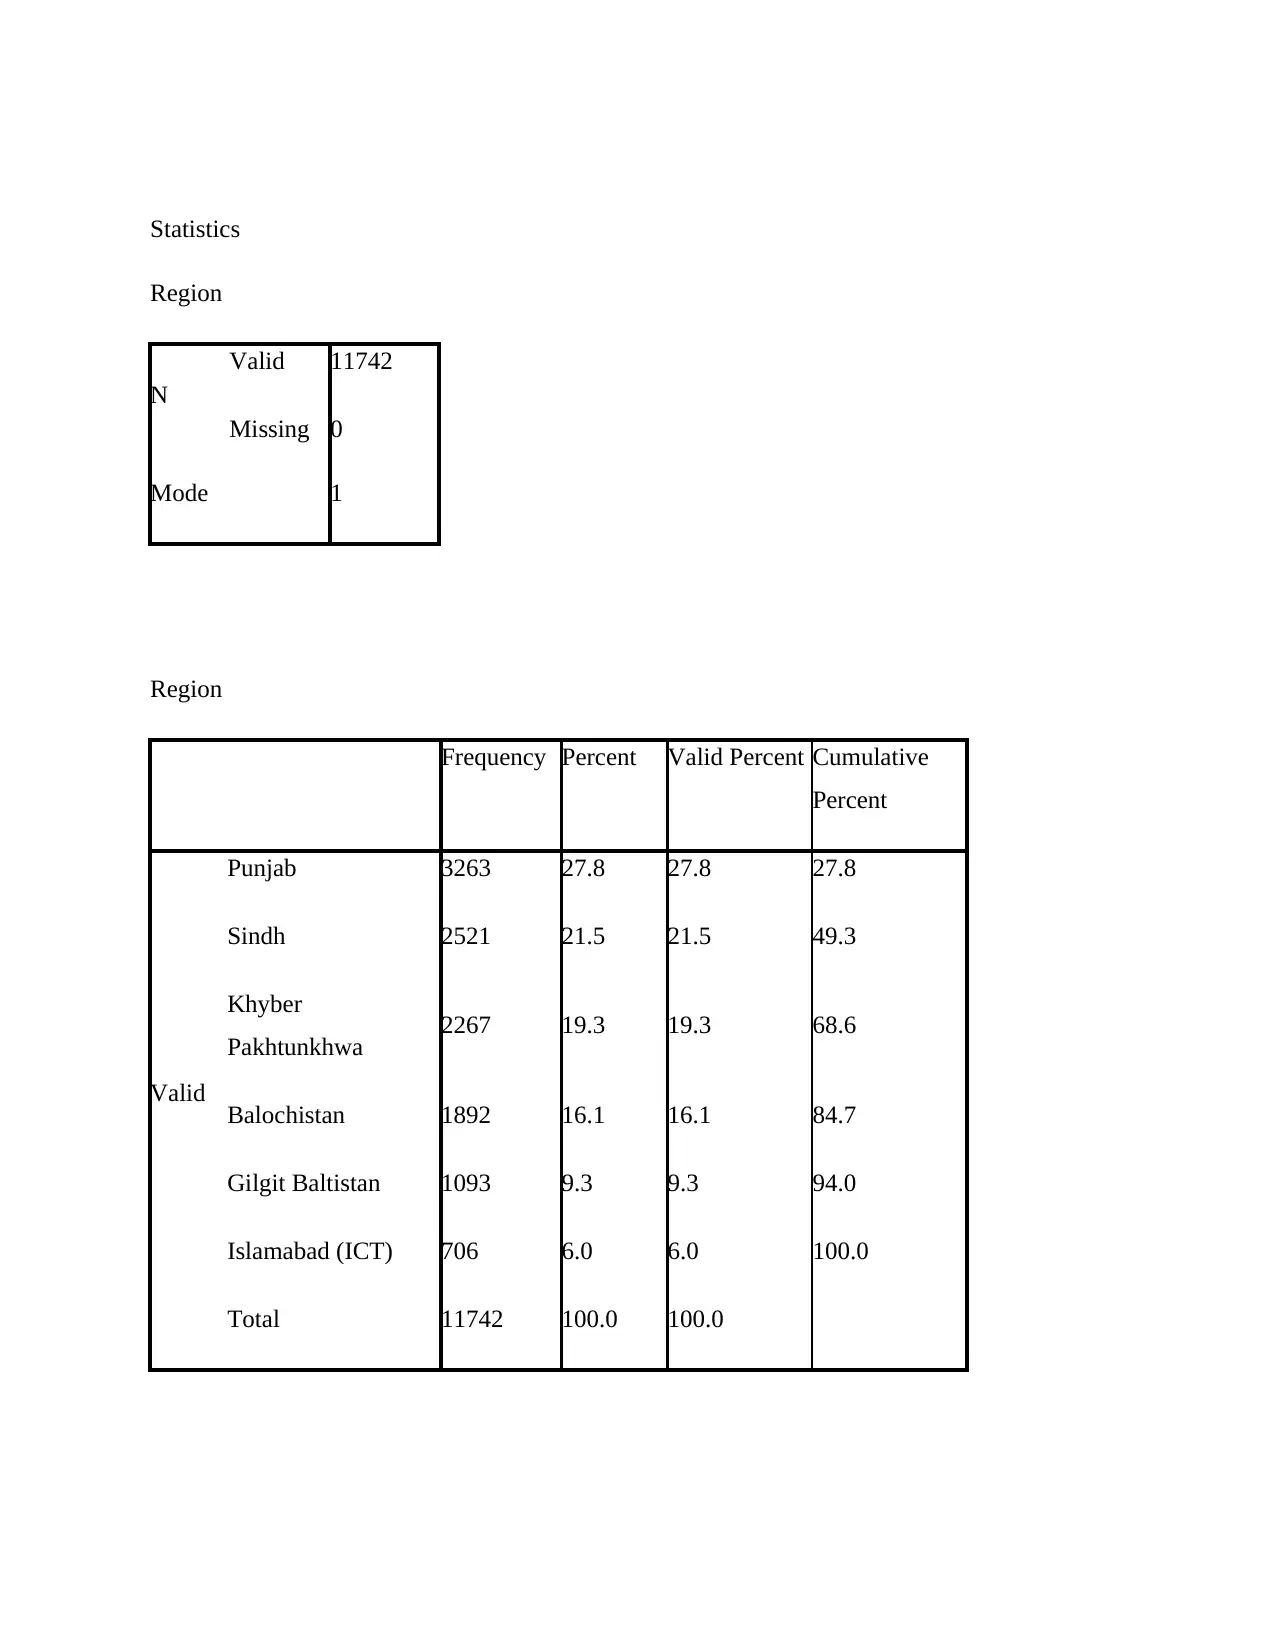
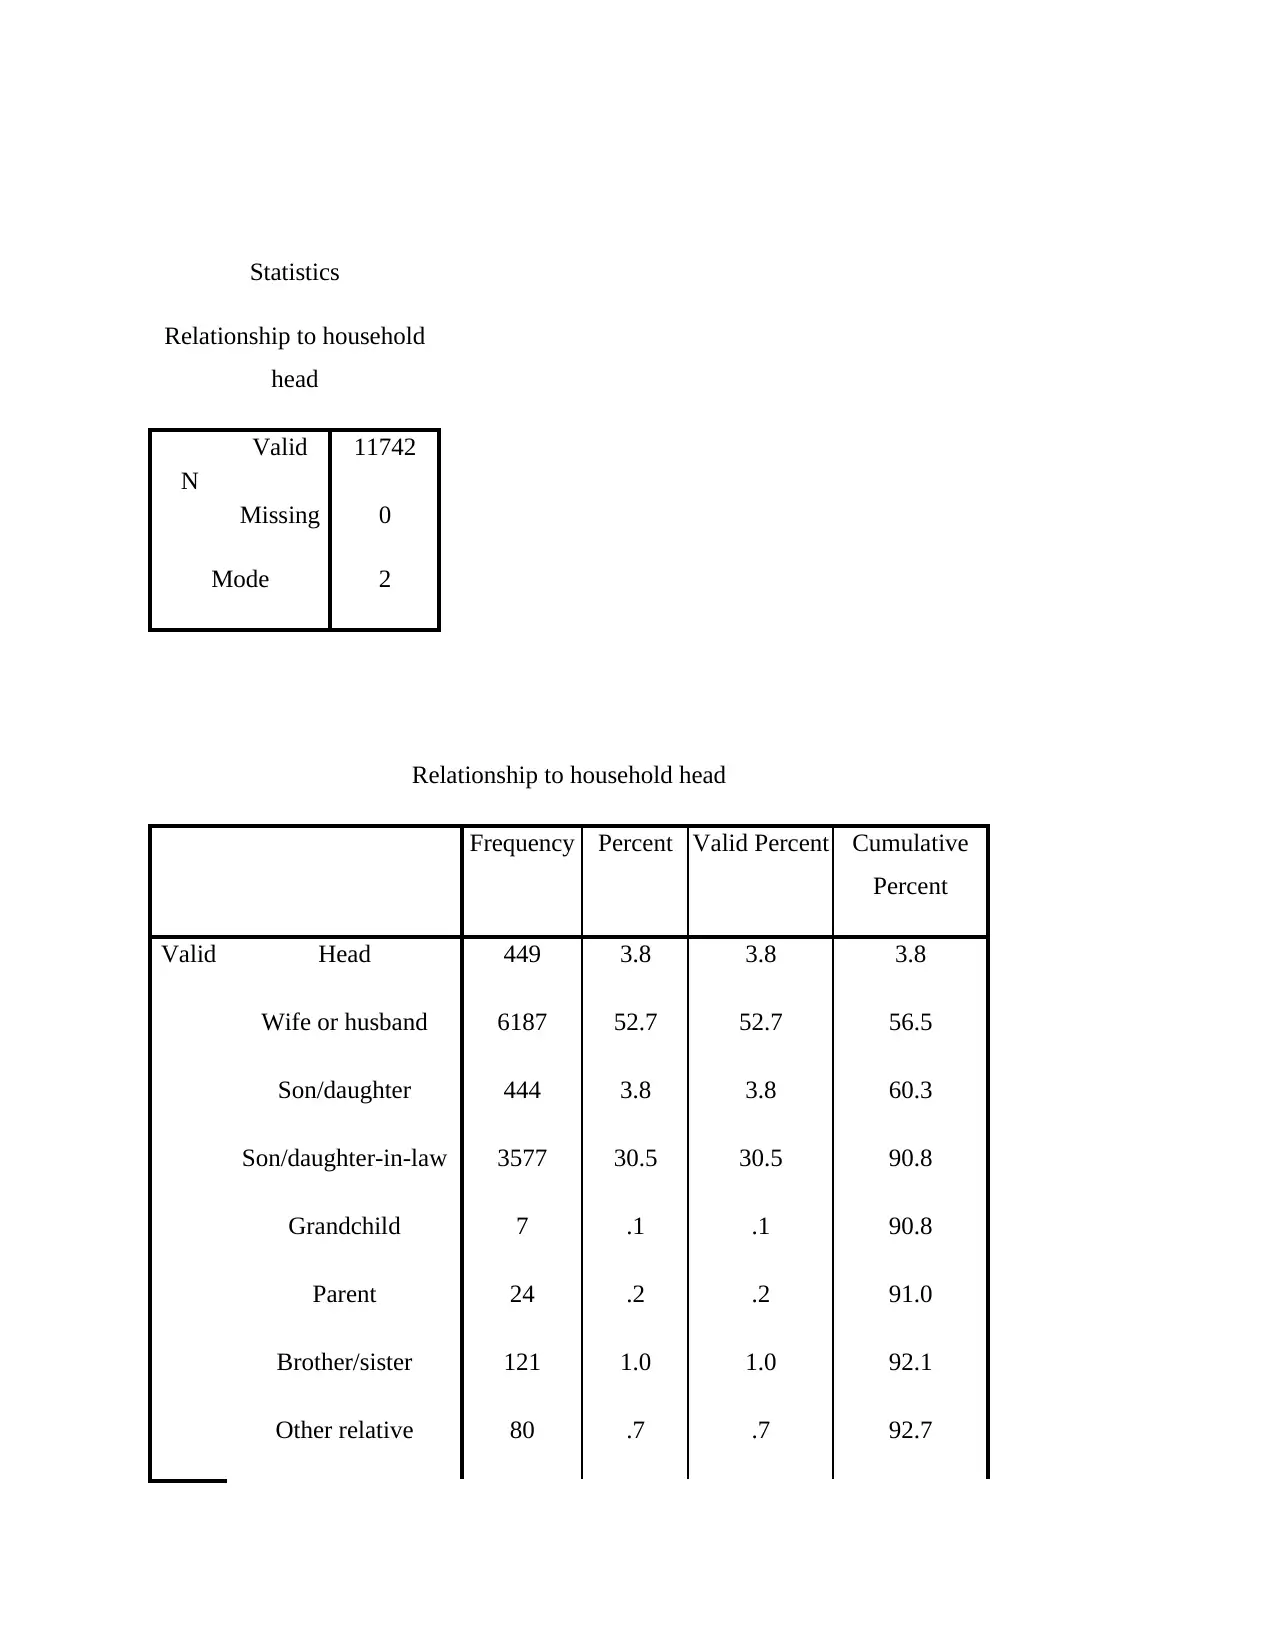
This report details a data analysis of research conducted in East London, utilizing SPSS software. The analysis includes descriptive statistics (mean, median, mode, standard deviation, minimum, and maximum) for household size and age, along with the age of the household head. Further analysis employs chi-square tests to examine the association between various factors: educational attainment and place of residence; sex of the household head and literacy; type of place of residence and highest educational level; and region and literacy. The report presents frequency tables, cross-tabulations, and interpretations of the chi-square test results, concluding that significant associations exist between several of the variables studied.
Document Page
Research in East London
tabler-icon-diamond-filled.svg

Paraphrase This Document

Need a fresh take? Get an instant paraphrase of this document with our AI Paraphraser
Document Page
Table of Contents
INTRODUCTION...........................................................................................................................3
TASK 1............................................................................................................................................3
Calculate mean, medium, mode and standard deviation, minimum and maximum....................3
TASK 2............................................................................................................................................8
Calculating mode of educational attainment, region and relationship to the household element8
TASK 3..........................................................................................................................................16
Creating cross tabs for different elements.................................................................................16
A. Place and educational Attainment.........................................................................................16
b. Sex of Household Head and Literacy....................................................................................19
c. Type of place of residence and highest educational level......................................................21
D. Region and Literacy..............................................................................................................23
CONCLUSION..............................................................................................................................25
Document Page
INTRODUCTION
SPSS may be defined as a tool which in turn helps in doing quantitative analysis in an
effectual way. It is highly significant which in turn helps in deriving suitable outcome from
issue. In this, report will provide deeper insight about the manner in which descriptive statistics
and chi-square tool assists in resolving the issues as well as testing hypothesis.
TASK 1
Calculate mean, medium, mode and standard deviation, minimum and maximum
N
Valid 11742
Missing 0
Mean 9.63
Median 8.00
Mode 6
Std. Deviation 5.252
Minimum 1
Maximum 48
Document Page
From descriptive statistics, it has been assessed that mean value of household size is 9.63
respectively. Hence, by considering such aspect, it can be stated that on an average 10 people of
the family are dependent on one individual. In the present research, data has been gathered by the
scholar from 11742 respondents. Median value of data set is 8 which are highly near to the mean.
Hence, 50% figure of household size is related with 8 which in turn entail that 8 people are
financially responsible on an individual. Minimum and maximum value of such data set accounts
for 1 & 48 respectively. On the other side, value from which mean will deviate implies for 5.25
significantly. Number of household size which is repeatedly occurred accounts for 6. Hence,
value of household size is between 6 to 10.
Descriptive Statistics of age
N Range MinimumMaximumMean Std.
Deviation
Variance Median Mode
tabler-icon-diamond-filled.svg

Paraphrase This Document

Need a fresh take? Get an instant paraphrase of this document with our AI Paraphraser
Document Page
Statistic StatisticStatistic Statistic Statistic Std.
Error
Statistic Statistic
Age in 5-
year groups 11742 6 1 7 3.51 .012 1.261 1.590 3 3
Valid N
(listwise) 11742
Graph
Document Page
The above mentioned table presents that mean value is 3.51 which shows that age of
average number of respondents is between 30-34. Further, median value, such as 3, presents that
50% respondents are in the age of 25-29 years. Statistical analysis also shows that mode and
median value is similar such as 3. Minimum value presents that age of people lie between 15-19
years. Whereas, maximum value 7 denotes that age of respondents are between 45-49 years.
Descriptive Statistics of age of household head
Document Page
N Range MinimumMaximumMean Std.
Deviation
Variance Median Mode
Statistic StatisticStatistic Statistic Statistic Std.
Error
Statistic Statistic
Age of
household
head
11742 82 16 98 45.36 .134 14.476 209.557
42 35
Valid N
(listwise) 11742
Graph
tabler-icon-diamond-filled.svg

Paraphrase This Document

Need a fresh take? Get an instant paraphrase of this document with our AI Paraphraser
Document Page
Outcome of descriptive statistics show that average and median age of household head is
45 and 42 years. Whereas, out of selected respondents, most of entails age of household head is
35 years. Further, minimum and maximum age of household head is 16 and 98 years. Thus, age
of household head lies between 35-45 years. It shows that household head is young.
TASK 2
Calculating mode of educational attainment, region and relationship to the household element
Statistics
Educational attainment
Document Page
N Valid 11742
Missing 0
Mode 1
Educational attainment
Frequency Percent Valid
Percent
Cumulative
Percent
Valid
No education 6706 57.1 57.1 57.1
Incomplete primary 629 5.4 5.4 62.5
Complete primary 1056 9.0 9.0 71.5
Incomplete secondary 940 8.0 8.0 79.5
Complete secondary 1134 9.7 9.7 89.1
Higher 1277 10.9 10.9 100.0
Total 11742 100.0 100.0
By making analysis of frequencies, it has been assessed that value of mode is 1. Hence,
by considering this, it can be stated that most of respondents are not educated or illiterate.
Mode of region
Frequencies
Document Page
Statistics
Region
N
Valid 11742
Missing 0
Mode 1
Region
Frequency Percent Valid Percent Cumulative
Percent
Valid
Punjab 3263 27.8 27.8 27.8
Sindh 2521 21.5 21.5 49.3
Khyber
Pakhtunkhwa 2267 19.3 19.3 68.6
Balochistan 1892 16.1 16.1 84.7
Gilgit Baltistan 1093 9.3 9.3 94.0
Islamabad (ICT) 706 6.0 6.0 100.0
Total 11742 100.0 100.0
tabler-icon-diamond-filled.svg

Paraphrase This Document

Need a fresh take? Get an instant paraphrase of this document with our AI Paraphraser
Document Page
Graph
In the present investigation, most of the respondents are belonging from Punjab. For the
current research, views have been gathered by the researcher from 11742 people. Hence, by
taking into account such aspect it can be presented most of the respondents are from Punjab. On
the other side, 3521 respondents belong from Sindh. Hence, majority of the people belong from
Punjab and thereafter Sindh on second position.
Relationship to the household
Document Page
Statistics
Relationship to household
head
N
Valid 11742
Missing 0
Mode 2
Relationship to household head
Frequency Percent Valid Percent Cumulative
Percent
Valid Head 449 3.8 3.8 3.8
Wife or husband 6187 52.7 52.7 56.5
Son/daughter 444 3.8 3.8 60.3
Son/daughter-in-law 3577 30.5 30.5 90.8
Grandchild 7 .1 .1 90.8
Parent 24 .2 .2 91.0
Brother/sister 121 1.0 1.0 92.1
Other relative 80 .7 .7 92.7
chevron_up_icon
1 out of 24
circle_padding
hide_on_mobile
zoom_out_icon
[object Object]