ACFI5020: EasyJet Plc and Ryanair Financial Performance Comparison
VerifiedAdded on 2023/04/21
|17
|3710
|498
Report
AI Summary
This report provides a detailed financial performance analysis of EasyJet Plc from 2013 to 2017, comparing it with its major competitor, Ryanair. The analysis encompasses profitability, liquidity, working capital efficiency, solvency, and investor perspective ratios. The profitability analysis, including net margin and return on capital employed, reveals EasyJet's declining net margin and Ryanair's competitive edge. Liquidity analysis, using current and cash ratios, shows Ryanair in a better position. Working capital efficiency, assessed through receivables and payables turnover, indicates EasyJet's superior position. Solvency analysis, using debt-to-equity and interest cover ratios, highlights EasyJet's lower investment risk. Finally, the investor perspective analysis, including return on assets and dividend payout ratio, suggests a more favorable position for EasyJet Plc. The report concludes by recommending that investors hold EasyJet shares and buy more for better returns, considering the overall financial health and strategic decisions of both airlines.
Running head: ACCOUNTING FOR MANAGERS
Accounting for Managers
Name of the Student:
Name of the University:
Author’s Note:
Course ID:
Accounting for Managers
Name of the Student:
Name of the University:
Author’s Note:
Course ID:
Paraphrase This Document
Need a fresh take? Get an instant paraphrase of this document with our AI Paraphraser

1ACCOUNTING FOR MANAGERS
Table of Contents
Task One:...................................................................................................................................2
Task Two:.................................................................................................................................10
Task Three:...............................................................................................................................10
References:...............................................................................................................................14
2ACCOUNTING FOR MANAGERS
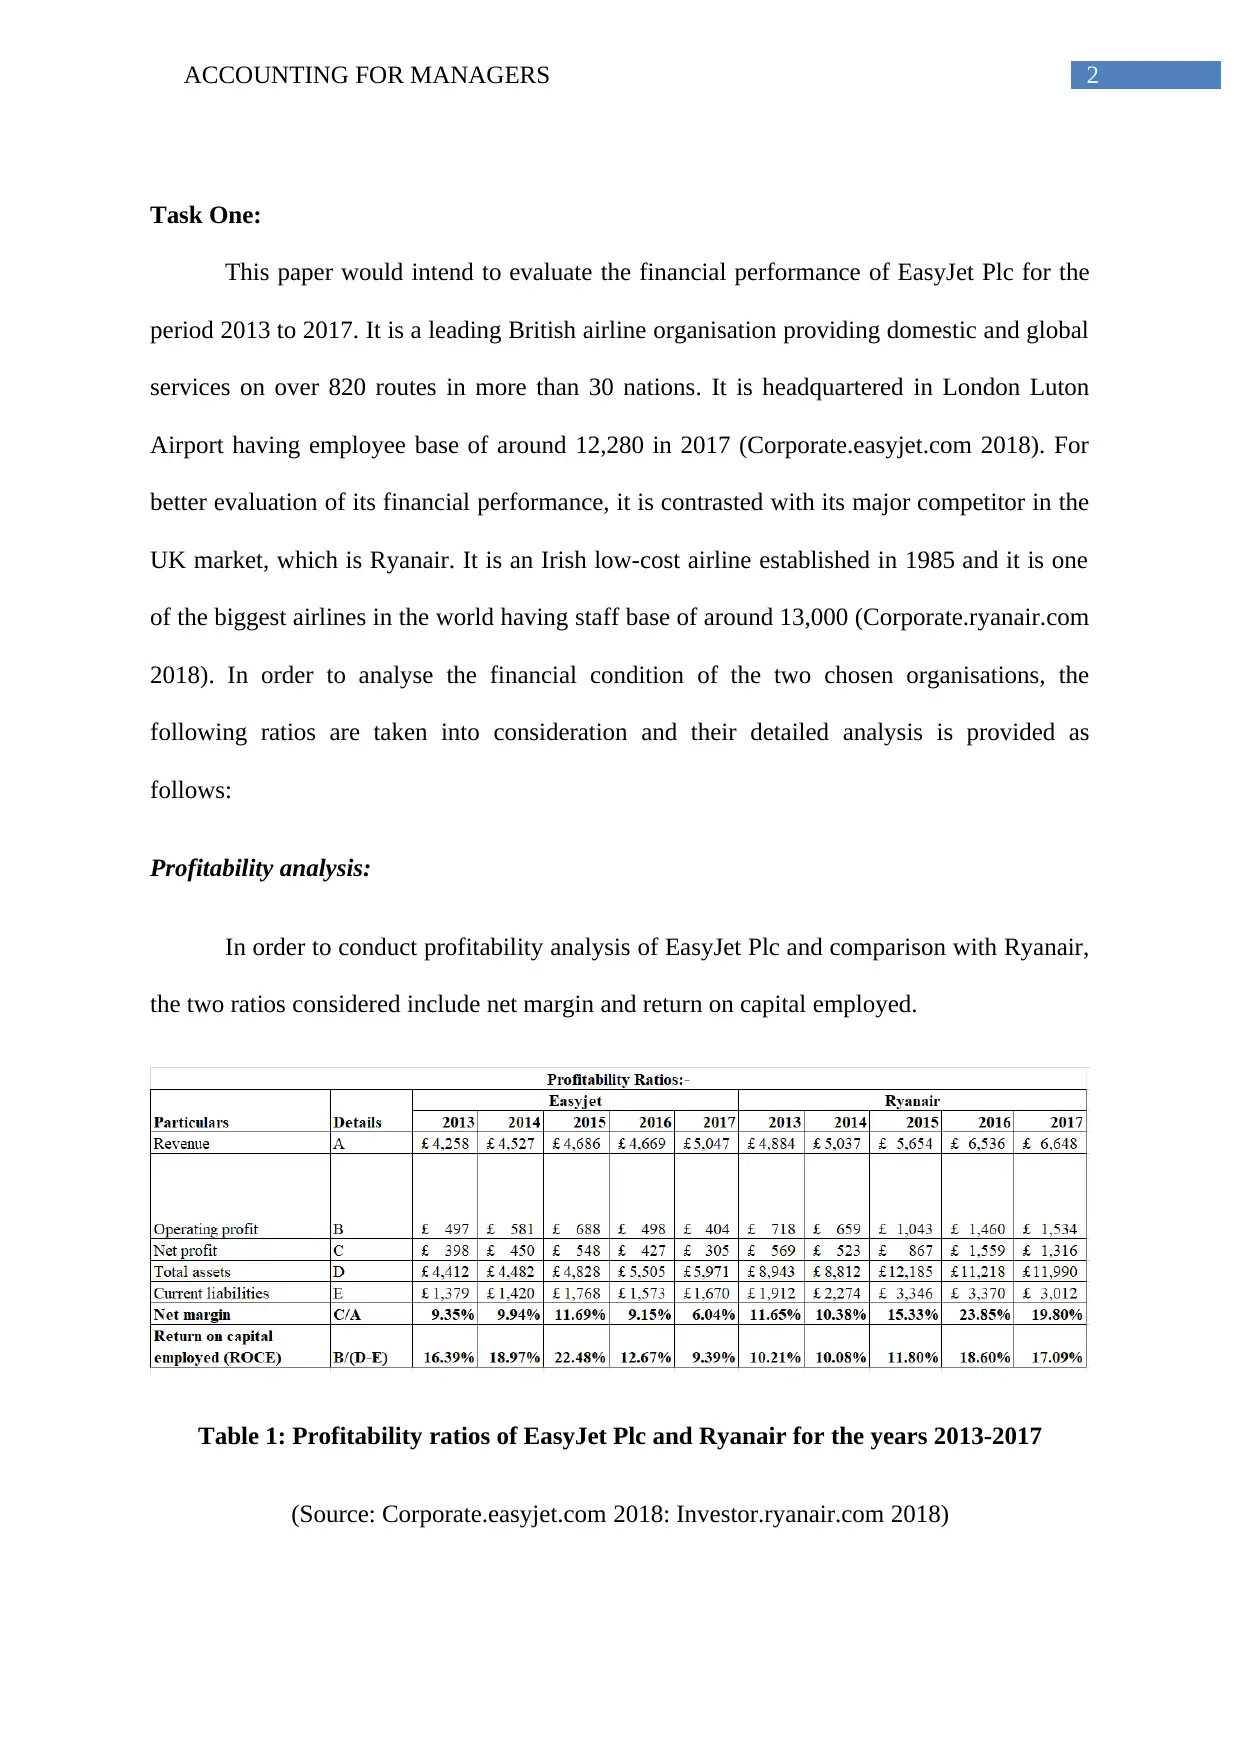
Task One:
This paper would intend to evaluate the financial performance of EasyJet Plc for the
period 2013 to 2017. It is a leading British airline organisation providing domestic and global
services on over 820 routes in more than 30 nations. It is headquartered in London Luton
Airport having employee base of around 12,280 in 2017 (Corporate.easyjet.com 2018). For
better evaluation of its financial performance, it is contrasted with its major competitor in the
UK market, which is Ryanair. It is an Irish low-cost airline established in 1985 and it is one
of the biggest airlines in the world having staff base of around 13,000 (Corporate.ryanair.com
2018). In order to analyse the financial condition of the two chosen organisations, the
following ratios are taken into consideration and their detailed analysis is provided as
follows:
Profitability analysis:
In order to conduct profitability analysis of EasyJet Plc and comparison with Ryanair,
the two ratios considered include net margin and return on capital employed.
Table 1: Profitability ratios of EasyJet Plc and Ryanair for the years 2013-2017
(Source: Corporate.easyjet.com 2018: Investor.ryanair.com 2018)
⊘ This is a preview!⊘
Do you want full access?
Subscribe today to unlock all pages.
Trusted by 1+ million students worldwide
3ACCOUNTING FOR MANAGERS
2013
2014
2015
2016
2017
2013
2014
2015
2016
2017
Easyjet Ryanair
0.00%
5.00%
10.00%
15.00%
20.00%
25.00%
30.00%
Profitability Ratios
Net margin
Return on capital
employed (ROCE)
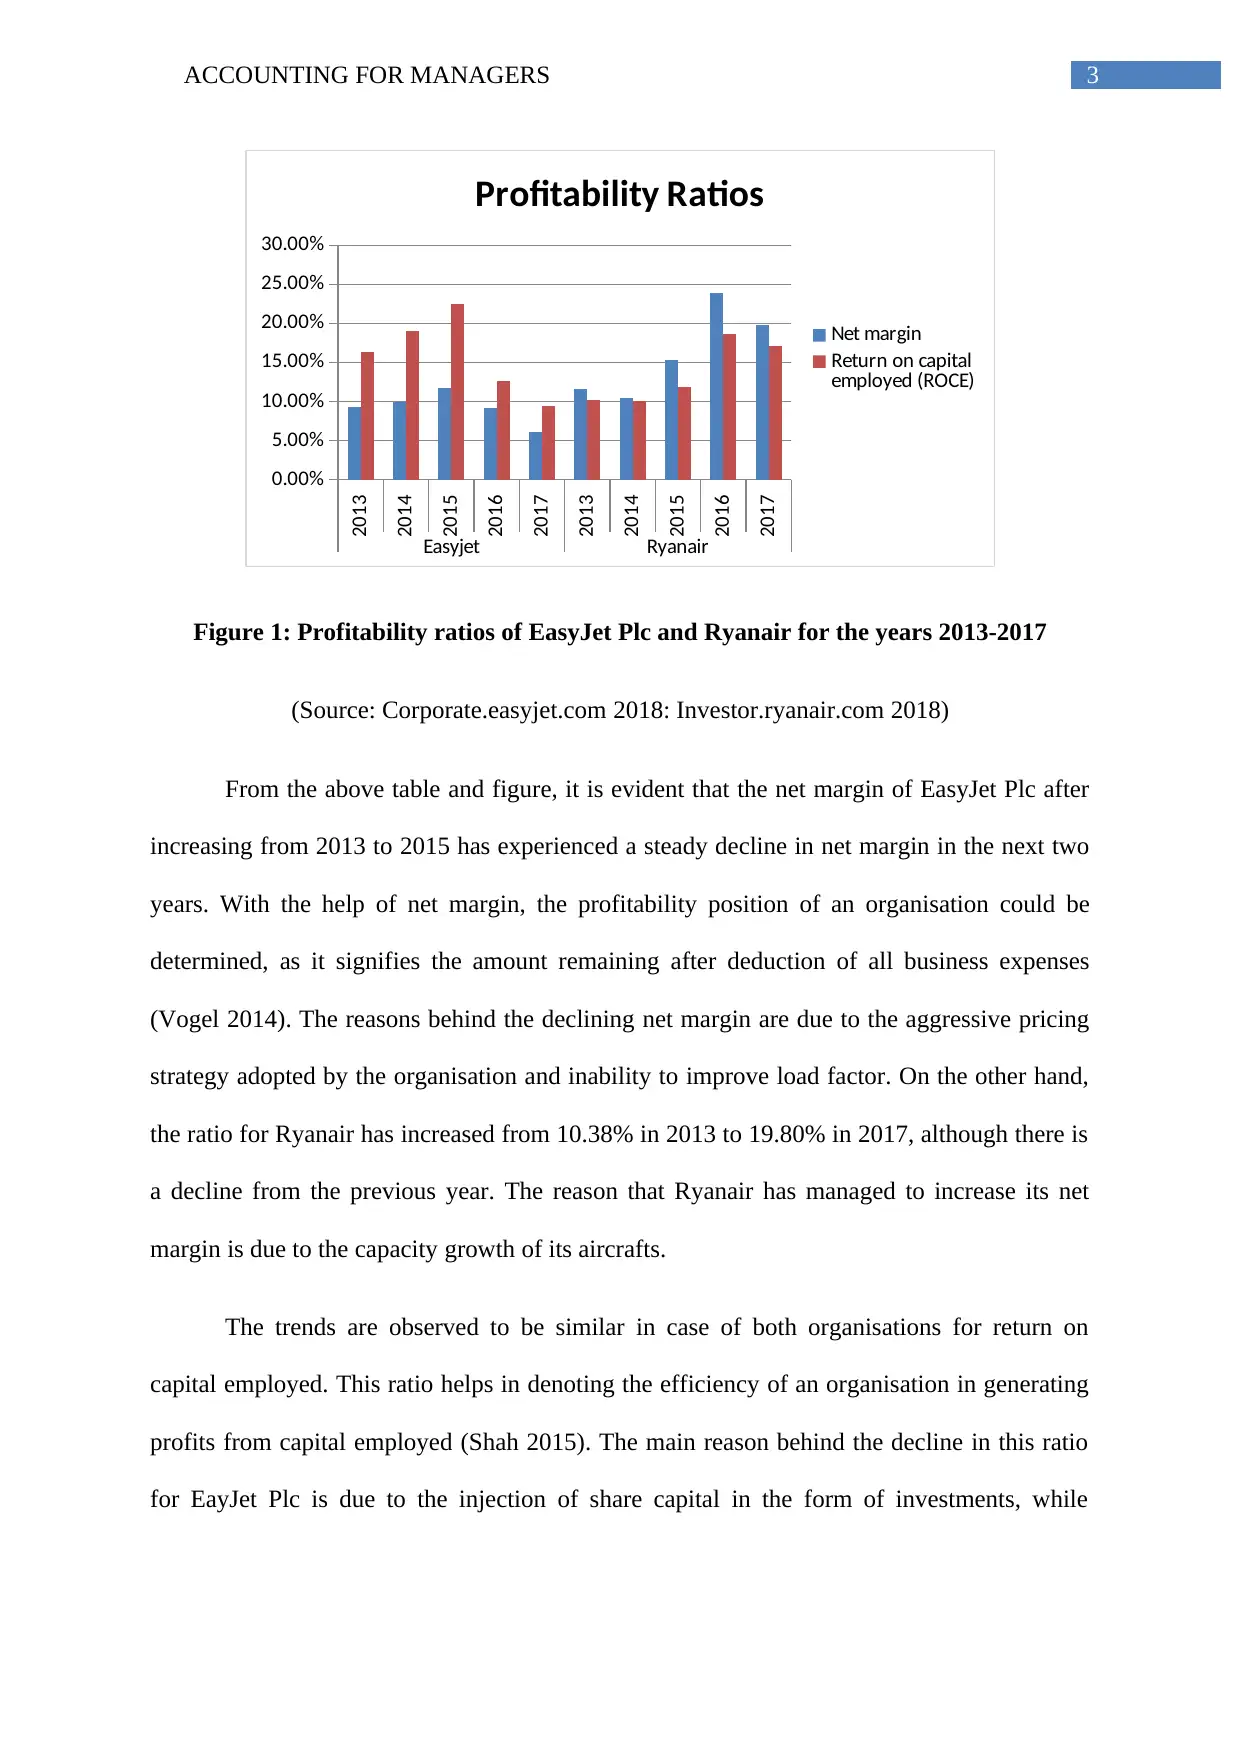
Figure 1: Profitability ratios of EasyJet Plc and Ryanair for the years 2013-2017
(Source: Corporate.easyjet.com 2018: Investor.ryanair.com 2018)
From the above table and figure, it is evident that the net margin of EasyJet Plc after
increasing from 2013 to 2015 has experienced a steady decline in net margin in the next two
years. With the help of net margin, the profitability position of an organisation could be
determined, as it signifies the amount remaining after deduction of all business expenses
(Vogel 2014). The reasons behind the declining net margin are due to the aggressive pricing
strategy adopted by the organisation and inability to improve load factor. On the other hand,
the ratio for Ryanair has increased from 10.38% in 2013 to 19.80% in 2017, although there is
a decline from the previous year. The reason that Ryanair has managed to increase its net
margin is due to the capacity growth of its aircrafts.
The trends are observed to be similar in case of both organisations for return on
capital employed. This ratio helps in denoting the efficiency of an organisation in generating
profits from capital employed (Shah 2015). The main reason behind the decline in this ratio
for EayJet Plc is due to the injection of share capital in the form of investments, while
2013
2014
2015
2016
2017
2013
2014
2015
2016
2017
Easyjet Ryanair
0.00%
5.00%
10.00%
15.00%
20.00%
25.00%
30.00%
Profitability Ratios
Net margin
Return on capital
employed (ROCE)
Figure 1: Profitability ratios of EasyJet Plc and Ryanair for the years 2013-2017
(Source: Corporate.easyjet.com 2018: Investor.ryanair.com 2018)
From the above table and figure, it is evident that the net margin of EasyJet Plc after
increasing from 2013 to 2015 has experienced a steady decline in net margin in the next two
years. With the help of net margin, the profitability position of an organisation could be
determined, as it signifies the amount remaining after deduction of all business expenses
(Vogel 2014). The reasons behind the declining net margin are due to the aggressive pricing
strategy adopted by the organisation and inability to improve load factor. On the other hand,
the ratio for Ryanair has increased from 10.38% in 2013 to 19.80% in 2017, although there is
a decline from the previous year. The reason that Ryanair has managed to increase its net
margin is due to the capacity growth of its aircrafts.
The trends are observed to be similar in case of both organisations for return on
capital employed. This ratio helps in denoting the efficiency of an organisation in generating
profits from capital employed (Shah 2015). The main reason behind the decline in this ratio
for EayJet Plc is due to the injection of share capital in the form of investments, while
Paraphrase This Document
Need a fresh take? Get an instant paraphrase of this document with our AI Paraphraser
4ACCOUNTING FOR MANAGERS
Ryanair has maintained identical share capital and reserves. Hence, from the profitability
viewpoint, Ryanair is holding competitive edge over EasyJet Plc in the UK market.
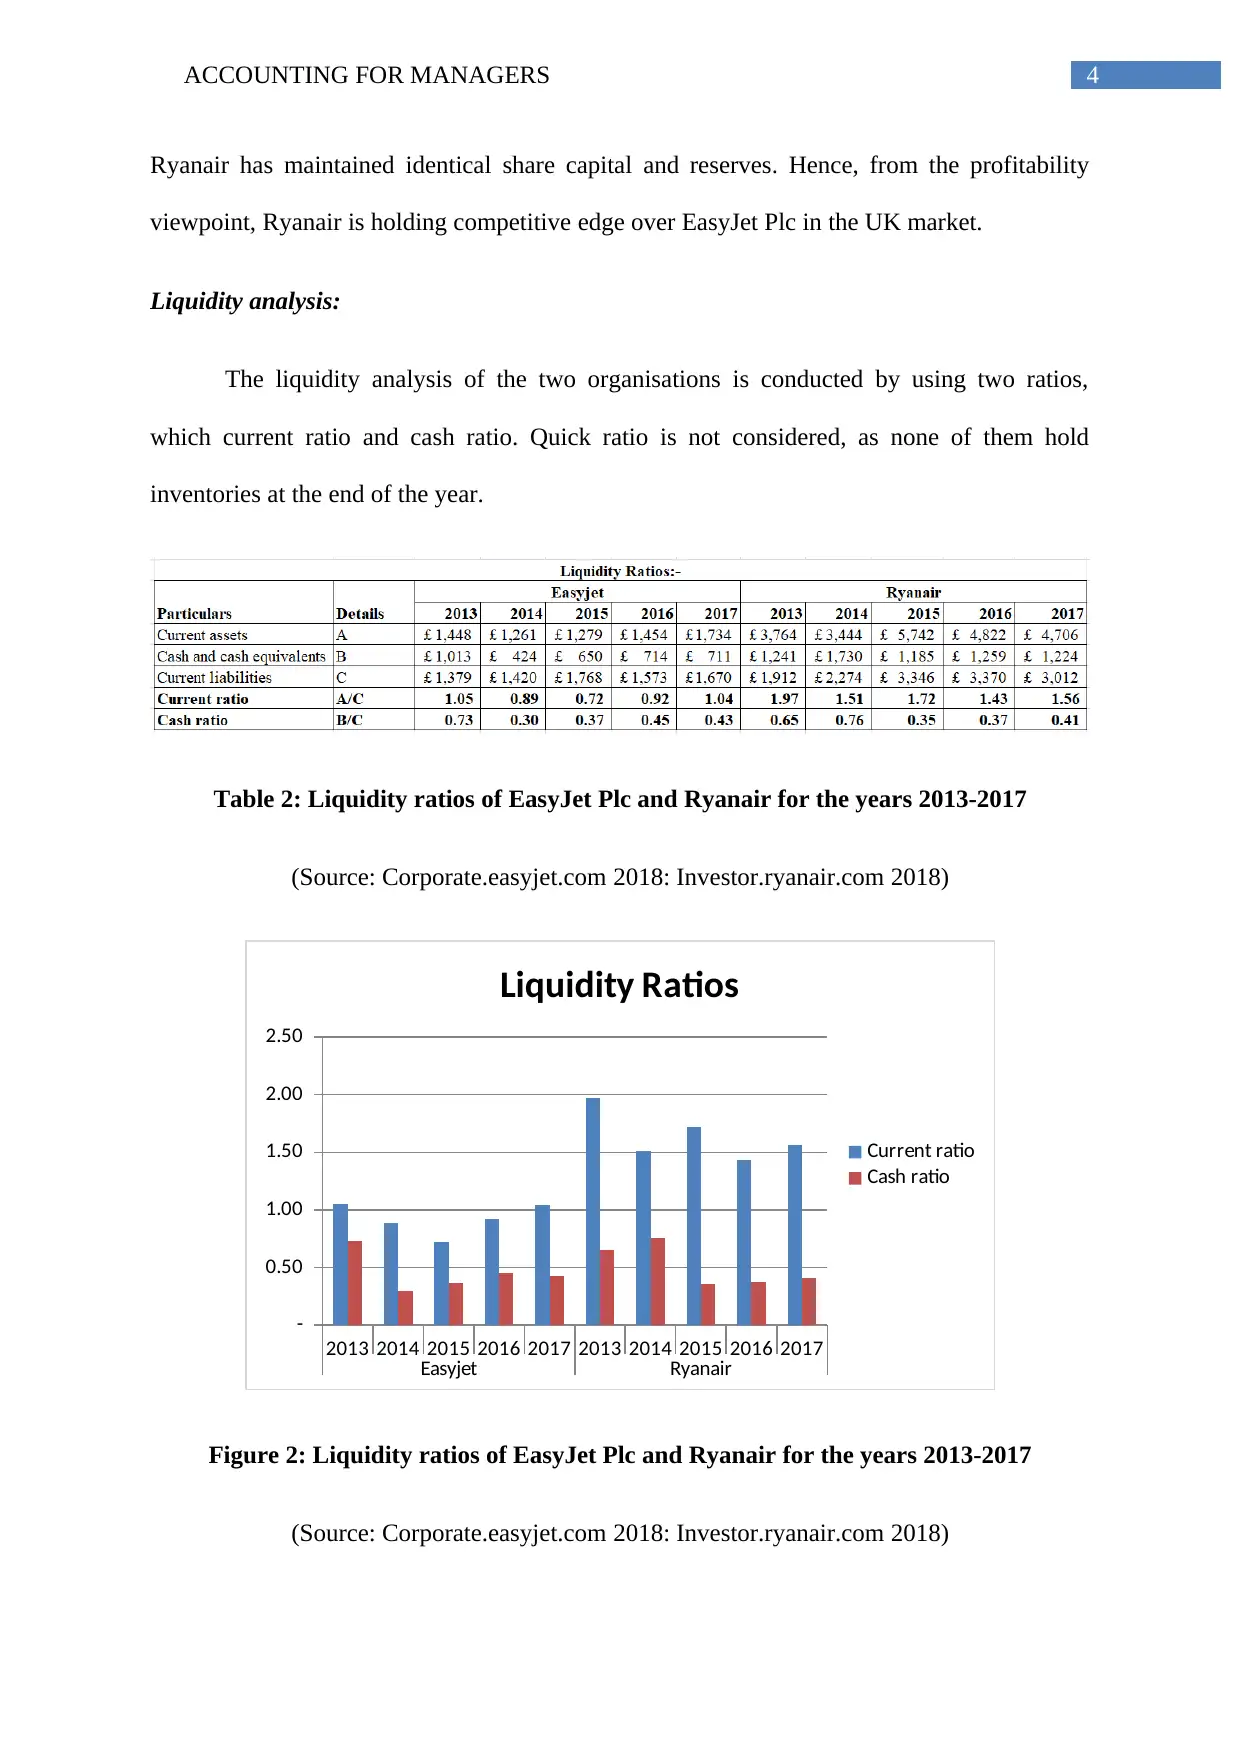
Liquidity analysis:
The liquidity analysis of the two organisations is conducted by using two ratios,
which current ratio and cash ratio. Quick ratio is not considered, as none of them hold
inventories at the end of the year.
Table 2: Liquidity ratios of EasyJet Plc and Ryanair for the years 2013-2017
(Source: Corporate.easyjet.com 2018: Investor.ryanair.com 2018)
2013 2014 2015 2016 2017 2013 2014 2015 2016 2017
Easyjet Ryanair
-
0.50
1.00
1.50
2.00
2.50
Liquidity Ratios
Current ratio
Cash ratio
Figure 2: Liquidity ratios of EasyJet Plc and Ryanair for the years 2013-2017
(Source: Corporate.easyjet.com 2018: Investor.ryanair.com 2018)
Ryanair has maintained identical share capital and reserves. Hence, from the profitability
viewpoint, Ryanair is holding competitive edge over EasyJet Plc in the UK market.
Liquidity analysis:
The liquidity analysis of the two organisations is conducted by using two ratios,
which current ratio and cash ratio. Quick ratio is not considered, as none of them hold
inventories at the end of the year.
Table 2: Liquidity ratios of EasyJet Plc and Ryanair for the years 2013-2017
(Source: Corporate.easyjet.com 2018: Investor.ryanair.com 2018)
2013 2014 2015 2016 2017 2013 2014 2015 2016 2017
Easyjet Ryanair
-
0.50
1.00
1.50
2.00
2.50
Liquidity Ratios
Current ratio
Cash ratio
Figure 2: Liquidity ratios of EasyJet Plc and Ryanair for the years 2013-2017
(Source: Corporate.easyjet.com 2018: Investor.ryanair.com 2018)
5ACCOUNTING FOR MANAGERS
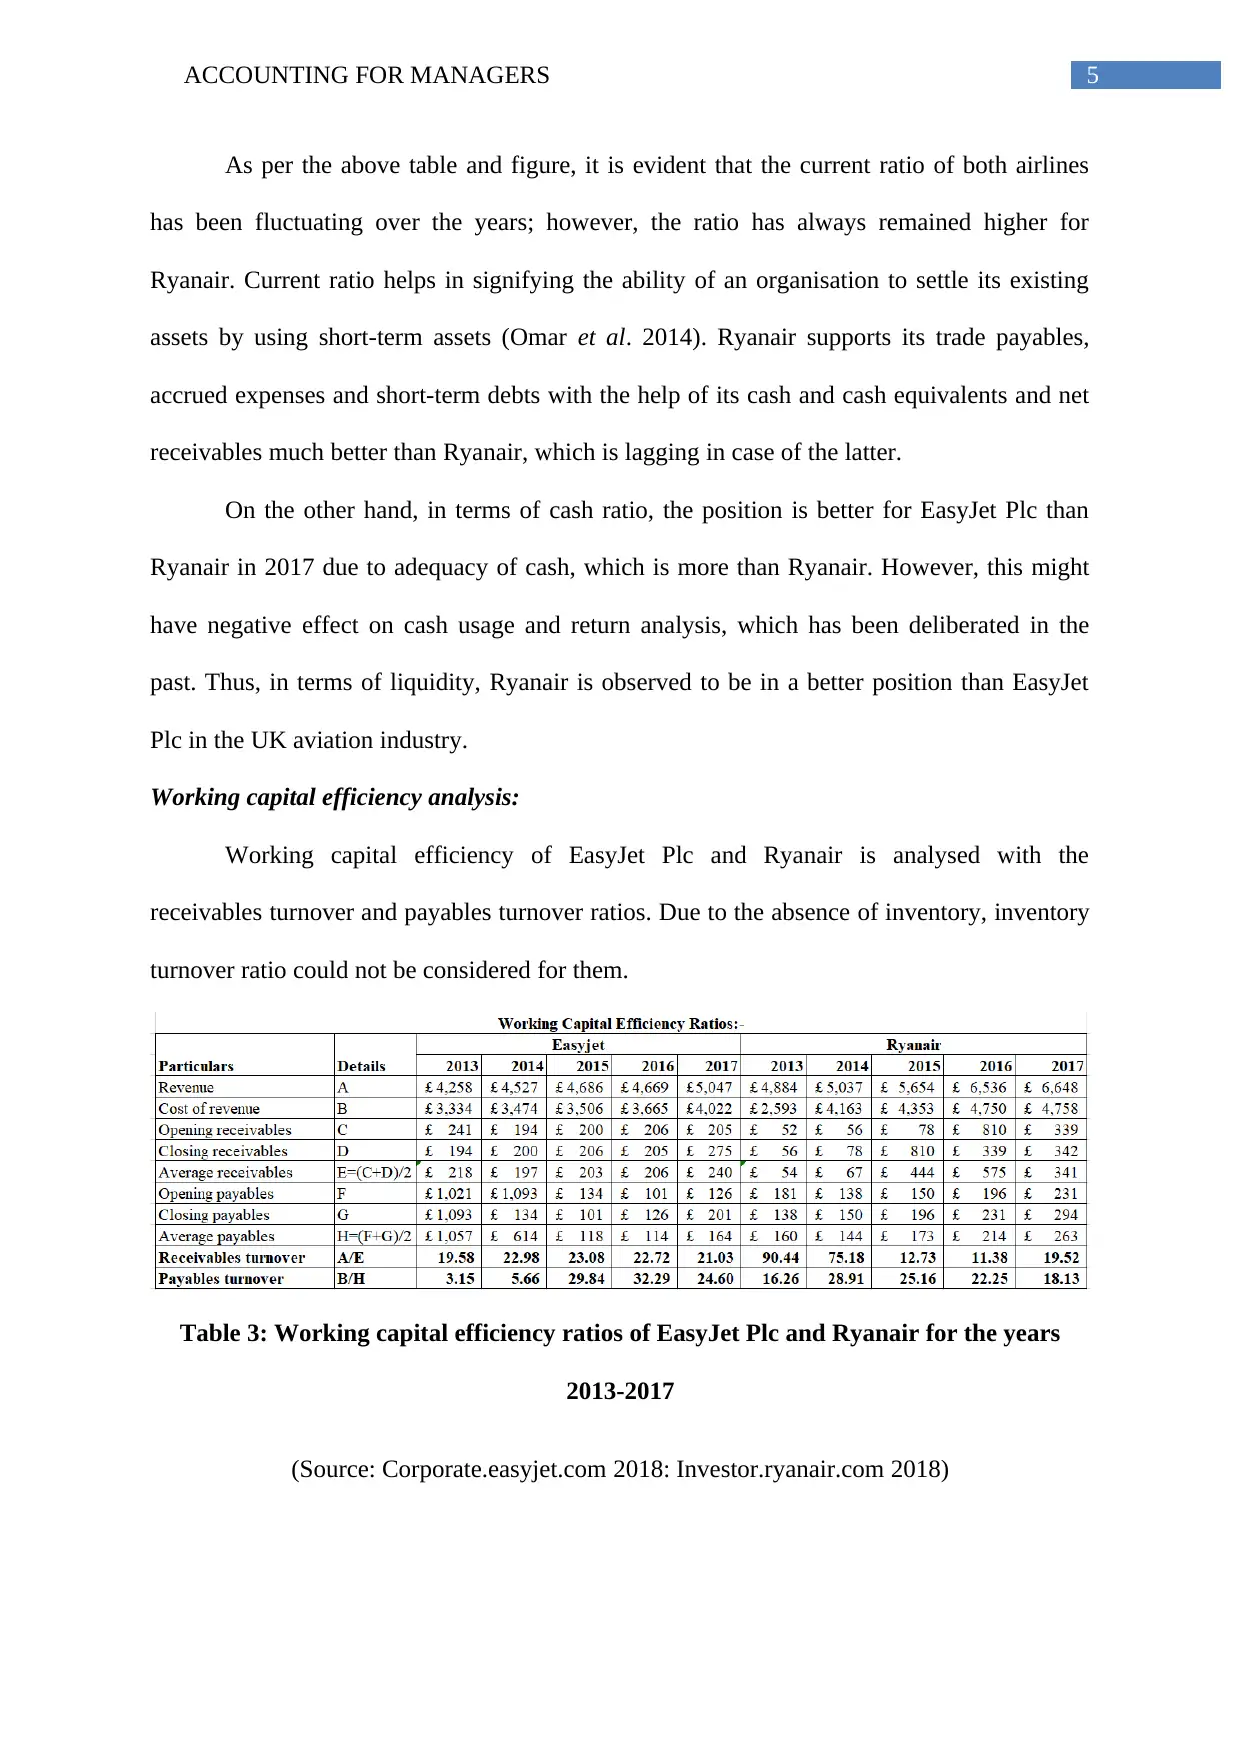
As per the above table and figure, it is evident that the current ratio of both airlines
has been fluctuating over the years; however, the ratio has always remained higher for
Ryanair. Current ratio helps in signifying the ability of an organisation to settle its existing
assets by using short-term assets (Omar et al. 2014). Ryanair supports its trade payables,
accrued expenses and short-term debts with the help of its cash and cash equivalents and net
receivables much better than Ryanair, which is lagging in case of the latter.
On the other hand, in terms of cash ratio, the position is better for EasyJet Plc than
Ryanair in 2017 due to adequacy of cash, which is more than Ryanair. However, this might
have negative effect on cash usage and return analysis, which has been deliberated in the
past. Thus, in terms of liquidity, Ryanair is observed to be in a better position than EasyJet
Plc in the UK aviation industry.
Working capital efficiency analysis:
Working capital efficiency of EasyJet Plc and Ryanair is analysed with the
receivables turnover and payables turnover ratios. Due to the absence of inventory, inventory
turnover ratio could not be considered for them.
Table 3: Working capital efficiency ratios of EasyJet Plc and Ryanair for the years
2013-2017
(Source: Corporate.easyjet.com 2018: Investor.ryanair.com 2018)
⊘ This is a preview!⊘
Do you want full access?
Subscribe today to unlock all pages.
Trusted by 1+ million students worldwide
6ACCOUNTING FOR MANAGERS
2013
2014
2015
2016
2017
2013
2014
2015
2016
2017
Easyjet Ryanair
-
10.00
20.00
30.00
40.00
50.00
60.00
70.00
80.00
90.00
100.00
Working Capital Efficiency Ratios
Receivables turnover
Payables turnover
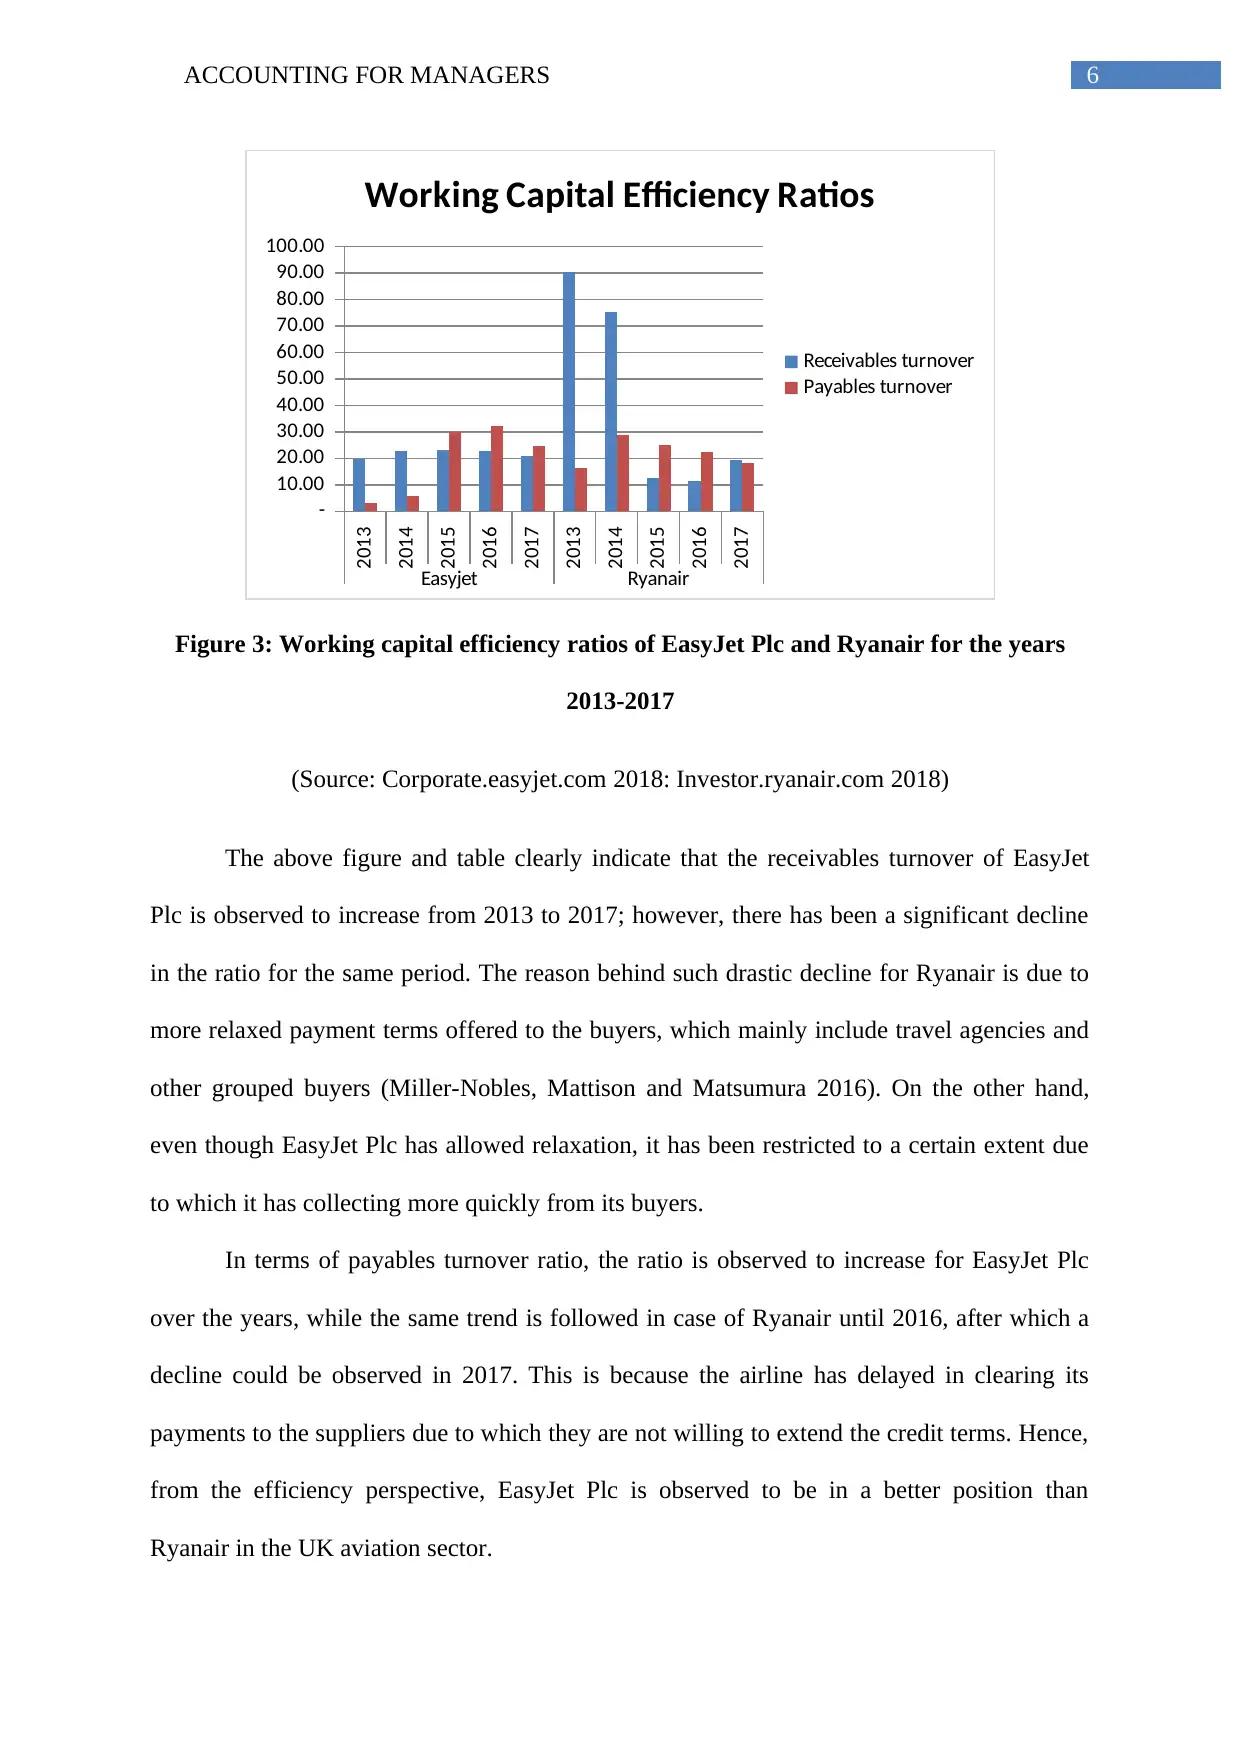
Figure 3: Working capital efficiency ratios of EasyJet Plc and Ryanair for the years
2013-2017
(Source: Corporate.easyjet.com 2018: Investor.ryanair.com 2018)
The above figure and table clearly indicate that the receivables turnover of EasyJet
Plc is observed to increase from 2013 to 2017; however, there has been a significant decline
in the ratio for the same period. The reason behind such drastic decline for Ryanair is due to
more relaxed payment terms offered to the buyers, which mainly include travel agencies and
other grouped buyers (Miller-Nobles, Mattison and Matsumura 2016). On the other hand,
even though EasyJet Plc has allowed relaxation, it has been restricted to a certain extent due
to which it has collecting more quickly from its buyers.
In terms of payables turnover ratio, the ratio is observed to increase for EasyJet Plc
over the years, while the same trend is followed in case of Ryanair until 2016, after which a
decline could be observed in 2017. This is because the airline has delayed in clearing its
payments to the suppliers due to which they are not willing to extend the credit terms. Hence,
from the efficiency perspective, EasyJet Plc is observed to be in a better position than
Ryanair in the UK aviation sector.
2013
2014
2015
2016
2017
2013
2014
2015
2016
2017
Easyjet Ryanair
-
10.00
20.00
30.00
40.00
50.00
60.00
70.00
80.00
90.00
100.00
Working Capital Efficiency Ratios
Receivables turnover
Payables turnover
Figure 3: Working capital efficiency ratios of EasyJet Plc and Ryanair for the years
2013-2017
(Source: Corporate.easyjet.com 2018: Investor.ryanair.com 2018)
The above figure and table clearly indicate that the receivables turnover of EasyJet
Plc is observed to increase from 2013 to 2017; however, there has been a significant decline
in the ratio for the same period. The reason behind such drastic decline for Ryanair is due to
more relaxed payment terms offered to the buyers, which mainly include travel agencies and
other grouped buyers (Miller-Nobles, Mattison and Matsumura 2016). On the other hand,
even though EasyJet Plc has allowed relaxation, it has been restricted to a certain extent due
to which it has collecting more quickly from its buyers.
In terms of payables turnover ratio, the ratio is observed to increase for EasyJet Plc
over the years, while the same trend is followed in case of Ryanair until 2016, after which a
decline could be observed in 2017. This is because the airline has delayed in clearing its
payments to the suppliers due to which they are not willing to extend the credit terms. Hence,
from the efficiency perspective, EasyJet Plc is observed to be in a better position than
Ryanair in the UK aviation sector.
Paraphrase This Document
Need a fresh take? Get an instant paraphrase of this document with our AI Paraphraser
7ACCOUNTING FOR MANAGERS
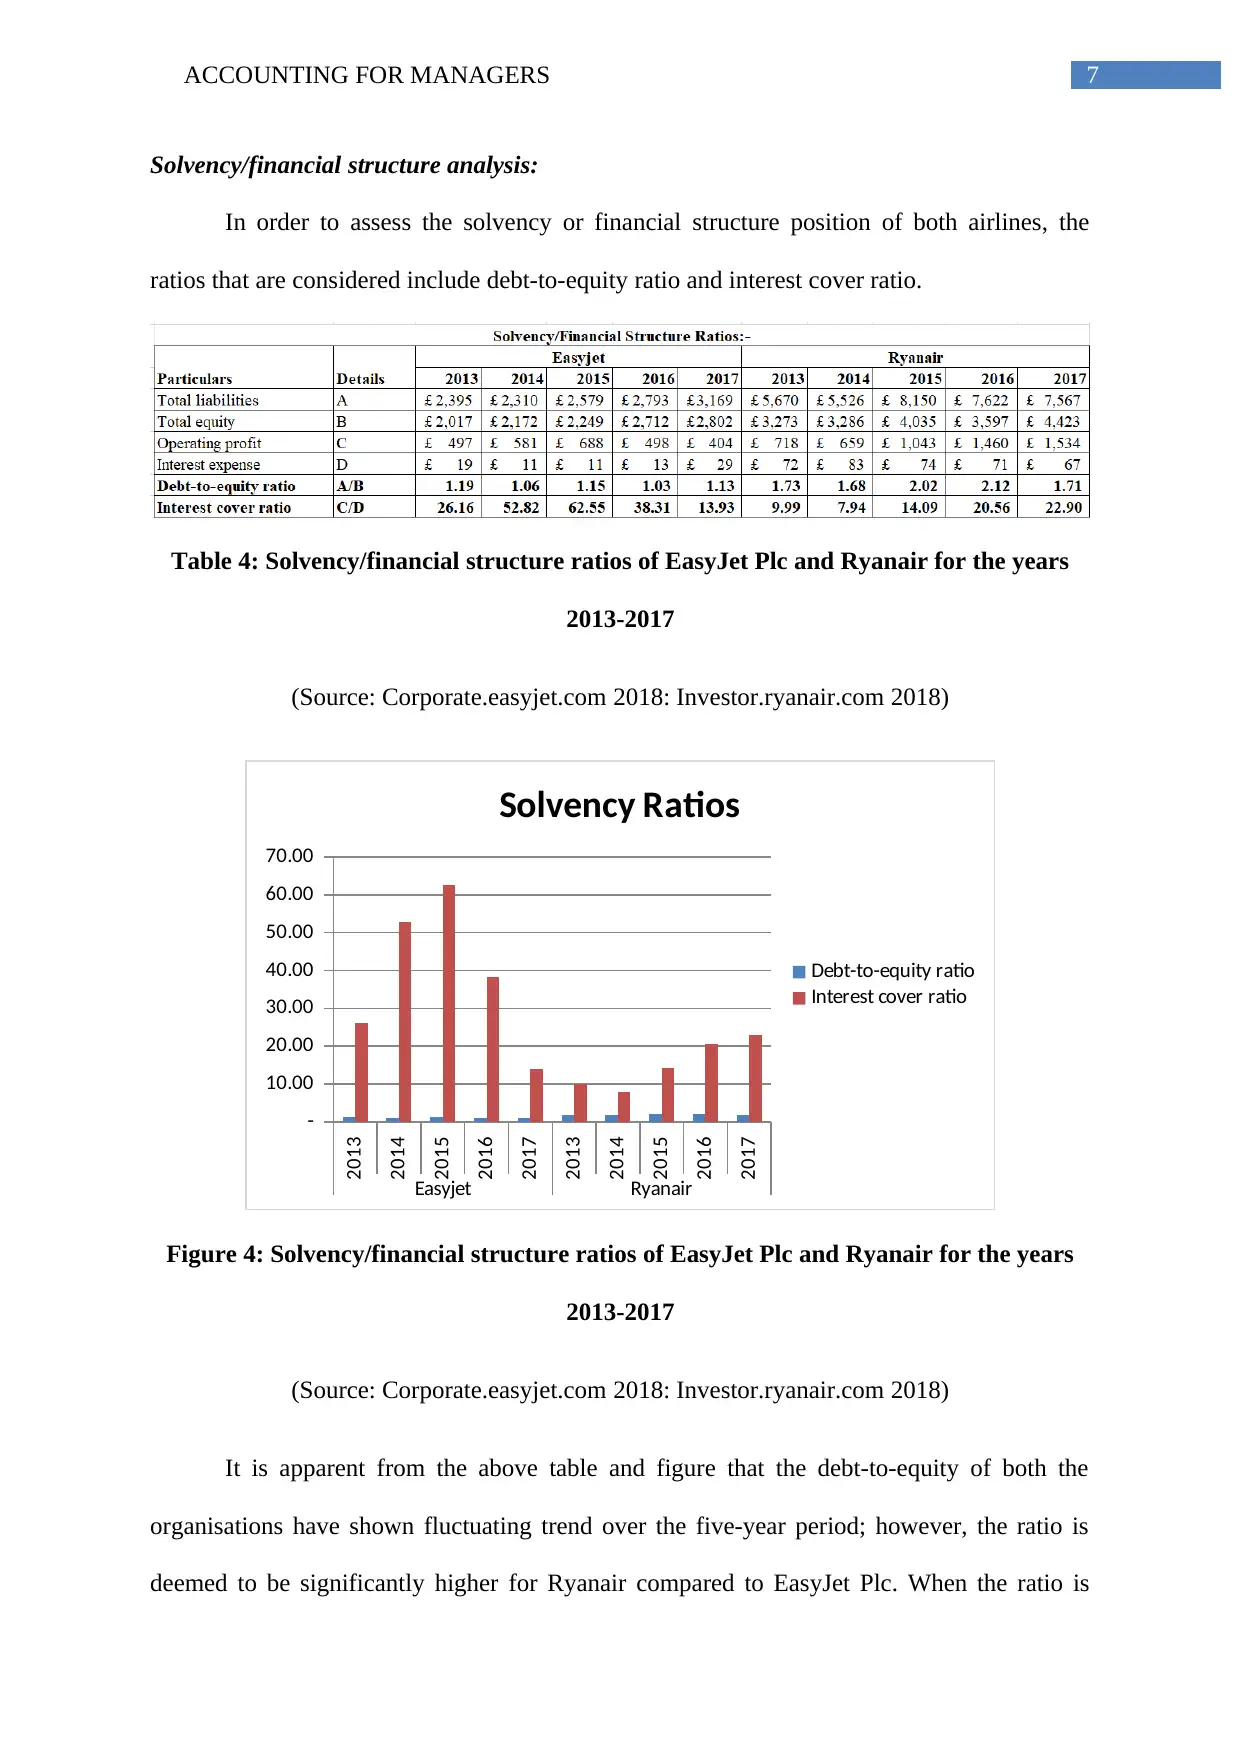
Solvency/financial structure analysis:
In order to assess the solvency or financial structure position of both airlines, the
ratios that are considered include debt-to-equity ratio and interest cover ratio.
Table 4: Solvency/financial structure ratios of EasyJet Plc and Ryanair for the years
2013-2017
(Source: Corporate.easyjet.com 2018: Investor.ryanair.com 2018)
2013
2014
2015
2016
2017
2013
2014
2015
2016
2017
Easyjet Ryanair
-
10.00
20.00
30.00
40.00
50.00
60.00
70.00
Solvency Ratios
Debt-to-equity ratio
Interest cover ratio
Figure 4: Solvency/financial structure ratios of EasyJet Plc and Ryanair for the years
2013-2017
(Source: Corporate.easyjet.com 2018: Investor.ryanair.com 2018)
It is apparent from the above table and figure that the debt-to-equity of both the
organisations have shown fluctuating trend over the five-year period; however, the ratio is
deemed to be significantly higher for Ryanair compared to EasyJet Plc. When the ratio is
8ACCOUNTING FOR MANAGERS
above 1, it implies that the organisation has high financial leverage or contains more
investment risk and vice-versa (Enekwe 2015). In this case, both organisations are observed
to have high financial leverage; however, the position is better for EasyJet Plc. This is
because it has managed to minimise its short-term as well as long-term borrowings along
with minimisation of finance costs for interest bearing loans, while the situation is just the
opposite for Ryanair.
Interest cover ratio evaluates the capability of an organisation in settling off its
finance costs with the help of operating profit (Almamy, Aston and Ngwa 2016). In case of
EasyJet Plc, the ratio after increasing from 2013 to 2015 has declined drastically in both 2016
and 2017. On the other hand, the ratio has increased over the years for Ryanair and in 2017; it
has been more than EasyJet Plc. The reason is due to the increased indirect costs incurred by
EasyJet Plc than Ryanair and injection of capital to support borrowings has assisted the latter
to increase its interest cover ratio. However, the ratio of both airlines is above the ideal
standard of 1. Hence, in terms of solvency, EasyJet Plc is enjoying competitive supremacy
over Ryanair owing to lower investment risk than Ryanair.
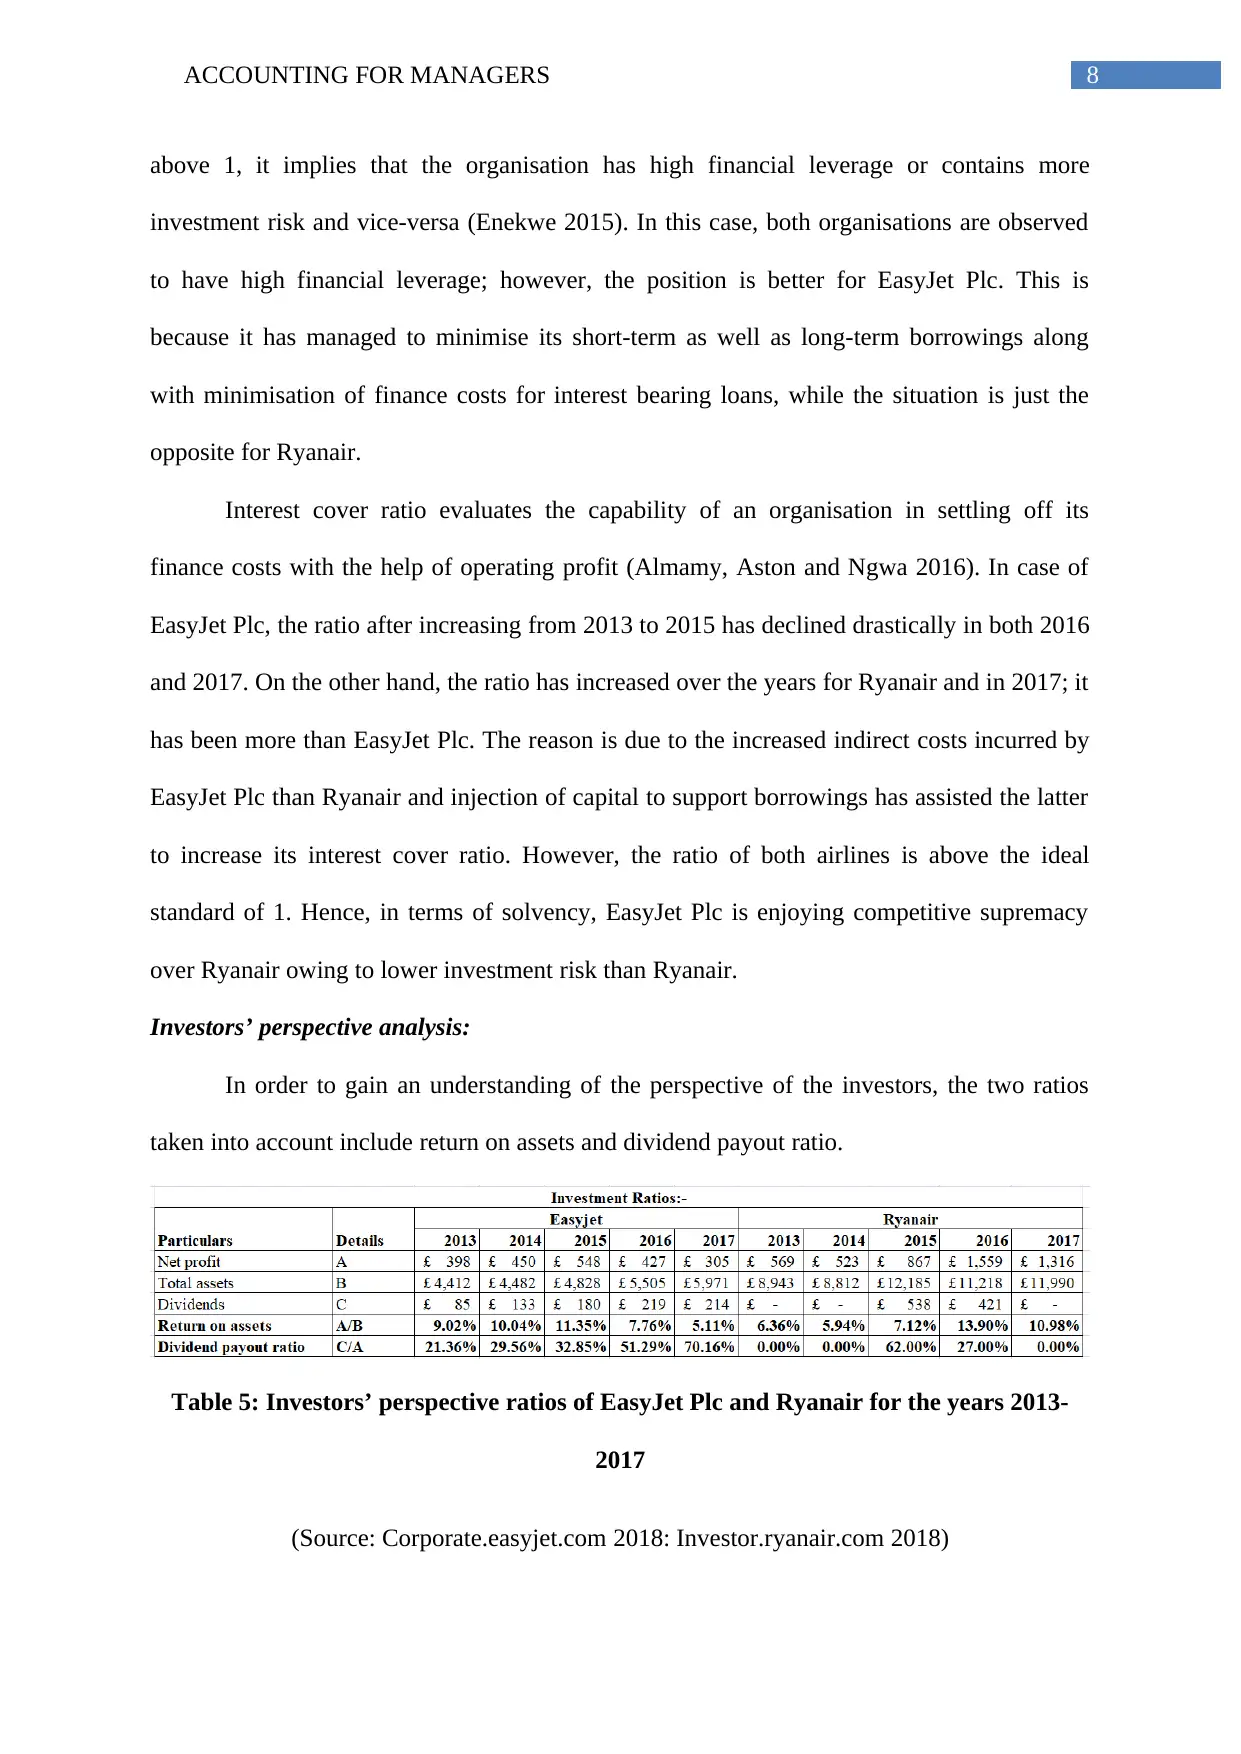
Investors’ perspective analysis:
In order to gain an understanding of the perspective of the investors, the two ratios
taken into account include return on assets and dividend payout ratio.
Table 5: Investors’ perspective ratios of EasyJet Plc and Ryanair for the years 2013-
2017
(Source: Corporate.easyjet.com 2018: Investor.ryanair.com 2018)
above 1, it implies that the organisation has high financial leverage or contains more
investment risk and vice-versa (Enekwe 2015). In this case, both organisations are observed
to have high financial leverage; however, the position is better for EasyJet Plc. This is
because it has managed to minimise its short-term as well as long-term borrowings along
with minimisation of finance costs for interest bearing loans, while the situation is just the
opposite for Ryanair.
Interest cover ratio evaluates the capability of an organisation in settling off its
finance costs with the help of operating profit (Almamy, Aston and Ngwa 2016). In case of
EasyJet Plc, the ratio after increasing from 2013 to 2015 has declined drastically in both 2016
and 2017. On the other hand, the ratio has increased over the years for Ryanair and in 2017; it
has been more than EasyJet Plc. The reason is due to the increased indirect costs incurred by
EasyJet Plc than Ryanair and injection of capital to support borrowings has assisted the latter
to increase its interest cover ratio. However, the ratio of both airlines is above the ideal
standard of 1. Hence, in terms of solvency, EasyJet Plc is enjoying competitive supremacy
over Ryanair owing to lower investment risk than Ryanair.
Investors’ perspective analysis:
In order to gain an understanding of the perspective of the investors, the two ratios
taken into account include return on assets and dividend payout ratio.
Table 5: Investors’ perspective ratios of EasyJet Plc and Ryanair for the years 2013-
2017
(Source: Corporate.easyjet.com 2018: Investor.ryanair.com 2018)
⊘ This is a preview!⊘
Do you want full access?
Subscribe today to unlock all pages.
Trusted by 1+ million students worldwide
9ACCOUNTING FOR MANAGERS
2013
2014
2015
2016
2017
2013
2014
2015
2016
2017
Easyjet Ryanair
0.00%
10.00%
20.00%
30.00%
40.00%
50.00%
60.00%
70.00%
80.00%
Investment Ratios
Return on assets
Dividend payout ratio
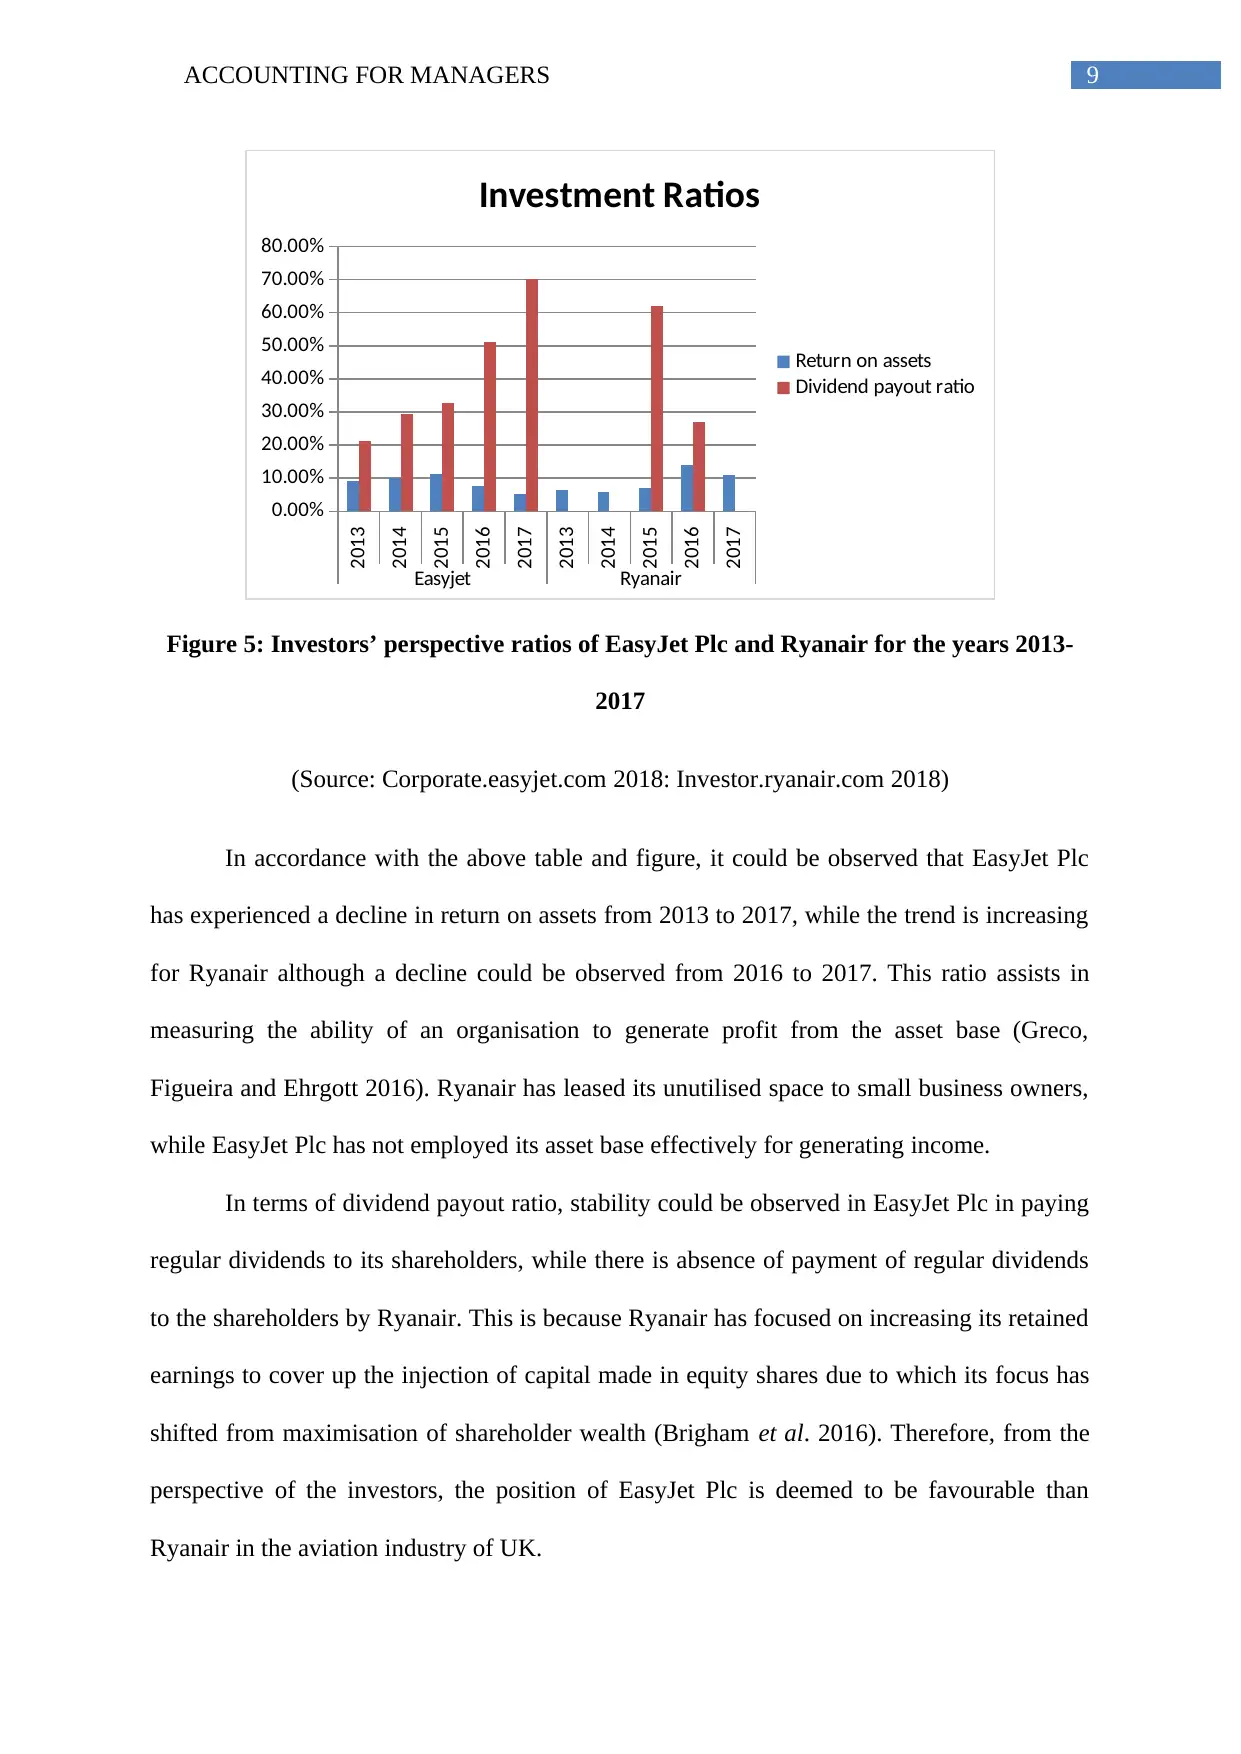
Figure 5: Investors’ perspective ratios of EasyJet Plc and Ryanair for the years 2013-
2017
(Source: Corporate.easyjet.com 2018: Investor.ryanair.com 2018)
In accordance with the above table and figure, it could be observed that EasyJet Plc
has experienced a decline in return on assets from 2013 to 2017, while the trend is increasing
for Ryanair although a decline could be observed from 2016 to 2017. This ratio assists in
measuring the ability of an organisation to generate profit from the asset base (Greco,
Figueira and Ehrgott 2016). Ryanair has leased its unutilised space to small business owners,
while EasyJet Plc has not employed its asset base effectively for generating income.
In terms of dividend payout ratio, stability could be observed in EasyJet Plc in paying
regular dividends to its shareholders, while there is absence of payment of regular dividends
to the shareholders by Ryanair. This is because Ryanair has focused on increasing its retained
earnings to cover up the injection of capital made in equity shares due to which its focus has
shifted from maximisation of shareholder wealth (Brigham et al. 2016). Therefore, from the
perspective of the investors, the position of EasyJet Plc is deemed to be favourable than
Ryanair in the aviation industry of UK.
2013
2014
2015
2016
2017
2013
2014
2015
2016
2017
Easyjet Ryanair
0.00%
10.00%
20.00%
30.00%
40.00%
50.00%
60.00%
70.00%
80.00%
Investment Ratios
Return on assets
Dividend payout ratio
Figure 5: Investors’ perspective ratios of EasyJet Plc and Ryanair for the years 2013-
2017
(Source: Corporate.easyjet.com 2018: Investor.ryanair.com 2018)
In accordance with the above table and figure, it could be observed that EasyJet Plc
has experienced a decline in return on assets from 2013 to 2017, while the trend is increasing
for Ryanair although a decline could be observed from 2016 to 2017. This ratio assists in
measuring the ability of an organisation to generate profit from the asset base (Greco,
Figueira and Ehrgott 2016). Ryanair has leased its unutilised space to small business owners,
while EasyJet Plc has not employed its asset base effectively for generating income.
In terms of dividend payout ratio, stability could be observed in EasyJet Plc in paying
regular dividends to its shareholders, while there is absence of payment of regular dividends
to the shareholders by Ryanair. This is because Ryanair has focused on increasing its retained
earnings to cover up the injection of capital made in equity shares due to which its focus has
shifted from maximisation of shareholder wealth (Brigham et al. 2016). Therefore, from the
perspective of the investors, the position of EasyJet Plc is deemed to be favourable than
Ryanair in the aviation industry of UK.
Paraphrase This Document
Need a fresh take? Get an instant paraphrase of this document with our AI Paraphraser
10ACCOUNTING FOR MANAGERS
Task Two:
The above evaluation of different classes of ratios makes it evident that EasyJet Plc is
lagging behind Ryanair when it comes to profitability. However, in terms of liquidity,
working capital efficiency, solvency or financial structure and investors’ perspective, EasyJet
Plc is placed in a favourable position in the UK market in comparison to Ryanair.
Profitability is not the sole factor for undertaking investment decisions. It is observed that
both airlines have high investment risk; however, the risk is closer to the ideal level for
EasyJet Plc. In addition, the organisation pays regular dividends to its shareholders in all the
years. Hence, by considering all these aspects, the investors of EasyJet Plc are suggested to
hold their shares for short-term after which they could buy additional shares for generating
better return on investment.
Task Three:
Supply chain approaches and philosophies of EasyJet Plc:
EasyJet Plc undertakes different philosophies and approaches associated with its
supply chain management so that competitive advantage could be maintained in the UK
airline industry. For example, it has managed to experience immense growth by positioning
itself in the form of a low-cost carrier. By incorporating lean supply chain management, the
organisation has categorised its materials into three classes, which include the following:
Consumable expendables
Consumable repairable
Rotables
The initial category in the model is self-explanatory, while the second category is
material that it considers re-usage based on whether the repairs are promising and economical
11ACCOUNTING FOR MANAGERS
(Sturman 2018). It concentrates on overhauling or repairing its entire asset base until
obsolescence and they are not economical and repairable anymore. This model that EasyJet
Plc has followed has become popular over the passage of time, since it has gathered
necessary knowledge for providing exceptional services. In order to maintain this strategy,
the organisation is involved in monitoring the material usage significant to its airline
operations through constant supervision and vigilance. By maintaining lean strategy in its
operations, EasyJet Plc is estimating a rise of 30% in its profit along with steady rise in shares
in 2018. Hence, by following this approach, the organisation would become the leader in the
UK aviation industry by providing quality services to its customers (Dresner and Zou 2016).
Another lean approach that EasyJet Plc has maintained is optimisation, which
evaluates turnaround time of the elements from repairs back to the state, in which assets are
serviceable. In addition, it has enforced AMOS by aligning its supply chain management for
better maintenance of its business operations (Varley 2014). The contracts of the organisation
are structured in a way that it anticipates the inclusion of aircrafts and for managing repair
management and logistics functions. For example, it has entered into a contract with AJW
that deals with buying materials required for aircraft in relation to the existing operations.
Finally, it takes into account the repair management of its relatable. Hence, it has made
several partnerships in its lean supply chain for assuring material and maintenance activities.
EasyJet Plc has adopted the supply chain management philosophy of “alert system for
deviations”, which concentrates on forming an ability of alerting the stakeholders when there
are variations in the model or developed standards (Christopher 2016). In addition, the
philosophy focuses on the following aspects as well:
The first aspect is stability, in which the airline detects causes for changes and it
undertakes attempts to minimise them
⊘ This is a preview!⊘
Do you want full access?
Subscribe today to unlock all pages.
Trusted by 1+ million students worldwide
1 out of 17
Related Documents


Your All-in-One AI-Powered Toolkit for Academic Success.
+13062052269
info@desklib.com
Available 24*7 on WhatsApp / Email
![[object Object]](/_next/static/media/star-bottom.7253800d.svg)
Unlock your academic potential
Copyright © 2020–2026 A2Z Services. All Rights Reserved. Developed and managed by ZUCOL.