Financial Analysis and Key Performance Indicators for EasyJet
VerifiedAdded on 2023/01/03
|9
|2428
|55
Report
AI Summary
This report provides a comprehensive financial analysis of EasyJet, a major airline company. It begins with an introduction to business analysis and its importance in assessing company performance. The analysis section examines EasyJet's financial position using various financial ratios, including profitability, turnover, liquidity, and solvency ratios. The report calculates and interprets these ratios based on EasyJet's 2019 financial data, highlighting areas of strength and weakness. The study then critically reviews the key performance indicators (KPIs) used by EasyJet to measure its operational success, such as revenue growth, income sources, profitability over time, and working capital. The analysis evaluates the trends and implications of these KPIs. The report concludes with an overall assessment of EasyJet's financial health and provides recommendations for improvement. The report emphasizes the importance of financial analysis in understanding a company's performance and making informed business decisions.

Business Analysis
Paraphrase This Document
Need a fresh take? Get an instant paraphrase of this document with our AI Paraphraser

Table of Contents
INTRODUCTION......................................................................................................................2
Analysis of financial position.................................................................................................2
Critically review the key performance indicator in its operations.........................................5
CONCLUSION..........................................................................................................................7
REFERENCES...........................................................................................................................9
INTRODUCTION
Business analysis is an approach that is used to introduce or manage the change
within a firm in order to increase the performance of a company in better manner. In the same
way, current study will also shed a light upon the business performance by using financial
data. The study is based upon the case study of EasyJet which is deal in airline industry and
operate within many countries. Hence, the study will examine the financial position of a
company by using the annual reports through different ratios. Further the study will critically
review the internal performance by using the key performance indicator of a company which
clearly determine whether the company is able to perform better in future or not.
Analysis of financial position
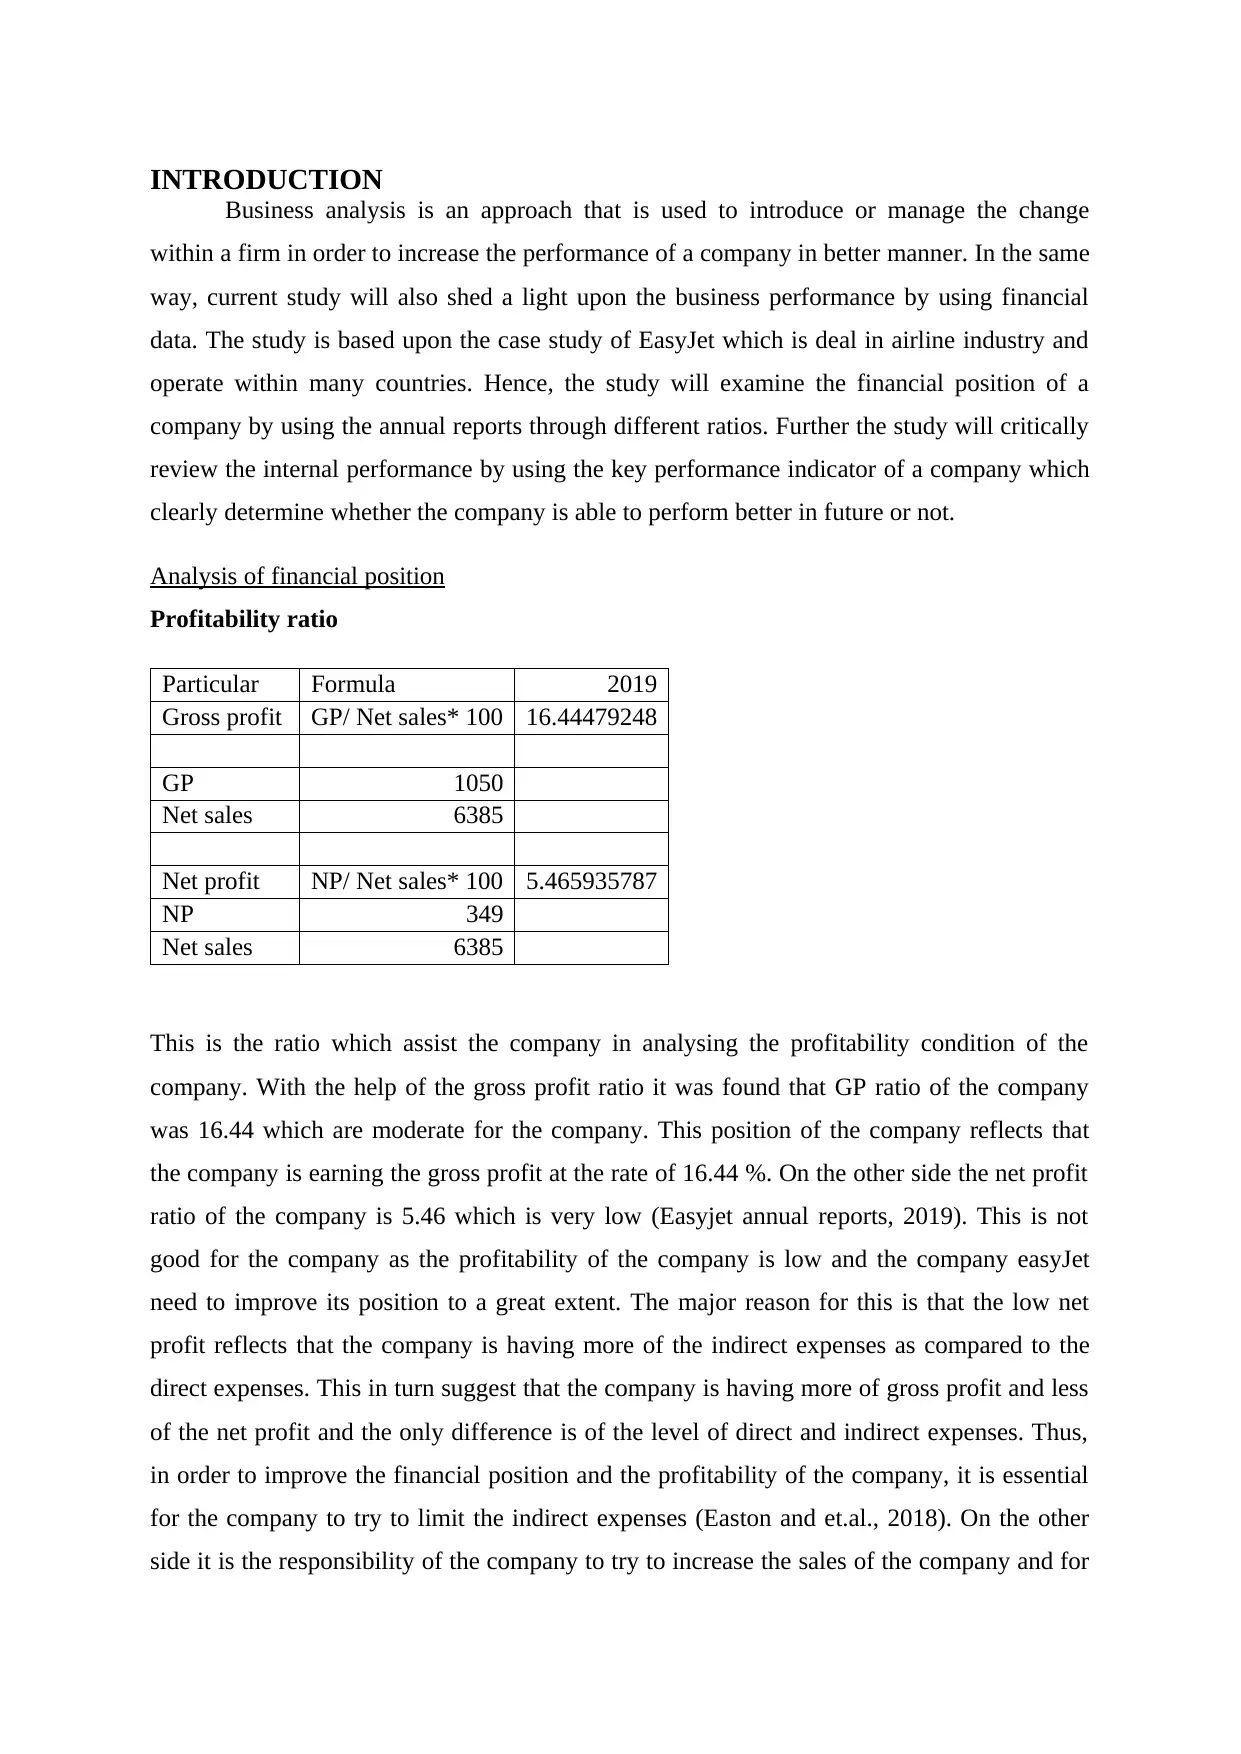
Profitability ratio
Particular Formula 2019
Gross profit GP/ Net sales* 100 16.44479248
GP 1050
Net sales 6385
Net profit NP/ Net sales* 100 5.465935787
NP 349
Net sales 6385
This is the ratio which assist the company in analysing the profitability condition of the
company. With the help of the gross profit ratio it was found that GP ratio of the company
was 16.44 which are moderate for the company. This position of the company reflects that
the company is earning the gross profit at the rate of 16.44 %. On the other side the net profit
ratio of the company is 5.46 which is very low (Easyjet annual reports, 2019). This is not
good for the company as the profitability of the company is low and the company easyJet
need to improve its position to a great extent. The major reason for this is that the low net
profit reflects that the company is having more of the indirect expenses as compared to the
direct expenses. This in turn suggest that the company is having more of gross profit and less
of the net profit and the only difference is of the level of direct and indirect expenses. Thus,
in order to improve the financial position and the profitability of the company, it is essential
for the company to try to limit the indirect expenses (Easton and et.al., 2018). On the other
side it is the responsibility of the company to try to increase the sales of the company and for
Business analysis is an approach that is used to introduce or manage the change
within a firm in order to increase the performance of a company in better manner. In the same
way, current study will also shed a light upon the business performance by using financial
data. The study is based upon the case study of EasyJet which is deal in airline industry and
operate within many countries. Hence, the study will examine the financial position of a
company by using the annual reports through different ratios. Further the study will critically
review the internal performance by using the key performance indicator of a company which
clearly determine whether the company is able to perform better in future or not.
Analysis of financial position
Profitability ratio
Particular Formula 2019
Gross profit GP/ Net sales* 100 16.44479248
GP 1050
Net sales 6385
Net profit NP/ Net sales* 100 5.465935787
NP 349
Net sales 6385
This is the ratio which assist the company in analysing the profitability condition of the
company. With the help of the gross profit ratio it was found that GP ratio of the company
was 16.44 which are moderate for the company. This position of the company reflects that
the company is earning the gross profit at the rate of 16.44 %. On the other side the net profit
ratio of the company is 5.46 which is very low (Easyjet annual reports, 2019). This is not
good for the company as the profitability of the company is low and the company easyJet
need to improve its position to a great extent. The major reason for this is that the low net
profit reflects that the company is having more of the indirect expenses as compared to the
direct expenses. This in turn suggest that the company is having more of gross profit and less
of the net profit and the only difference is of the level of direct and indirect expenses. Thus,
in order to improve the financial position and the profitability of the company, it is essential
for the company to try to limit the indirect expenses (Easton and et.al., 2018). On the other
side it is the responsibility of the company to try to increase the sales of the company and for
⊘ This is a preview!⊘
Do you want full access?
Subscribe today to unlock all pages.
Trusted by 1+ million students worldwide
this company can work on effective marketing of the company and try to convince people in
getting attracted towards the company and its operations.
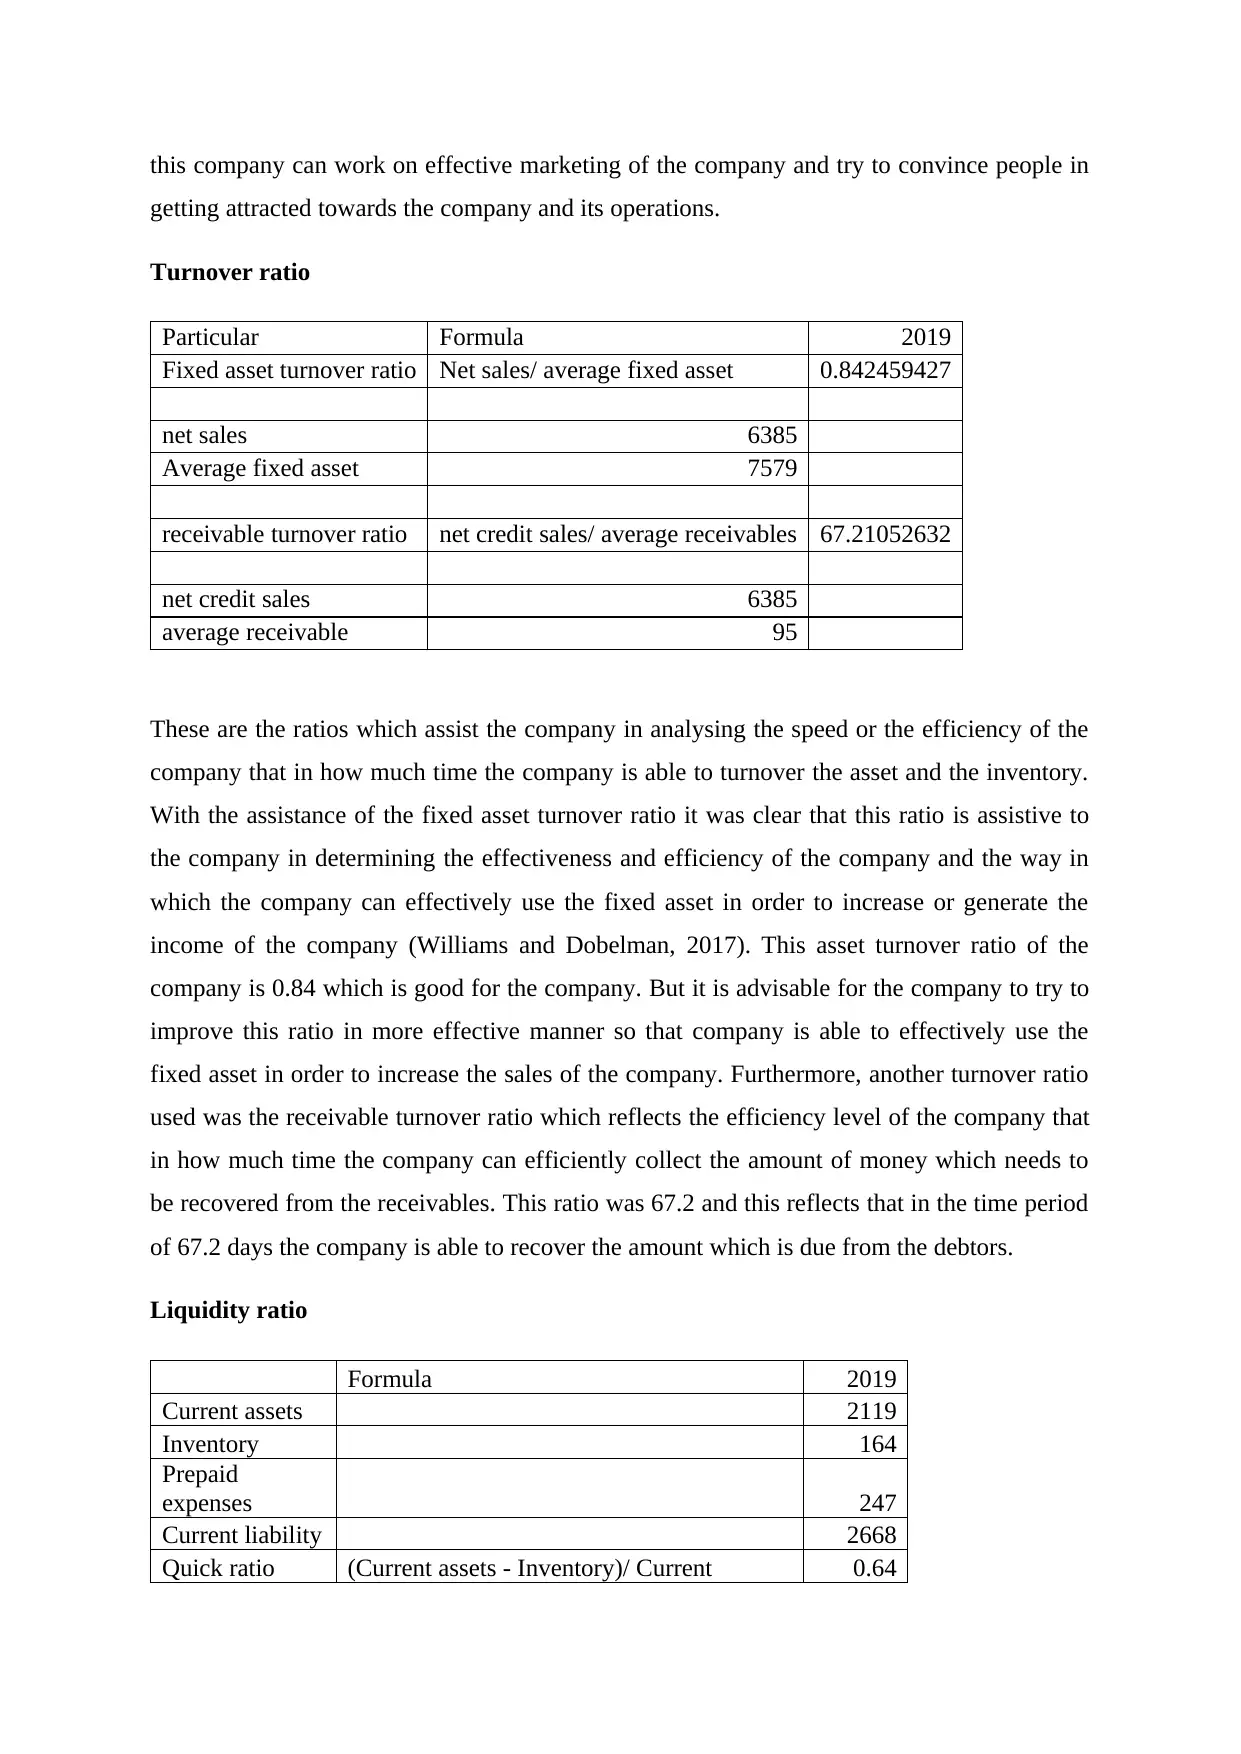
Turnover ratio
Particular Formula 2019
Fixed asset turnover ratio Net sales/ average fixed asset 0.842459427
net sales 6385
Average fixed asset 7579
receivable turnover ratio net credit sales/ average receivables 67.21052632
net credit sales 6385
average receivable 95
These are the ratios which assist the company in analysing the speed or the efficiency of the
company that in how much time the company is able to turnover the asset and the inventory.
With the assistance of the fixed asset turnover ratio it was clear that this ratio is assistive to
the company in determining the effectiveness and efficiency of the company and the way in
which the company can effectively use the fixed asset in order to increase or generate the
income of the company (Williams and Dobelman, 2017). This asset turnover ratio of the
company is 0.84 which is good for the company. But it is advisable for the company to try to
improve this ratio in more effective manner so that company is able to effectively use the
fixed asset in order to increase the sales of the company. Furthermore, another turnover ratio
used was the receivable turnover ratio which reflects the efficiency level of the company that
in how much time the company can efficiently collect the amount of money which needs to
be recovered from the receivables. This ratio was 67.2 and this reflects that in the time period
of 67.2 days the company is able to recover the amount which is due from the debtors.
Liquidity ratio
Formula 2019
Current assets 2119
Inventory 164
Prepaid
expenses 247
Current liability 2668
Quick ratio (Current assets - Inventory)/ Current 0.64
getting attracted towards the company and its operations.
Turnover ratio
Particular Formula 2019
Fixed asset turnover ratio Net sales/ average fixed asset 0.842459427
net sales 6385
Average fixed asset 7579
receivable turnover ratio net credit sales/ average receivables 67.21052632
net credit sales 6385
average receivable 95
These are the ratios which assist the company in analysing the speed or the efficiency of the
company that in how much time the company is able to turnover the asset and the inventory.
With the assistance of the fixed asset turnover ratio it was clear that this ratio is assistive to
the company in determining the effectiveness and efficiency of the company and the way in
which the company can effectively use the fixed asset in order to increase or generate the
income of the company (Williams and Dobelman, 2017). This asset turnover ratio of the
company is 0.84 which is good for the company. But it is advisable for the company to try to
improve this ratio in more effective manner so that company is able to effectively use the
fixed asset in order to increase the sales of the company. Furthermore, another turnover ratio
used was the receivable turnover ratio which reflects the efficiency level of the company that
in how much time the company can efficiently collect the amount of money which needs to
be recovered from the receivables. This ratio was 67.2 and this reflects that in the time period
of 67.2 days the company is able to recover the amount which is due from the debtors.
Liquidity ratio
Formula 2019
Current assets 2119
Inventory 164
Prepaid
expenses 247
Current liability 2668
Quick ratio (Current assets - Inventory)/ Current 0.64
Paraphrase This Document
Need a fresh take? Get an instant paraphrase of this document with our AI Paraphraser
liabilities
Current ratio Current asset/ current liabilities 0.79
Quick Ratio: The table represent that Easy Jet has a low financial performance
because it value (0.64) is lower than 1 and that is why, company has lower liquid assets
which can be cover in long term obligations and debts. Therefore, it is examine that the firm
does not have enough liquid asset in order to cover the short term liabilities which clearly
indicate the low performance of a company from many years (Griffin and Mahajan, 2019).
Current ratio: Easyjet has low performance because its current ratio does not match
with standard criteria and that is why, liquidity position of the company is not good. As the
current ratio of a firm is 0.79 which means the firm has to undertake additional funds for
paying its short term liabilities as well as other business requirements. This in turn improve
the business performance by focusing to increase the current assets.
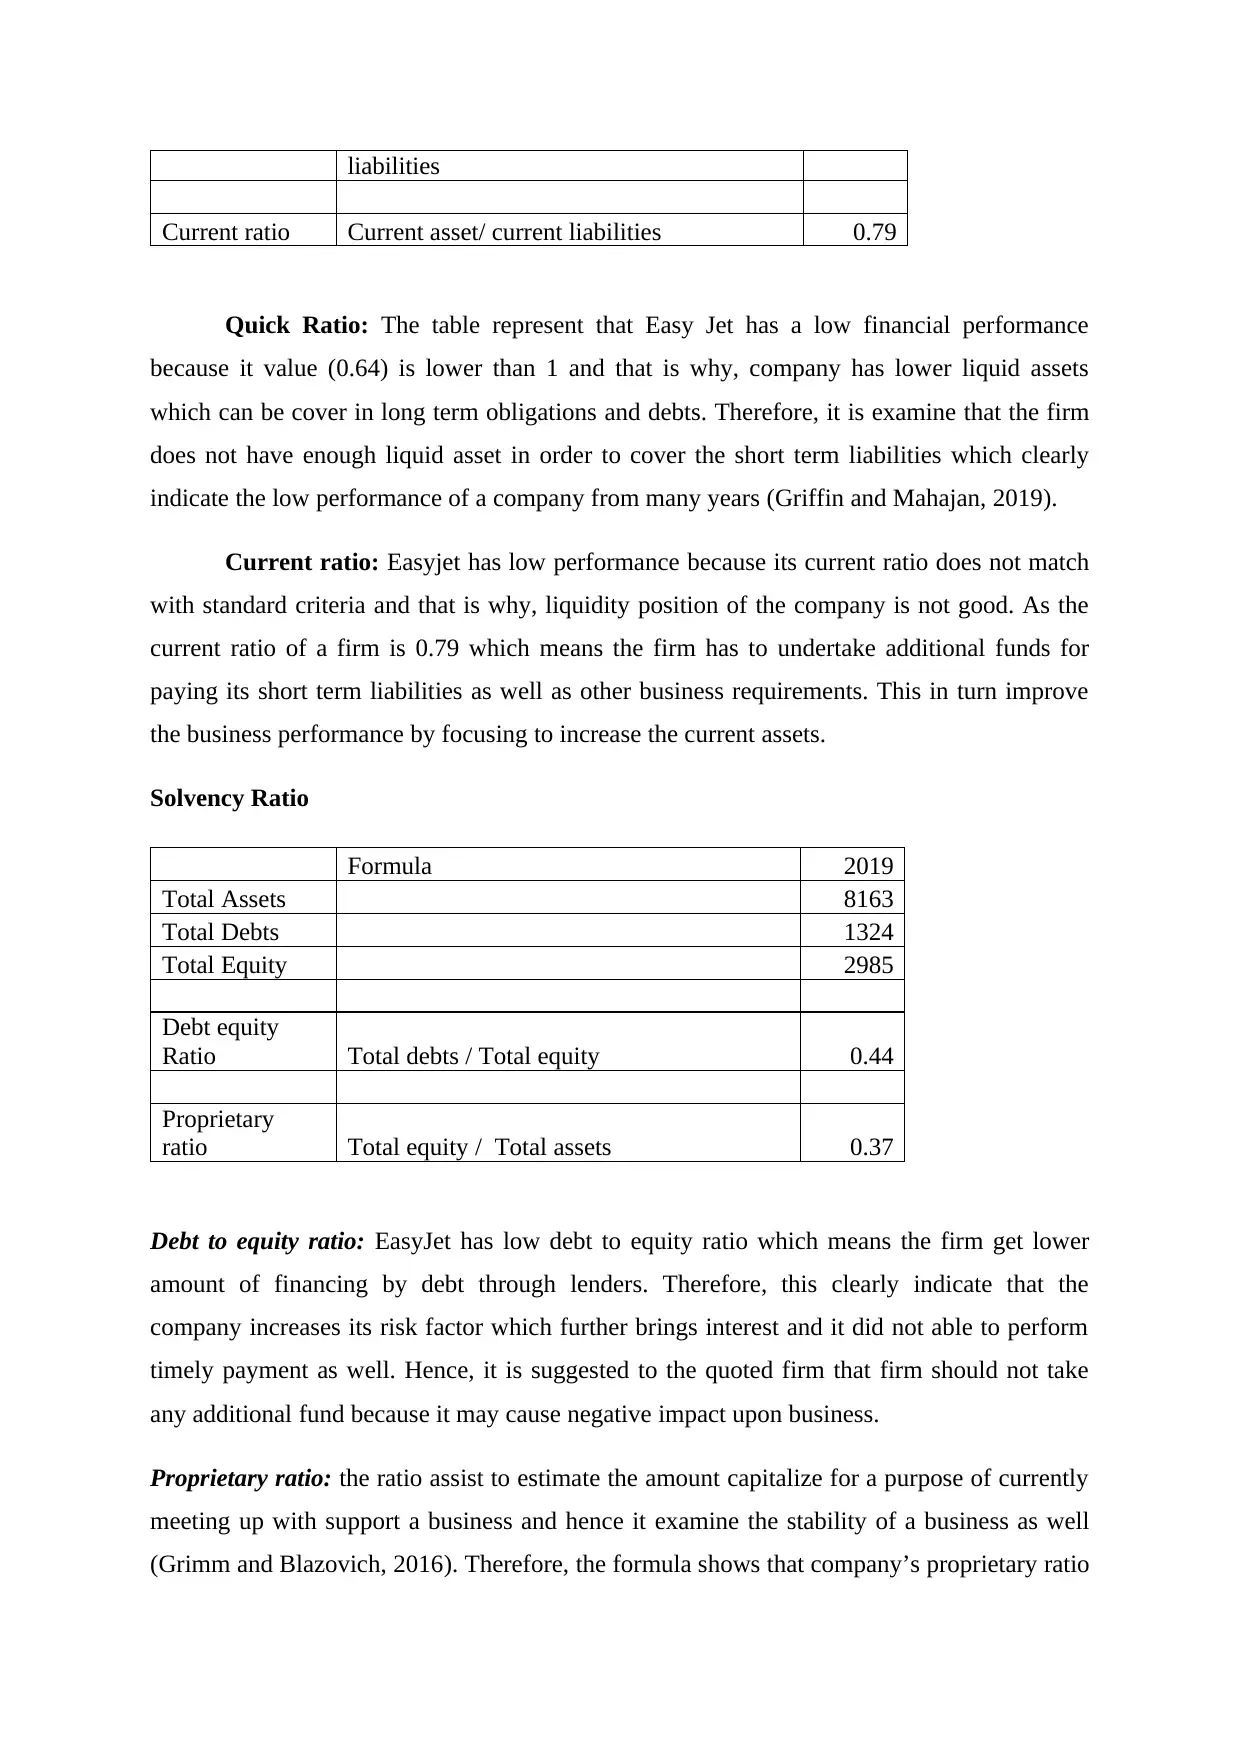
Solvency Ratio
Formula 2019
Total Assets 8163
Total Debts 1324
Total Equity 2985
Debt equity
Ratio Total debts / Total equity 0.44
Proprietary
ratio Total equity / Total assets 0.37
Debt to equity ratio: EasyJet has low debt to equity ratio which means the firm get lower
amount of financing by debt through lenders. Therefore, this clearly indicate that the
company increases its risk factor which further brings interest and it did not able to perform
timely payment as well. Hence, it is suggested to the quoted firm that firm should not take
any additional fund because it may cause negative impact upon business.
Proprietary ratio: the ratio assist to estimate the amount capitalize for a purpose of currently
meeting up with support a business and hence it examine the stability of a business as well
(Grimm and Blazovich, 2016). Therefore, the formula shows that company’s proprietary ratio
Current ratio Current asset/ current liabilities 0.79
Quick Ratio: The table represent that Easy Jet has a low financial performance
because it value (0.64) is lower than 1 and that is why, company has lower liquid assets
which can be cover in long term obligations and debts. Therefore, it is examine that the firm
does not have enough liquid asset in order to cover the short term liabilities which clearly
indicate the low performance of a company from many years (Griffin and Mahajan, 2019).
Current ratio: Easyjet has low performance because its current ratio does not match
with standard criteria and that is why, liquidity position of the company is not good. As the
current ratio of a firm is 0.79 which means the firm has to undertake additional funds for
paying its short term liabilities as well as other business requirements. This in turn improve
the business performance by focusing to increase the current assets.
Solvency Ratio
Formula 2019
Total Assets 8163
Total Debts 1324
Total Equity 2985
Debt equity
Ratio Total debts / Total equity 0.44
Proprietary
ratio Total equity / Total assets 0.37
Debt to equity ratio: EasyJet has low debt to equity ratio which means the firm get lower
amount of financing by debt through lenders. Therefore, this clearly indicate that the
company increases its risk factor which further brings interest and it did not able to perform
timely payment as well. Hence, it is suggested to the quoted firm that firm should not take
any additional fund because it may cause negative impact upon business.
Proprietary ratio: the ratio assist to estimate the amount capitalize for a purpose of currently
meeting up with support a business and hence it examine the stability of a business as well
(Grimm and Blazovich, 2016). Therefore, the formula shows that company’s proprietary ratio
is 0.37 which is quite low and that is why it indicate that company have already heavily debts
for its operations.
Critically review the key performance indicator in its operations
The key performance indicators are defined as the indicators which are helpful for the
company to measure the performance of the company. Under this method there are many
different types of indicators which the company need to compare in order to analyse the
current position of the company. Key performance indicator are assist to determine whether
the company has a strong financial performance or not. For easyJet also there are different
types of indicators against which the company compares the performance of the current year
against the other key performance indicator. The major KPI used by easyJet are as follows-
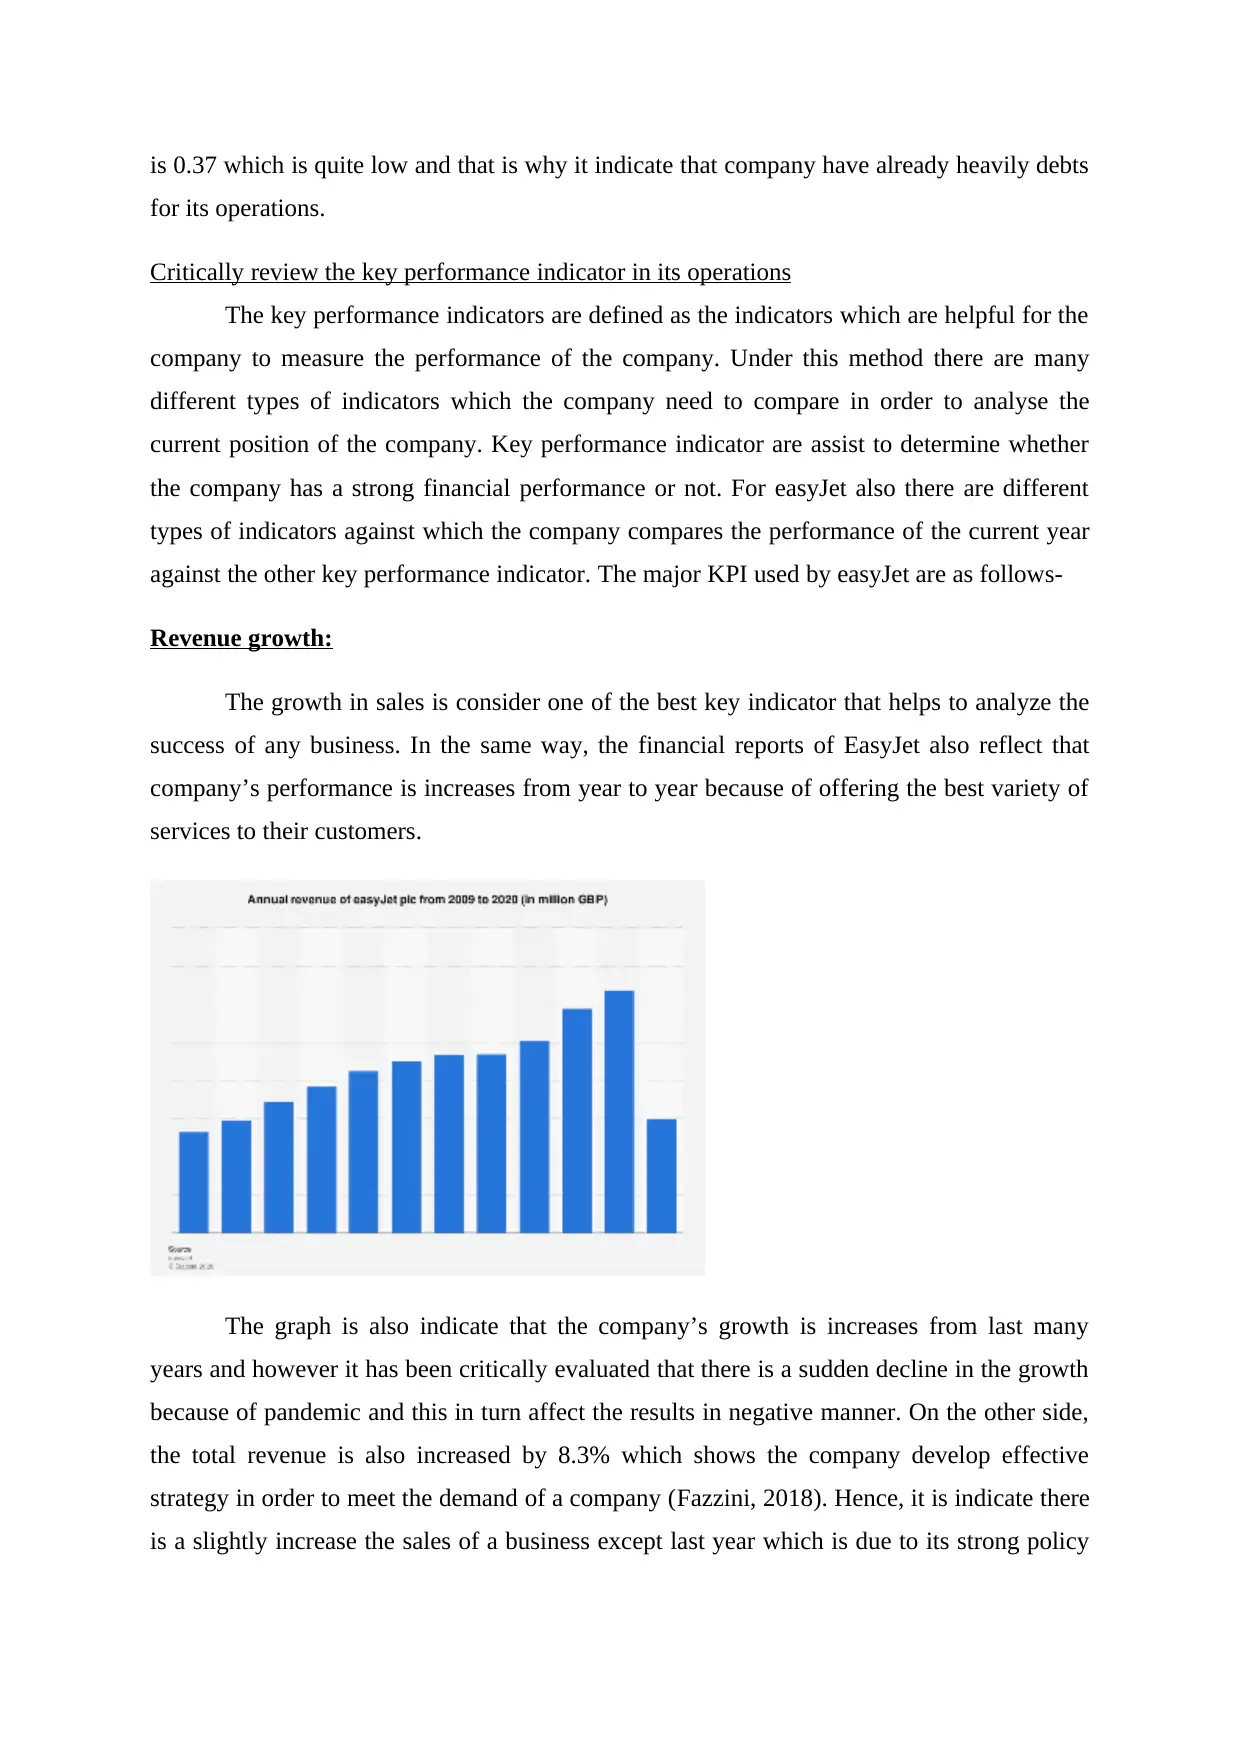
Revenue growth:
The growth in sales is consider one of the best key indicator that helps to analyze the
success of any business. In the same way, the financial reports of EasyJet also reflect that
company’s performance is increases from year to year because of offering the best variety of
services to their customers.
The graph is also indicate that the company’s growth is increases from last many
years and however it has been critically evaluated that there is a sudden decline in the growth
because of pandemic and this in turn affect the results in negative manner. On the other side,
the total revenue is also increased by 8.3% which shows the company develop effective
strategy in order to meet the demand of a company (Fazzini, 2018). Hence, it is indicate there
is a slightly increase the sales of a business except last year which is due to its strong policy
for its operations.
Critically review the key performance indicator in its operations
The key performance indicators are defined as the indicators which are helpful for the
company to measure the performance of the company. Under this method there are many
different types of indicators which the company need to compare in order to analyse the
current position of the company. Key performance indicator are assist to determine whether
the company has a strong financial performance or not. For easyJet also there are different
types of indicators against which the company compares the performance of the current year
against the other key performance indicator. The major KPI used by easyJet are as follows-
Revenue growth:
The growth in sales is consider one of the best key indicator that helps to analyze the
success of any business. In the same way, the financial reports of EasyJet also reflect that
company’s performance is increases from year to year because of offering the best variety of
services to their customers.
The graph is also indicate that the company’s growth is increases from last many
years and however it has been critically evaluated that there is a sudden decline in the growth
because of pandemic and this in turn affect the results in negative manner. On the other side,
the total revenue is also increased by 8.3% which shows the company develop effective
strategy in order to meet the demand of a company (Fazzini, 2018). Hence, it is indicate there
is a slightly increase the sales of a business except last year which is due to its strong policy
⊘ This is a preview!⊘
Do you want full access?
Subscribe today to unlock all pages.
Trusted by 1+ million students worldwide
and benchmark. Such that company set a target which needs to be attain by the firm in order
to increase the revenue growth.
Income source:
This is another indicator that helps to determine the internal performance of EasyJet.
Such that it is all about revenue per client and service that assist to examine profitable
customers and segments. Such the manager and stakeholder of the company develop effective
strategy that helps to increase the performance, like it keep comply with the positive trading
environment which is based upon the strength of its network as well as customer proposition,
capacity reductions and lower growth. But company keep comply with the different strategy
and having a low pricing strategy is also assist to attract the range of customers towards it.
In addition to this, it is also analyzed that company’s income is only generate through
tickets purchase by the customers which in turn increase the income. On the other side, by
changing need of customers, company is also comply the trend such that booking through
online which assist to meet the overall performance of a business (Hoskins, 2017). However
on the critically note, it is examine that company has only a single income source and that is
why, it affect the situation of a company in opposite manner. Hence, there is a need to
develop the strategy that assist to meet the define aim.
Profitability over time
This is the major type of indicator with help of which the company is in position to
access the profitability of the company. Under this method the company tries to compare the
current performance or the profits of the company with a range of some older year say five
years or six years (Robinson, 2020). This is done in order to access the trend of the
profitability of the company which is being present since the time frame of last four to six
years. This KPI will assist the company in managing and stabilising the fact that how much
the company has grown as compared to the last some years and this will assist company in
analysing the trends that how the company is working and growing the business over period
of time.
Working capital
Paraphrase This Document
Need a fresh take? Get an instant paraphrase of this document with our AI Paraphraser
The working capital is defined as the difference between the current asset and the
current liabilities of the company. This is also an important type of indicator which will assist
the company in managing the performance of the company. Under this is the working capital
is good that is current asset are more as compared to the current liabilities then it is said that
the company is performing in better and effective manner. This also means that if the
working capital of the company is good then the liquidity of the company is good and
company is in better position to convert its stock in cash in effective manner. In the current
year that is 2019 the working capital of the company was (2119- 2668= - 549). Thus, this
means that the company is not having good working capital and the current liabilities of the
company are much higher. Thus, with help of this indicator it is clear that the company need
to improve its current asset and for this the company must clear its entire inventory and
convert it in cash (Monahan, 2018). This is particularly because of the reason that when the
company will generate cash then this will be helpful for the company in paying off its current
liabilities. In addition to this when the current liabilities of the company will decrease then
the working capital of the company will increase and improve and this will increase the
overall working of the company easyJet.
CONCLUSION
By summing up above report it has been concluded that the financial performance of
the company is not so strong because all the ratios are below than the standard criteria and
that is why, there is a need to develop strategy that assist to meet the define aim. As the study
clearly indicate the company’s financial performance is not so strong because of having long
term debts and it is not so sound to sustain the brand image in future. Moreover, it is also
critically evaluated that company uses effective key performance indicator that assist to track
the performance of a company in better manner. As a result, this KPI help the business to
sustain brand image of a firm and keep grow the business as well.
REFERENCES
Books and Journals
Easton, P.D., McAnally, M.L., Sommers, G.A. and Zhang, X.J., 2018. Financial statement
analysis & valuation. Boston, MA: Cambridge Business Publishers.
Fazzini, M., 2018. Financial Statement Analysis. In Business Valuation (pp. 39-76). Palgrave
Macmillan, Cham.
Griffin, P.A. and Mahajan, S., 2019. Financial Statement Analysis. Finding Alphas: A
Quantitative Approach to Building Trading Strategies, pp.141-148.
Grimm, S.D. and Blazovich, J.L., 2016. Developing student competencies: An integrated
approach to a financial statement analysis project. Journal of Accounting Education, 35,
pp.69-101.
Hoskins, K., 2017. Post-18 Educational Choices:‘Our Students Need to Avoid the easyJet
Version of Universities’. In Youth Identities, Education and Employment (pp. 79-107).
Palgrave Macmillan, London.
Monahan, S.J., 2018. Financial Statement Analysis and Earnings Forecasting. Foundations
and Trends® in Accounting, 12(2), pp.105-215.
Robinson, T.R., 2020. International financial statement analysis. John Wiley & Sons.
Williams, E.E. and Dobelman, J.A., 2017. Financial statement analysis. World Scientific
Book Chapters, pp.109-169.
Online
Easyjet annual reports. 2019. [Online]. Available through:
<https://corporate.easyjet.com/~/media/Files/E/Easyjet/pdf/investors/results-centre/
2019/eas040-annual-report-2019-web.pdf>
⊘ This is a preview!⊘
Do you want full access?
Subscribe today to unlock all pages.
Trusted by 1+ million students worldwide
1 out of 9
Related Documents


Your All-in-One AI-Powered Toolkit for Academic Success.
+13062052269
info@desklib.com
Available 24*7 on WhatsApp / Email
![[object Object]](/_next/static/media/star-bottom.7253800d.svg)
Unlock your academic potential
Copyright © 2020–2026 A2Z Services. All Rights Reserved. Developed and managed by ZUCOL.