Financial Accounting Report: EasyJet and Ryanair Analysis Report
VerifiedAdded on 2020/06/05
|11
|2524
|81
Report
AI Summary
This report provides a comprehensive financial analysis of two low-cost airlines, EasyJet and Ryanair, listed on the London Stock Exchange. The analysis includes a discussion of reserves using a classification method, an internal memorandum for the Board of Directors, and a detailed examination of financial ratios, including profitability, liquidity, and gearing ratios, from 2015 to 2017. The report comments on the limitations of financial ratio analysis and compares the non-financial aspects of the two business units, such as market share and CSR initiatives. The analysis reveals insights into the companies' financial performance, offering comparisons and conclusions regarding investment potential. The report uses data from annual reports to support its findings, providing a valuable resource for understanding the financial health and strategic positioning of these airlines.

Financial Accounting and Reporting
1
1
Paraphrase This Document
Need a fresh take? Get an instant paraphrase of this document with our AI Paraphraser
TABLE OF CONTENTS
INTRODUCTION......................................................................................................................1
a. Discussing reserves by using a simple classification method............................................1
b. Preparing an internal memorandum for the Board of Directors........................................2
c. Commenting on the limitations of financial ratio analysis.................................................7
d. Comparing non-financial aspects of the selected business units.......................................8
CONCLUSION..........................................................................................................................9
REFERENCES.........................................................................................................................10
2
INTRODUCTION
Financial accounting is highly concerned with the summarization, analysis and
reporting of monetary transactions associated with the business. Now, it becomes vital for the
companies to prepare and publish financial reports at the end of accounting year. This in turn
renders suitable information to the stakeholders and helps in making appropriate decisions.
This project report is based on low cost airline companies listed on LSE namely Easy Jet and
Ryanair. Both the companies lay focus on offering air services to the customers at lower
prices. In this, the present report will shed light on the extent to which financial position and
performance of such business units are good via ratio analysis. Further, it also depicts the
aspects that limit the significance of ratio analysis technique in the context of financial
evaluation.
a. Discussing reserves by using a simple classification method
To
Board of Directors
Date: 18th March 2018
Subject: Financial performance evaluation
Trend of Easy Jet Plc’s and Ryanair’s reserves during the period of 3 years from 2015 to 2017 is as
follows:
Particulars Easy Jet Ryanair
2015 2016 2017 2015 2016 2017
Retained earnings (in £ million) 1,720 1,920 1,996 2,706.2 3,166.1 3,456.8
Other reserves (in £ million) (238) 25 39 600.3 (298.7) 236.8
Easy Jet Ryanair
2015 2016 2017 2015 2016 2017
Dividend per share .44 .58 .53 1.95 1.55
Interpretation: The above depicted table shows that retained earnings and others a reserve of
Easy Jet Plc has inclined over the years. In 2015, retained earnings of Easy Jet Plc accounted for
£1720 GBP, whereas at the end of 2017 it reached on £ 1996 million. Further, other reserves had also
inclined and implied for £ 39million in 2017. Along with this, position of Ryanair’s reserves had also
1
⊘ This is a preview!⊘
Do you want full access?
Subscribe today to unlock all pages.
Trusted by 1+ million students worldwide
increased to the significant level. By doing assessment, it has found that growth which takes place in
the company’s reserves has negative influence on dividend payment. Moreover, when company
adopts strategy in relation to maintaining more funds with itself from profit after tax them it becomes
unable to offer high returns to the shareholders in the form of dividend. Likewise, due to inclination in
the reserves, dividend offered by Ryanair to the investors at decreasing rate. In addition to this, Easy
Jet Plc had also offered fewer dividends to the shareholders in 2017 because high reserves were
maintained by the company during this time. Evidently, it can be said that negative relationship exists
between company’s reserve policies and dividend payment.
b. Preparing an internal memorandum for the Board of Directors
Profitability ratios
Particulars Formula Easy Jet Ryanair
Profitability
ratios 2015 2016 2017 2015 2016 2017
operating profit 688 498 404
1,042.9
0
1,460.1
0
1,534.0
Net profit 548 427 305 866.7
1,559.1
0
1,315.9
Sales revenue 4,686 4,669 5,047
5,654.0
0
6,535.8
0
6,647.8
OP ratio
OP / Net sales *
100 14.7% 10.7% 8.0% 18.4% 22.3% 23.1%
NP ratio
NP / Net sales *
100 11.7% 9.1% 6.0% 15.3% 23.9% 19.8%
2015 2016 2017 2015 2016 2017
Easy Jet Ryanair
0.00%
5.00%
10.00%
15.00%
20.00%
25.00%
Profitability Ratios
OP ratio
NP ratio
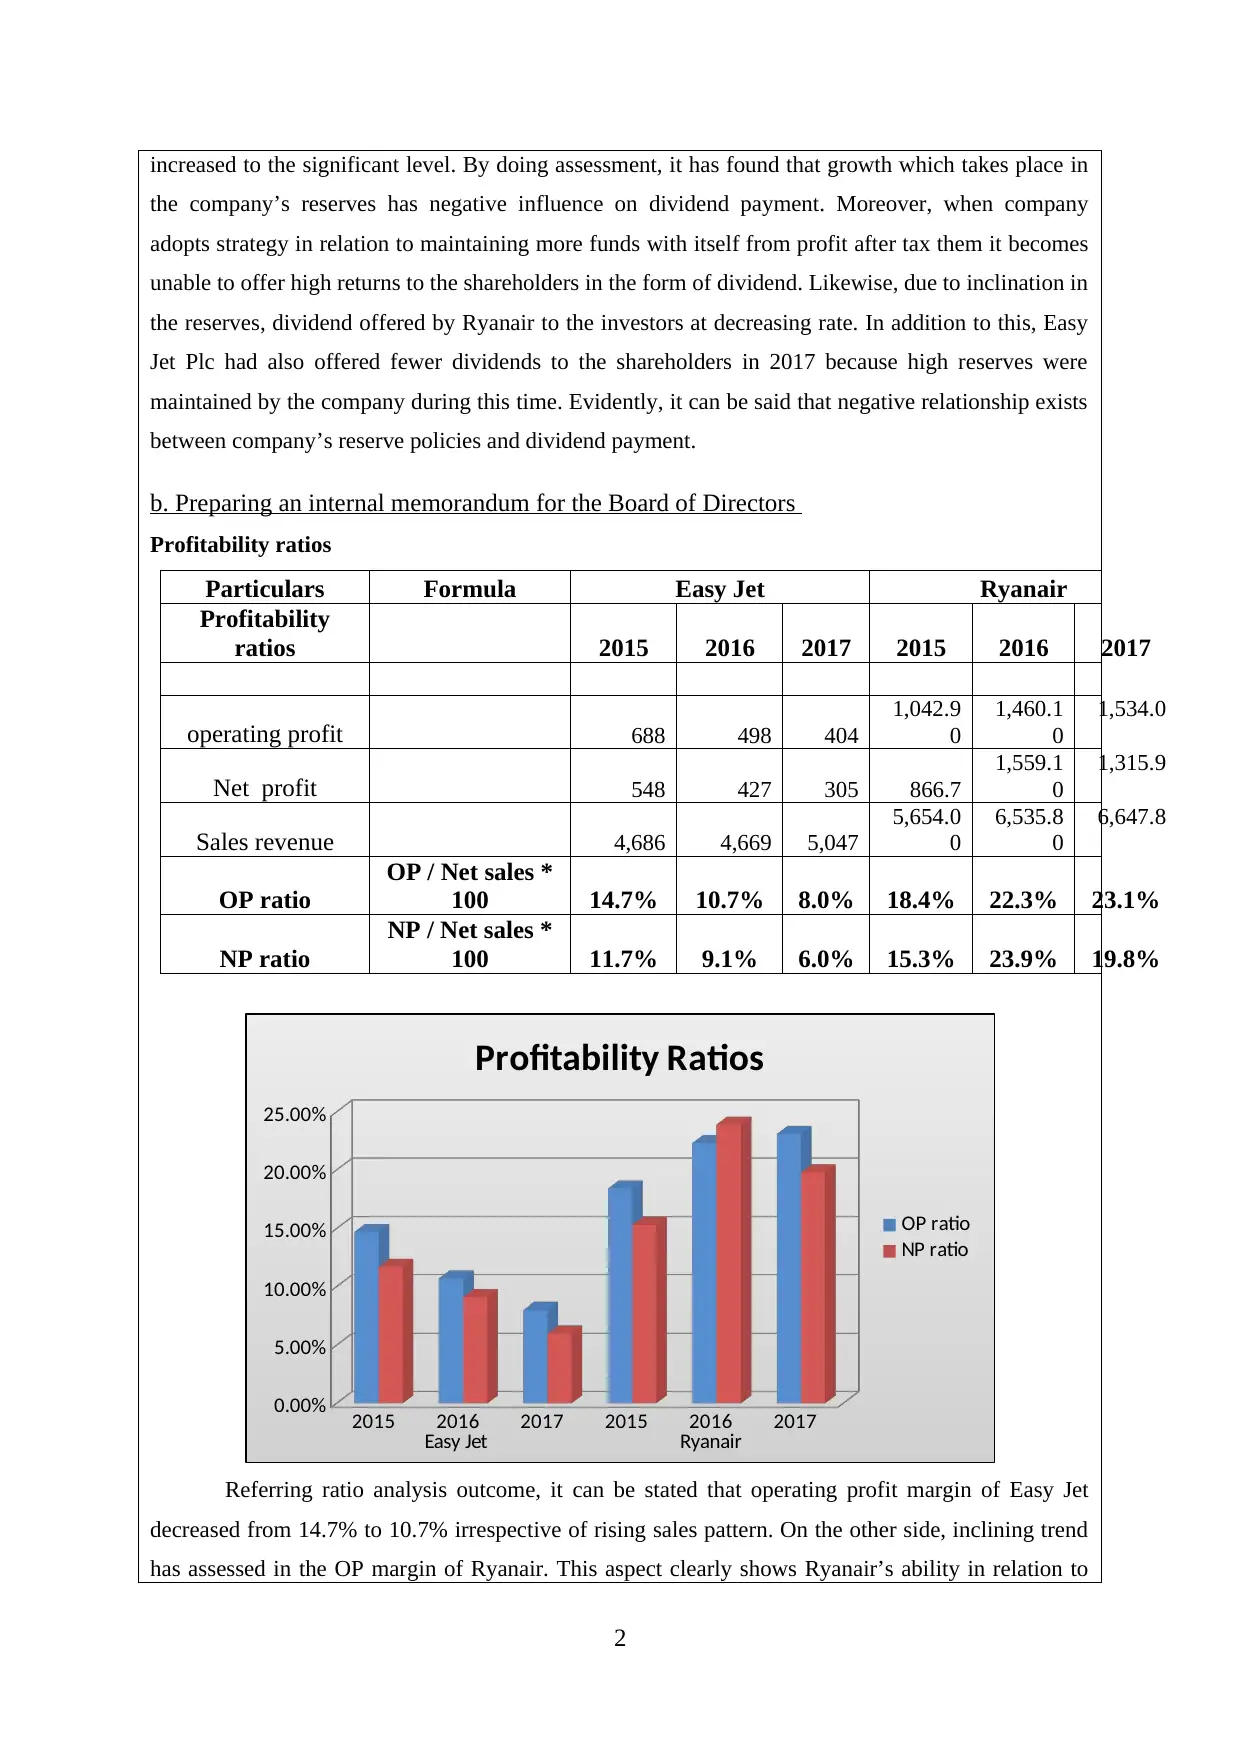
Referring ratio analysis outcome, it can be stated that operating profit margin of Easy Jet
decreased from 14.7% to 10.7% irrespective of rising sales pattern. On the other side, inclining trend
has assessed in the OP margin of Ryanair. This aspect clearly shows Ryanair’s ability in relation to
2
the company’s reserves has negative influence on dividend payment. Moreover, when company
adopts strategy in relation to maintaining more funds with itself from profit after tax them it becomes
unable to offer high returns to the shareholders in the form of dividend. Likewise, due to inclination in
the reserves, dividend offered by Ryanair to the investors at decreasing rate. In addition to this, Easy
Jet Plc had also offered fewer dividends to the shareholders in 2017 because high reserves were
maintained by the company during this time. Evidently, it can be said that negative relationship exists
between company’s reserve policies and dividend payment.
b. Preparing an internal memorandum for the Board of Directors
Profitability ratios
Particulars Formula Easy Jet Ryanair
Profitability
ratios 2015 2016 2017 2015 2016 2017
operating profit 688 498 404
1,042.9
0
1,460.1
0
1,534.0
Net profit 548 427 305 866.7
1,559.1
0
1,315.9
Sales revenue 4,686 4,669 5,047
5,654.0
0
6,535.8
0
6,647.8
OP ratio
OP / Net sales *
100 14.7% 10.7% 8.0% 18.4% 22.3% 23.1%
NP ratio
NP / Net sales *
100 11.7% 9.1% 6.0% 15.3% 23.9% 19.8%
2015 2016 2017 2015 2016 2017
Easy Jet Ryanair
0.00%
5.00%
10.00%
15.00%
20.00%
25.00%
Profitability Ratios
OP ratio
NP ratio
Referring ratio analysis outcome, it can be stated that operating profit margin of Easy Jet
decreased from 14.7% to 10.7% irrespective of rising sales pattern. On the other side, inclining trend
has assessed in the OP margin of Ryanair. This aspect clearly shows Ryanair’s ability in relation to
2
Paraphrase This Document
Need a fresh take? Get an instant paraphrase of this document with our AI Paraphraser
exerting control on indirect expenses. Further, through evaluation it has identified that due to low
revenue and high indirect expenditures, in comparison to Ryanair, NP margin of Easy Jet declined and
accounted for 6% at the end of 2017 (Annual report of Easy Jet Plc 2017, n.d.). During the period of 3
years, NP margin of Ryanair was highly good in the period of 2016 such as 23.9% significantly. In
contrast to this, net profitability of Ryanair decreased in FY 2017 due to decline in the level of income
generated from other sources. Thus, it is reported to the management team that profitability position
of Ryanair is good as compared to Easy Jet.
Liquidity ratio
Particulars Formula Easy Jet Ryanair
201
5
201
6
201
7 2015 2016 2017
Current
assets
1,27
9
1,45
4
173
4
5,742.
00
4,821.
50
4,706.
10
Current
liabilities
176
8
157
3
167
0
3,346.
00
3,369.
50
3,011.
80
Stock 2.1 3.30 3.10
Prepaid
expenses 86 97 118 145 221
Quick assets
119
3
135
7
161
6 5740 4673 4482
Current
ratio
Current assets / current
liabilities 0.72 0.92
1.0
4 1.72 1.43 1.56
Quick ratio (CA - inventory) / CL 0.67 0.86 .97 1.72 1.39 1.49
2015 2016 2017 2015 2016 2017
Easy Jet Ryanair
0.72
0.92 1.04
1.72
1.43 1.56
0.67
0.86 0.97
1.72
1.39 1.49
Liquidity ratio
Current ratio Quick ratio
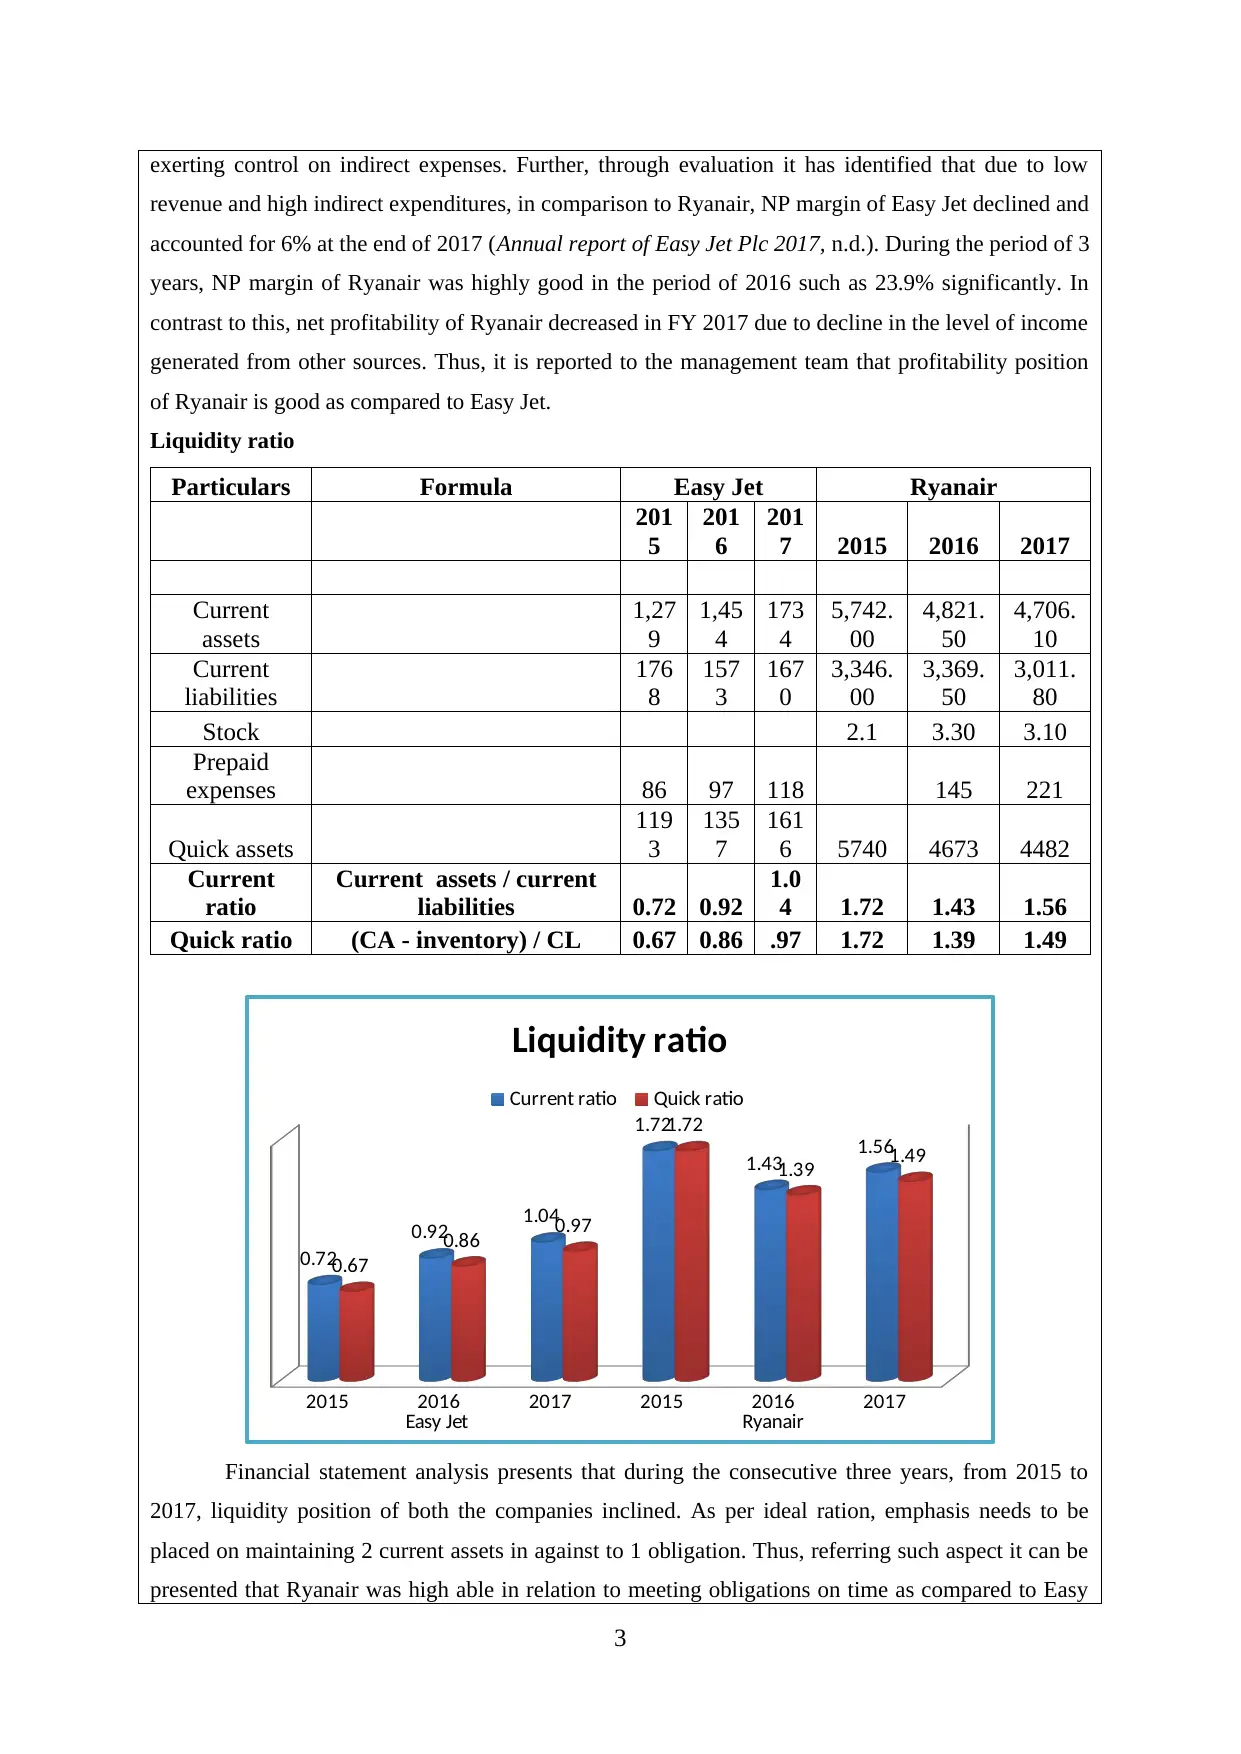
Financial statement analysis presents that during the consecutive three years, from 2015 to
2017, liquidity position of both the companies inclined. As per ideal ration, emphasis needs to be
placed on maintaining 2 current assets in against to 1 obligation. Thus, referring such aspect it can be
presented that Ryanair was high able in relation to meeting obligations on time as compared to Easy
3
revenue and high indirect expenditures, in comparison to Ryanair, NP margin of Easy Jet declined and
accounted for 6% at the end of 2017 (Annual report of Easy Jet Plc 2017, n.d.). During the period of 3
years, NP margin of Ryanair was highly good in the period of 2016 such as 23.9% significantly. In
contrast to this, net profitability of Ryanair decreased in FY 2017 due to decline in the level of income
generated from other sources. Thus, it is reported to the management team that profitability position
of Ryanair is good as compared to Easy Jet.
Liquidity ratio
Particulars Formula Easy Jet Ryanair
201
5
201
6
201
7 2015 2016 2017
Current
assets
1,27
9
1,45
4
173
4
5,742.
00
4,821.
50
4,706.
10
Current
liabilities
176
8
157
3
167
0
3,346.
00
3,369.
50
3,011.
80
Stock 2.1 3.30 3.10
Prepaid
expenses 86 97 118 145 221
Quick assets
119
3
135
7
161
6 5740 4673 4482
Current
ratio
Current assets / current
liabilities 0.72 0.92
1.0
4 1.72 1.43 1.56
Quick ratio (CA - inventory) / CL 0.67 0.86 .97 1.72 1.39 1.49
2015 2016 2017 2015 2016 2017
Easy Jet Ryanair
0.72
0.92 1.04
1.72
1.43 1.56
0.67
0.86 0.97
1.72
1.39 1.49
Liquidity ratio
Current ratio Quick ratio
Financial statement analysis presents that during the consecutive three years, from 2015 to
2017, liquidity position of both the companies inclined. As per ideal ration, emphasis needs to be
placed on maintaining 2 current assets in against to 1 obligation. Thus, referring such aspect it can be
presented that Ryanair was high able in relation to meeting obligations on time as compared to Easy
3
Jet. Moreover, current ratio of Ryanair was highly near to the ideal ratio during the concerned time
period.
However, quick ratio of the Easy Jet Plc was good in the year of 2015 & 2016 and equal to
the idea ratio such as 1:1. Nevertheless, high level of quick assets was maintained by Ryanair in
comparison to the obligations. This in turn places negative impact on the firm’s growth and
profitability aspect. Moreover, company has opportunity to employ such excess fund in other
productive activities and thereby generates high profit. Overall, liquidity position of Ryanair is sound
over Easy Jet Plc.
Gearing ratio
Particulars Formula Easy Jet Ryanair
20
15
20
16
20
17 2015 2016 2017
Total assets
48
28
55
05
59
71
12,185
.40
11,218
.30
11,989
.70
Long term
debt
22
8
56
1
87
0
4,088.
00
3,573.
00
3,929.
00
Shareholders’
equity
22
49
27
12
28
02
4,035.
10
3,596.
80
4,423.
00
Debt-equity
ratio
Long term debt /
shareholders equity
0.1
0
0.2
1
0.3
1 1.01 0.99 0.89
Gearing ratio Equity / total assets
47
%
49
%
47
% 33% 32% 37%
2015 2016 2017
0
0.2
0.4
0.6
0.8
1
1.2
Debt-equity ratio
Easy Jet
Ryanair
4
⊘ This is a preview!⊘
Do you want full access?
Subscribe today to unlock all pages.
Trusted by 1+ million students worldwide
2015 2016 2017
0%
10%
20%
30%
40%
50%
60%
Gearing ratio
Easy Jet
Ryanair
in %
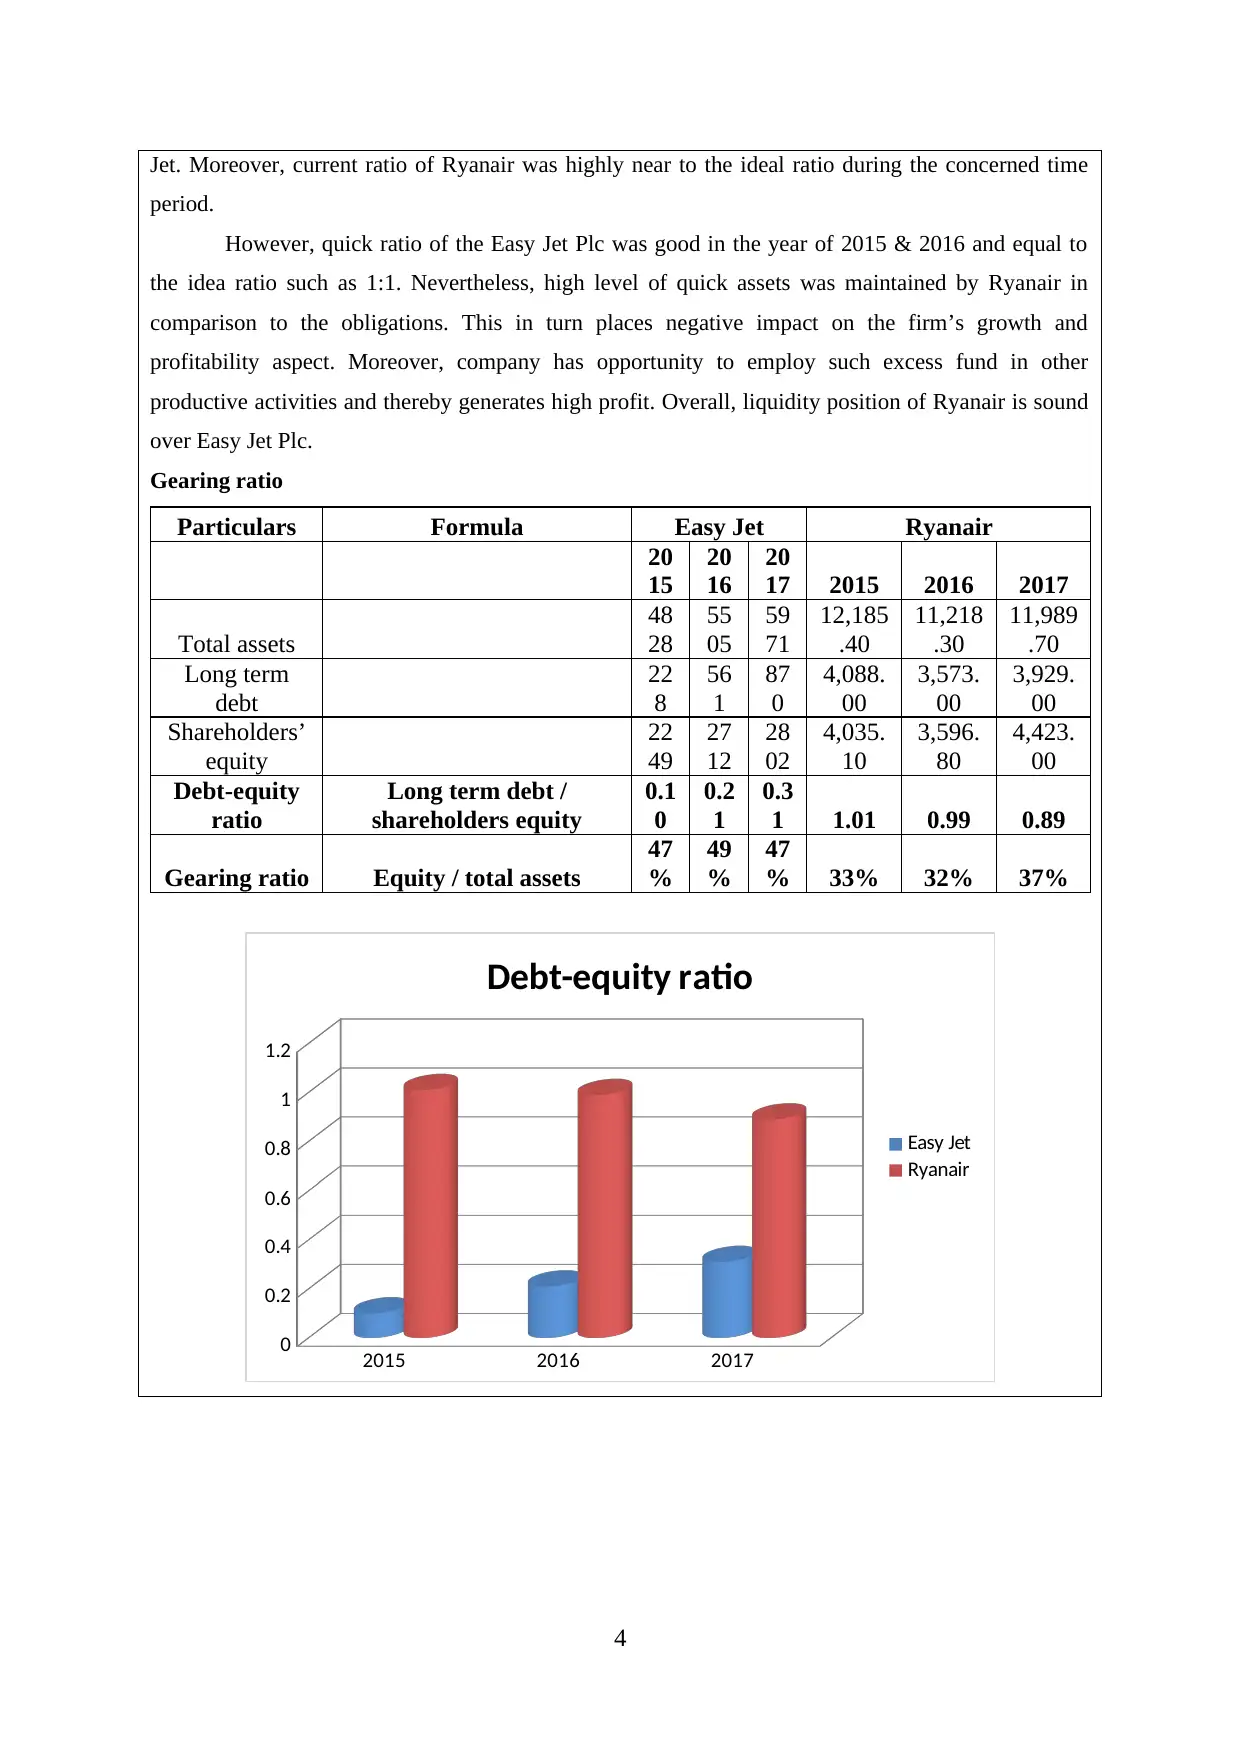
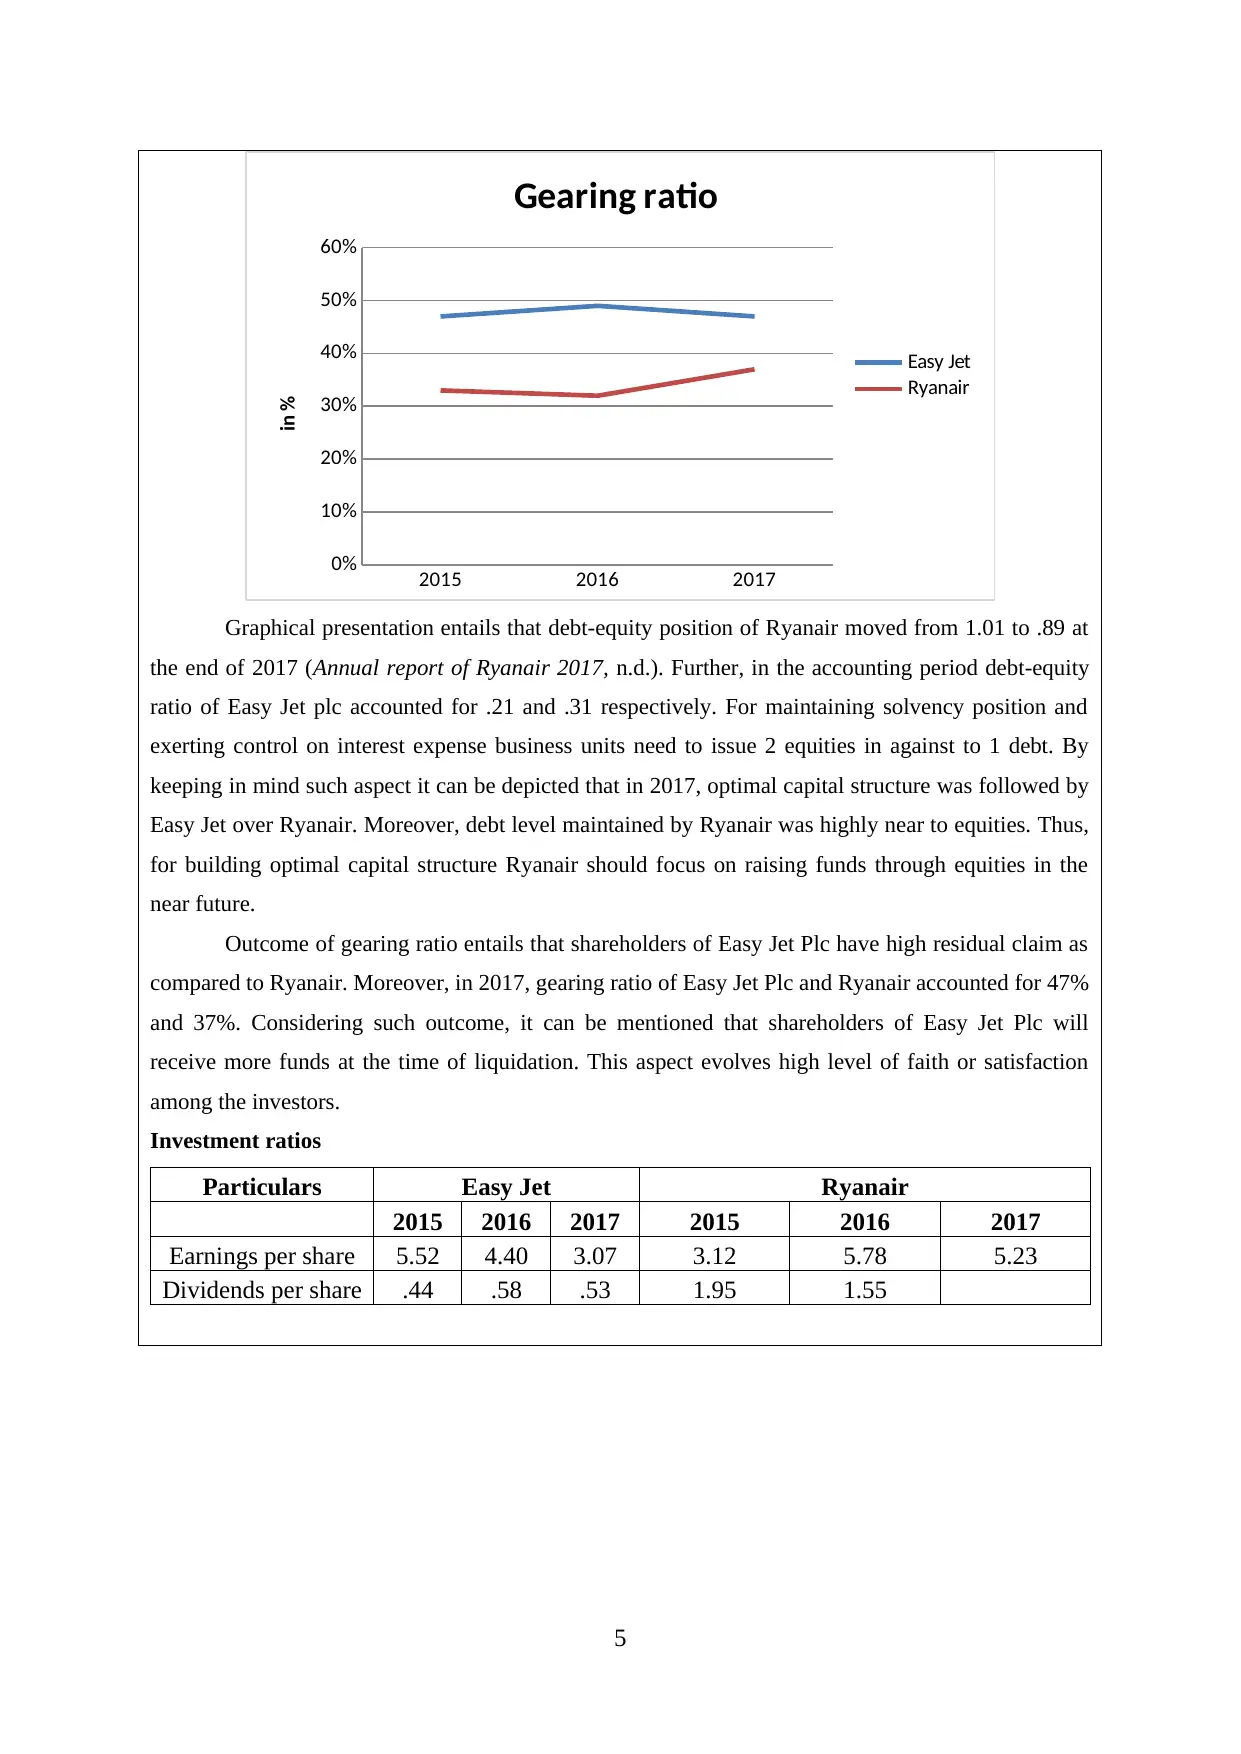
Graphical presentation entails that debt-equity position of Ryanair moved from 1.01 to .89 at
the end of 2017 (Annual report of Ryanair 2017, n.d.). Further, in the accounting period debt-equity
ratio of Easy Jet plc accounted for .21 and .31 respectively. For maintaining solvency position and
exerting control on interest expense business units need to issue 2 equities in against to 1 debt. By
keeping in mind such aspect it can be depicted that in 2017, optimal capital structure was followed by
Easy Jet over Ryanair. Moreover, debt level maintained by Ryanair was highly near to equities. Thus,
for building optimal capital structure Ryanair should focus on raising funds through equities in the
near future.
Outcome of gearing ratio entails that shareholders of Easy Jet Plc have high residual claim as
compared to Ryanair. Moreover, in 2017, gearing ratio of Easy Jet Plc and Ryanair accounted for 47%
and 37%. Considering such outcome, it can be mentioned that shareholders of Easy Jet Plc will
receive more funds at the time of liquidation. This aspect evolves high level of faith or satisfaction
among the investors.
Investment ratios
Particulars Easy Jet Ryanair
2015 2016 2017 2015 2016 2017
Earnings per share 5.52 4.40 3.07 3.12 5.78 5.23
Dividends per share .44 .58 .53 1.95 1.55
5
0%
10%
20%
30%
40%
50%
60%
Gearing ratio
Easy Jet
Ryanair
in %
Graphical presentation entails that debt-equity position of Ryanair moved from 1.01 to .89 at
the end of 2017 (Annual report of Ryanair 2017, n.d.). Further, in the accounting period debt-equity
ratio of Easy Jet plc accounted for .21 and .31 respectively. For maintaining solvency position and
exerting control on interest expense business units need to issue 2 equities in against to 1 debt. By
keeping in mind such aspect it can be depicted that in 2017, optimal capital structure was followed by
Easy Jet over Ryanair. Moreover, debt level maintained by Ryanair was highly near to equities. Thus,
for building optimal capital structure Ryanair should focus on raising funds through equities in the
near future.
Outcome of gearing ratio entails that shareholders of Easy Jet Plc have high residual claim as
compared to Ryanair. Moreover, in 2017, gearing ratio of Easy Jet Plc and Ryanair accounted for 47%
and 37%. Considering such outcome, it can be mentioned that shareholders of Easy Jet Plc will
receive more funds at the time of liquidation. This aspect evolves high level of faith or satisfaction
among the investors.
Investment ratios
Particulars Easy Jet Ryanair
2015 2016 2017 2015 2016 2017
Earnings per share 5.52 4.40 3.07 3.12 5.78 5.23
Dividends per share .44 .58 .53 1.95 1.55
5
Paraphrase This Document
Need a fresh take? Get an instant paraphrase of this document with our AI Paraphraser
2015 2016 2017
0
1
2
3
4
5
6 5.52
4.4
3.073.12
5.78
5.23
Earnings per share
Easy Jet
Ryanair
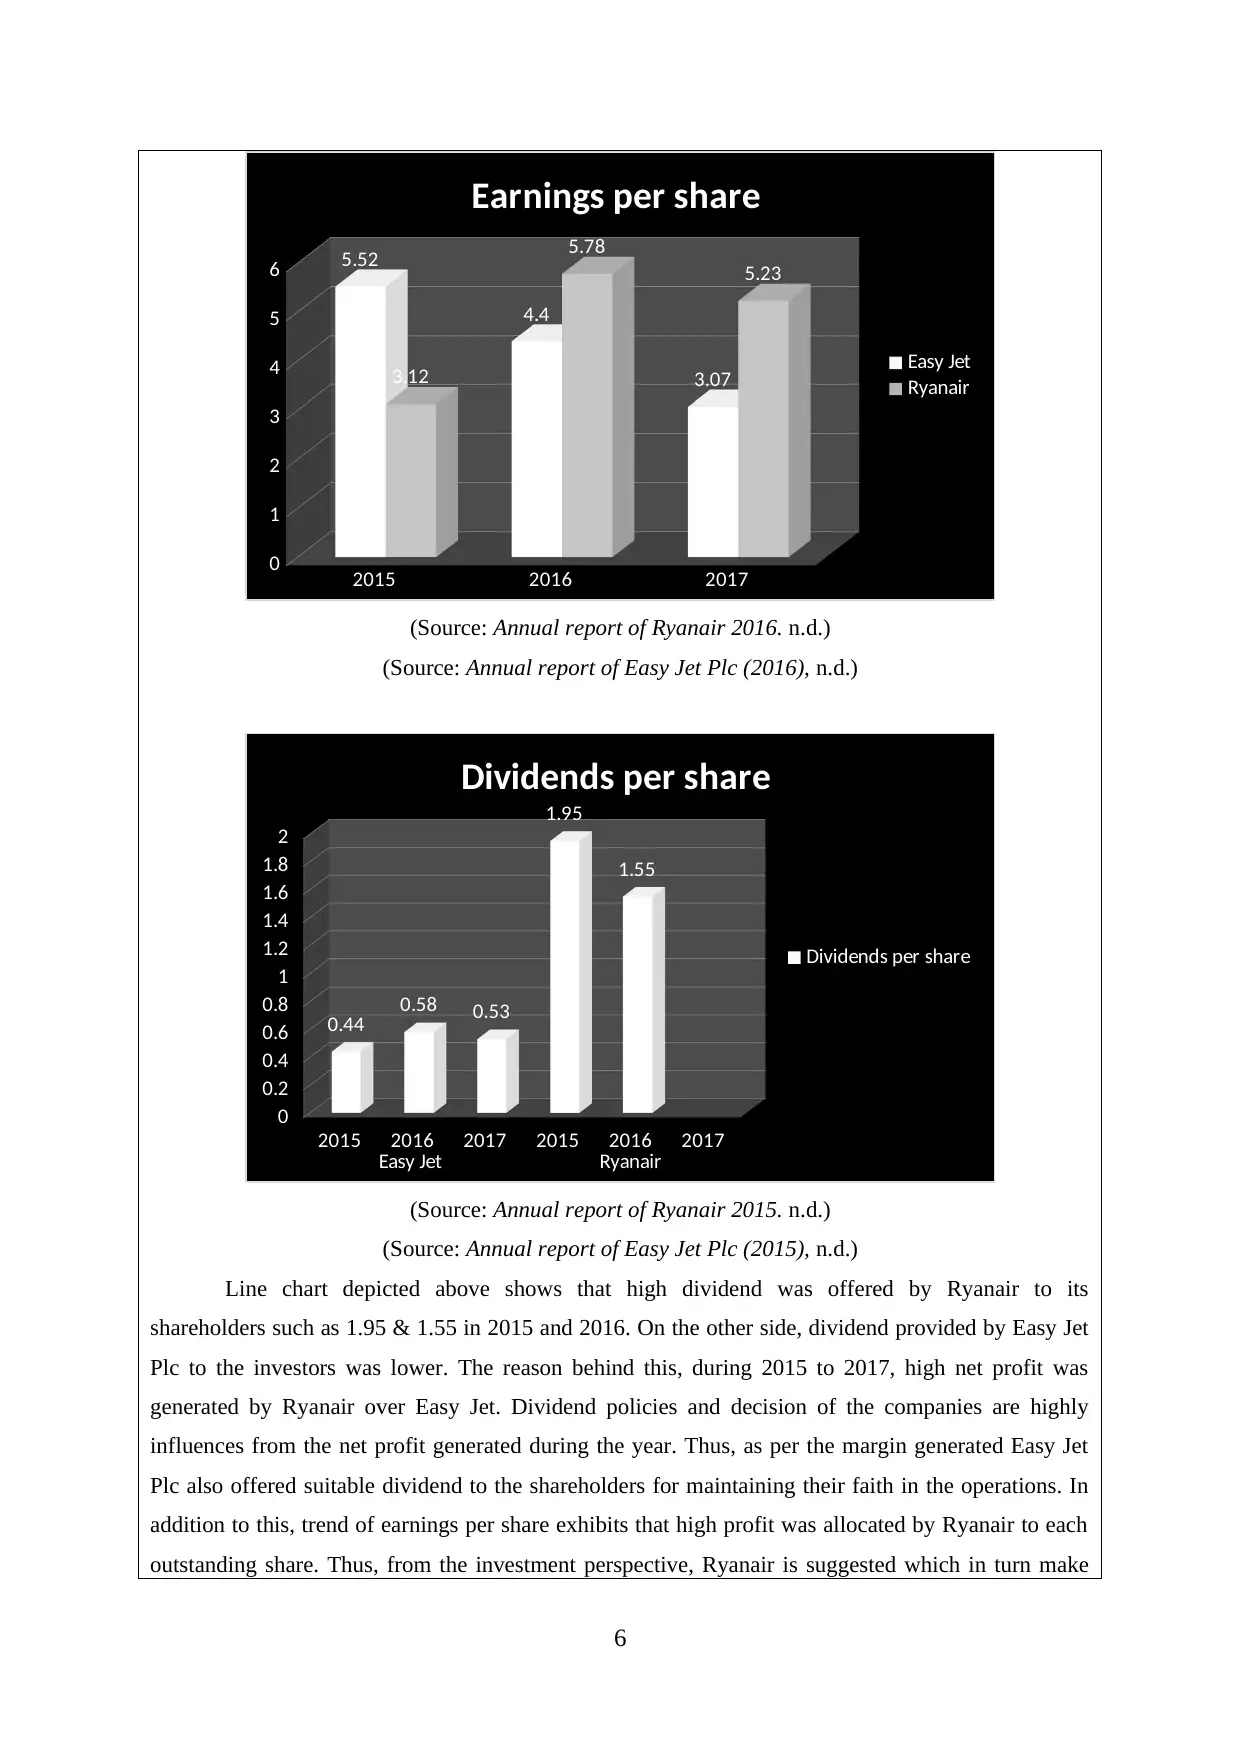
(Source: Annual report of Ryanair 2016. n.d.)
(Source: Annual report of Easy Jet Plc (2016), n.d.)
2015 2016 2017 2015 2016 2017
Easy Jet Ryanair
0
0.2
0.4
0.6
0.8
1
1.2
1.4
1.6
1.8
2
0.44 0.58 0.53
1.95
1.55
Dividends per share
Dividends per share
(Source: Annual report of Ryanair 2015. n.d.)
(Source: Annual report of Easy Jet Plc (2015), n.d.)
Line chart depicted above shows that high dividend was offered by Ryanair to its
shareholders such as 1.95 & 1.55 in 2015 and 2016. On the other side, dividend provided by Easy Jet
Plc to the investors was lower. The reason behind this, during 2015 to 2017, high net profit was
generated by Ryanair over Easy Jet. Dividend policies and decision of the companies are highly
influences from the net profit generated during the year. Thus, as per the margin generated Easy Jet
Plc also offered suitable dividend to the shareholders for maintaining their faith in the operations. In
addition to this, trend of earnings per share exhibits that high profit was allocated by Ryanair to each
outstanding share. Thus, from the investment perspective, Ryanair is suggested which in turn make
6
0
1
2
3
4
5
6 5.52
4.4
3.073.12
5.78
5.23
Earnings per share
Easy Jet
Ryanair
(Source: Annual report of Ryanair 2016. n.d.)
(Source: Annual report of Easy Jet Plc (2016), n.d.)
2015 2016 2017 2015 2016 2017
Easy Jet Ryanair
0
0.2
0.4
0.6
0.8
1
1.2
1.4
1.6
1.8
2
0.44 0.58 0.53
1.95
1.55
Dividends per share
Dividends per share
(Source: Annual report of Ryanair 2015. n.d.)
(Source: Annual report of Easy Jet Plc (2015), n.d.)
Line chart depicted above shows that high dividend was offered by Ryanair to its
shareholders such as 1.95 & 1.55 in 2015 and 2016. On the other side, dividend provided by Easy Jet
Plc to the investors was lower. The reason behind this, during 2015 to 2017, high net profit was
generated by Ryanair over Easy Jet. Dividend policies and decision of the companies are highly
influences from the net profit generated during the year. Thus, as per the margin generated Easy Jet
Plc also offered suitable dividend to the shareholders for maintaining their faith in the operations. In
addition to this, trend of earnings per share exhibits that high profit was allocated by Ryanair to each
outstanding share. Thus, from the investment perspective, Ryanair is suggested which in turn make
6
suitable value addition in the money.
Referring overall evaluation, it can be entailed that for the acquisition purpose Ryanair proves to be
more beneficial.
Sincerely
Financial analyst
c. Commenting on the limitations of financial ratio analysis
Ratio analysis is the prominent financial tool that helps in summarizing monetary
information in s structured way. It presents company’s performance in the context of different
areas such as profitability, liquidity, solvency and investment. By undertaking ratio analysis
tool business units like Easy Jet plc and Ryanair can do evaluation over the years. Further,
such technique also enables company to assess its position over the rival firms and gives
input for the development of competent policy framework. However, on the critical note, it
can be presented that ratio analysis tool has some weaknesses that financial analyst needs to
keep in mind while undertaking such technique monetary performance evaluation is:
Accounting policies: Different business units consider varied policies and procedure
for the preparation of financial statements. For instance: one company considers
accelerate, whereas other unit employs straight line method for charging depreciation
on assets. Under such condition, results of the ratios differ significantly. Hence,
comparison of two business units through ratio analysis is possible only when they
undertake similar rules (as per IASB) for treating the same transaction.
Historical versus current cost variations: Under income statement, transactions are
recorded at their current cost level. On the other side, in balance sheet, some of the
figures are stated or presented at historical cost. Hence, such disparity places adverse
effect on ratio’s results and thereby shareholders decision making (Limitations of
Ratio Analysis, 2018).
Further, ration analysis tool describes relationship that takes place between the past
results. In contrast to this, users of financial statements are highly concerned about
current and future information.
Along with this, ratio analysis tool only highly trends in a numeric format but it does
not provide information about the causation factors. In other words, it can be
mentioned that ratios do not provide information about the reasons due to which
7
⊘ This is a preview!⊘
Do you want full access?
Subscribe today to unlock all pages.
Trusted by 1+ million students worldwide
profitability and other aspects decreased over the time frame. Hence, referring both
internal and external factors analyst has to assess reasons which might be difficult.
d. Comparing non-financial aspects of the selected business units
Qualitative aspects present initiatives that have undertaken by the business unit for the
welfare of others, market share etc. CSR report of Easy Jet Plc presents that management
team gives high level of priority to the safety aspect. Hence, it emphasizes on offering
protection to the passengers and crews from disruptive behaviour (Easy Jet Plc, 2018).
Further, for ensuring high level of safety and security, new relationships with Austrian safety
regulators have built by Easy Jet. In addition to this, for gaining competitive edge over others
and building loyal customer base Easy Jet Plc lays focus on supporting passengers with
special assistance during both disruptive as well as non-disruptive situation.
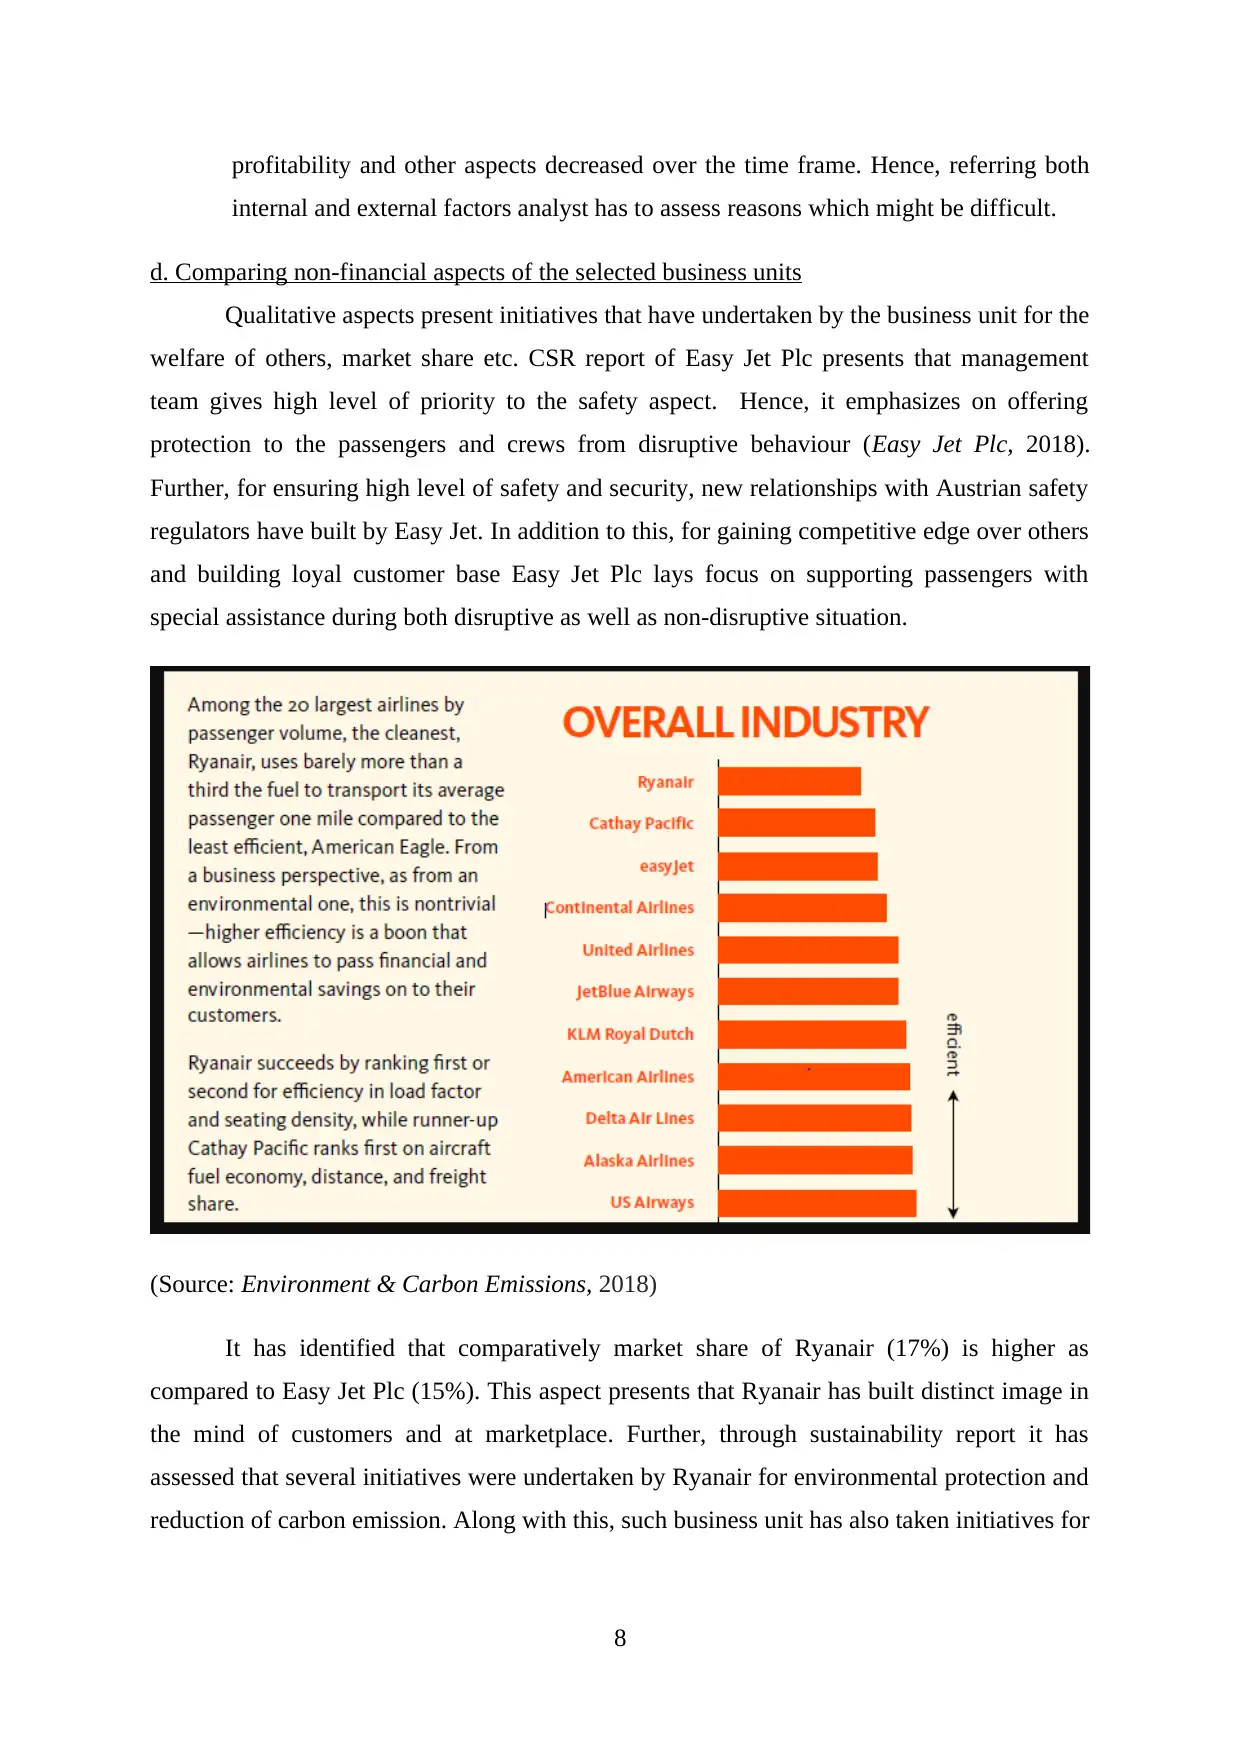
(Source: Environment & Carbon Emissions, 2018)
It has identified that comparatively market share of Ryanair (17%) is higher as
compared to Easy Jet Plc (15%). This aspect presents that Ryanair has built distinct image in
the mind of customers and at marketplace. Further, through sustainability report it has
assessed that several initiatives were undertaken by Ryanair for environmental protection and
reduction of carbon emission. Along with this, such business unit has also taken initiatives for
8
internal and external factors analyst has to assess reasons which might be difficult.
d. Comparing non-financial aspects of the selected business units
Qualitative aspects present initiatives that have undertaken by the business unit for the
welfare of others, market share etc. CSR report of Easy Jet Plc presents that management
team gives high level of priority to the safety aspect. Hence, it emphasizes on offering
protection to the passengers and crews from disruptive behaviour (Easy Jet Plc, 2018).
Further, for ensuring high level of safety and security, new relationships with Austrian safety
regulators have built by Easy Jet. In addition to this, for gaining competitive edge over others
and building loyal customer base Easy Jet Plc lays focus on supporting passengers with
special assistance during both disruptive as well as non-disruptive situation.
(Source: Environment & Carbon Emissions, 2018)
It has identified that comparatively market share of Ryanair (17%) is higher as
compared to Easy Jet Plc (15%). This aspect presents that Ryanair has built distinct image in
the mind of customers and at marketplace. Further, through sustainability report it has
assessed that several initiatives were undertaken by Ryanair for environmental protection and
reduction of carbon emission. Along with this, such business unit has also taken initiatives for
8
Paraphrase This Document
Need a fresh take? Get an instant paraphrase of this document with our AI Paraphraser
the maintenance of safety & quality as well as ethics and transparency. Hence, in terms of
qualitative aspects, Ryanair performance is considered as good over the rival firm.
CONCLUSION
From findings derived, it can be concluded that from the investment perspective
Ryanair is highly good as compared to Easy Jet Plc. Ratio analysis outcome clearly presents
that profitability and liquidity position of Ryanair was good during the period of 3 years
considered for investigation. Besides this, it can be inferred from the evaluation that Ryanair
is offering higher returns to the shareholder. Evidently, investors should give preference to
Ryanair for the purpose of investment over Easy Jet Plc. Further, qualitative measures present
that significant actions have undertaken by Ryanair for CSR and developing effectual image
at marketplace. Thus, concerned airline firm should make focus on the acquisition of Ryanair.
9
1 out of 11
Related Documents


Your All-in-One AI-Powered Toolkit for Academic Success.
+13062052269
info@desklib.com
Available 24*7 on WhatsApp / Email
![[object Object]](/_next/static/media/star-bottom.7253800d.svg)
Unlock your academic potential
Copyright © 2020–2026 A2Z Services. All Rights Reserved. Developed and managed by ZUCOL.