Quantitative Analysis: Eating Habits of ECU International Students

Verified

Added on  2023/06/04

|20
|4229
|174
Report
AI Summary
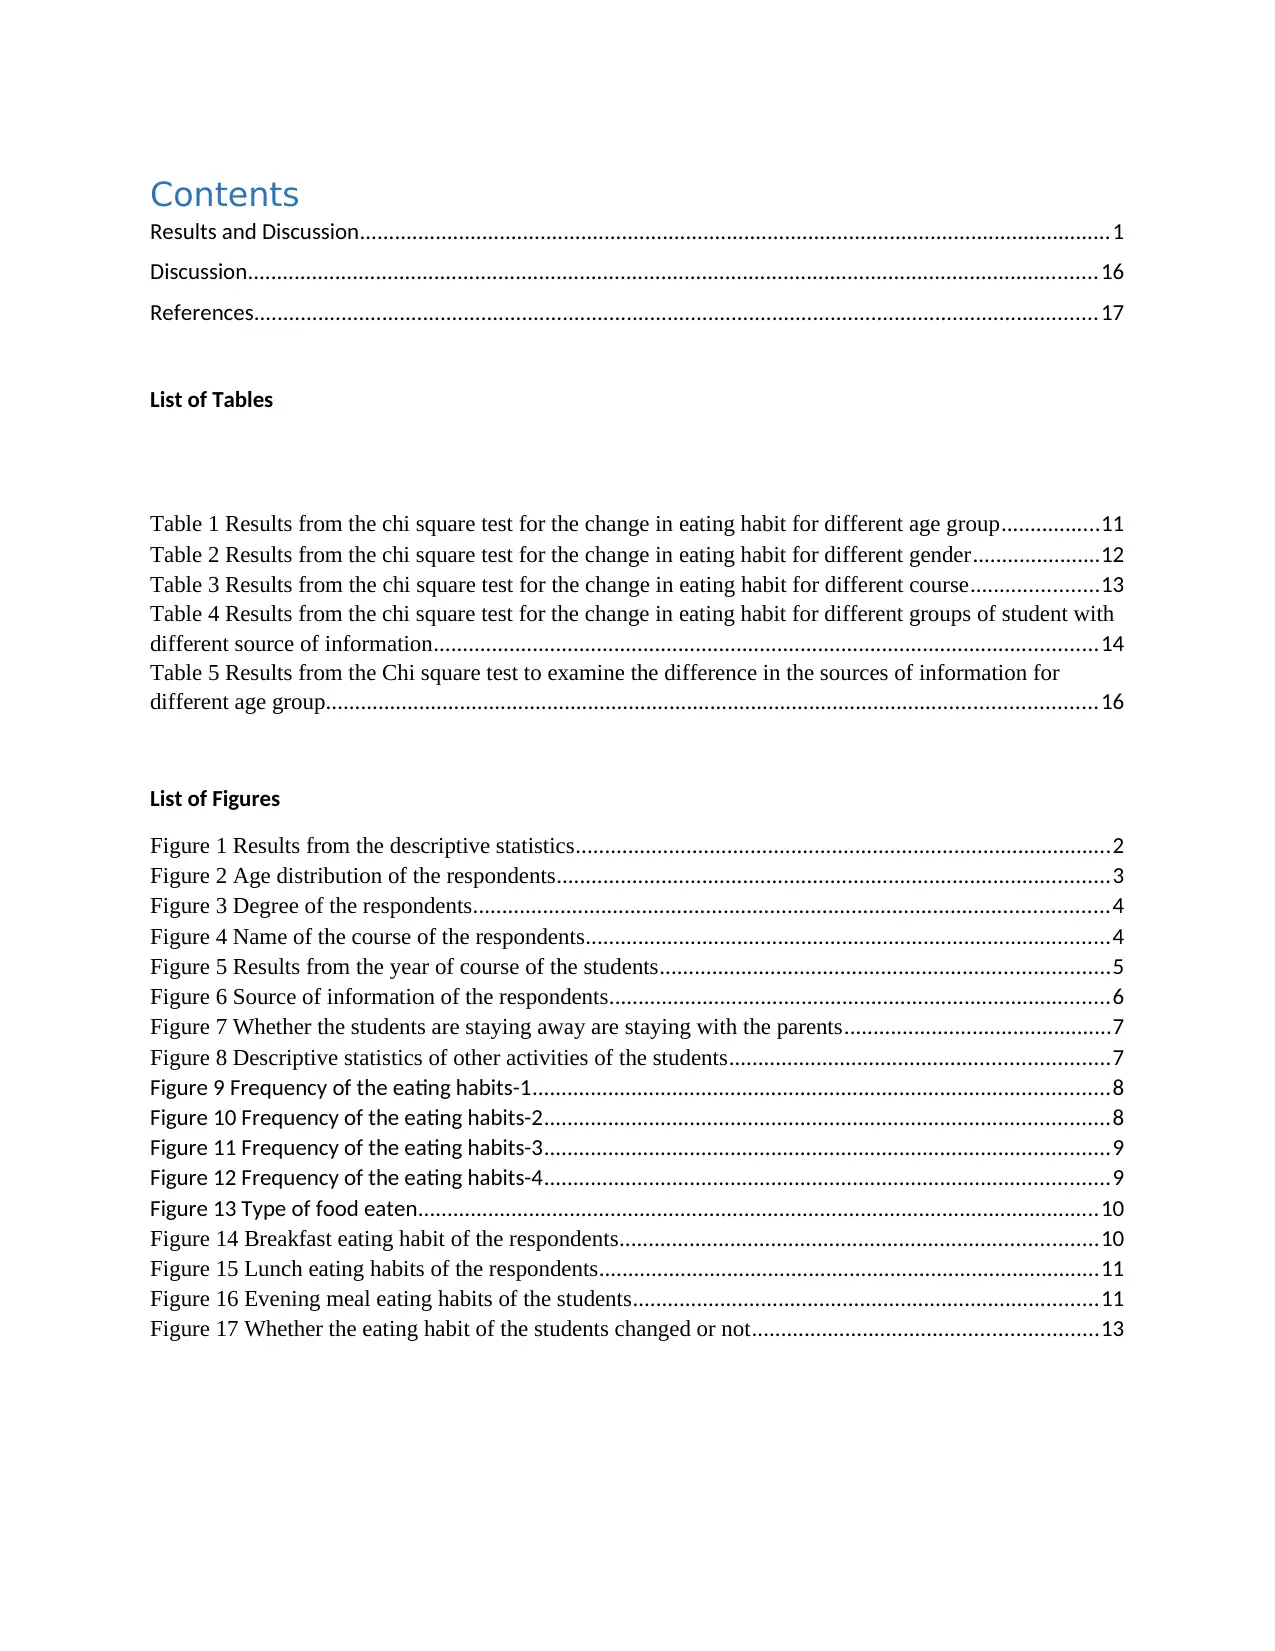
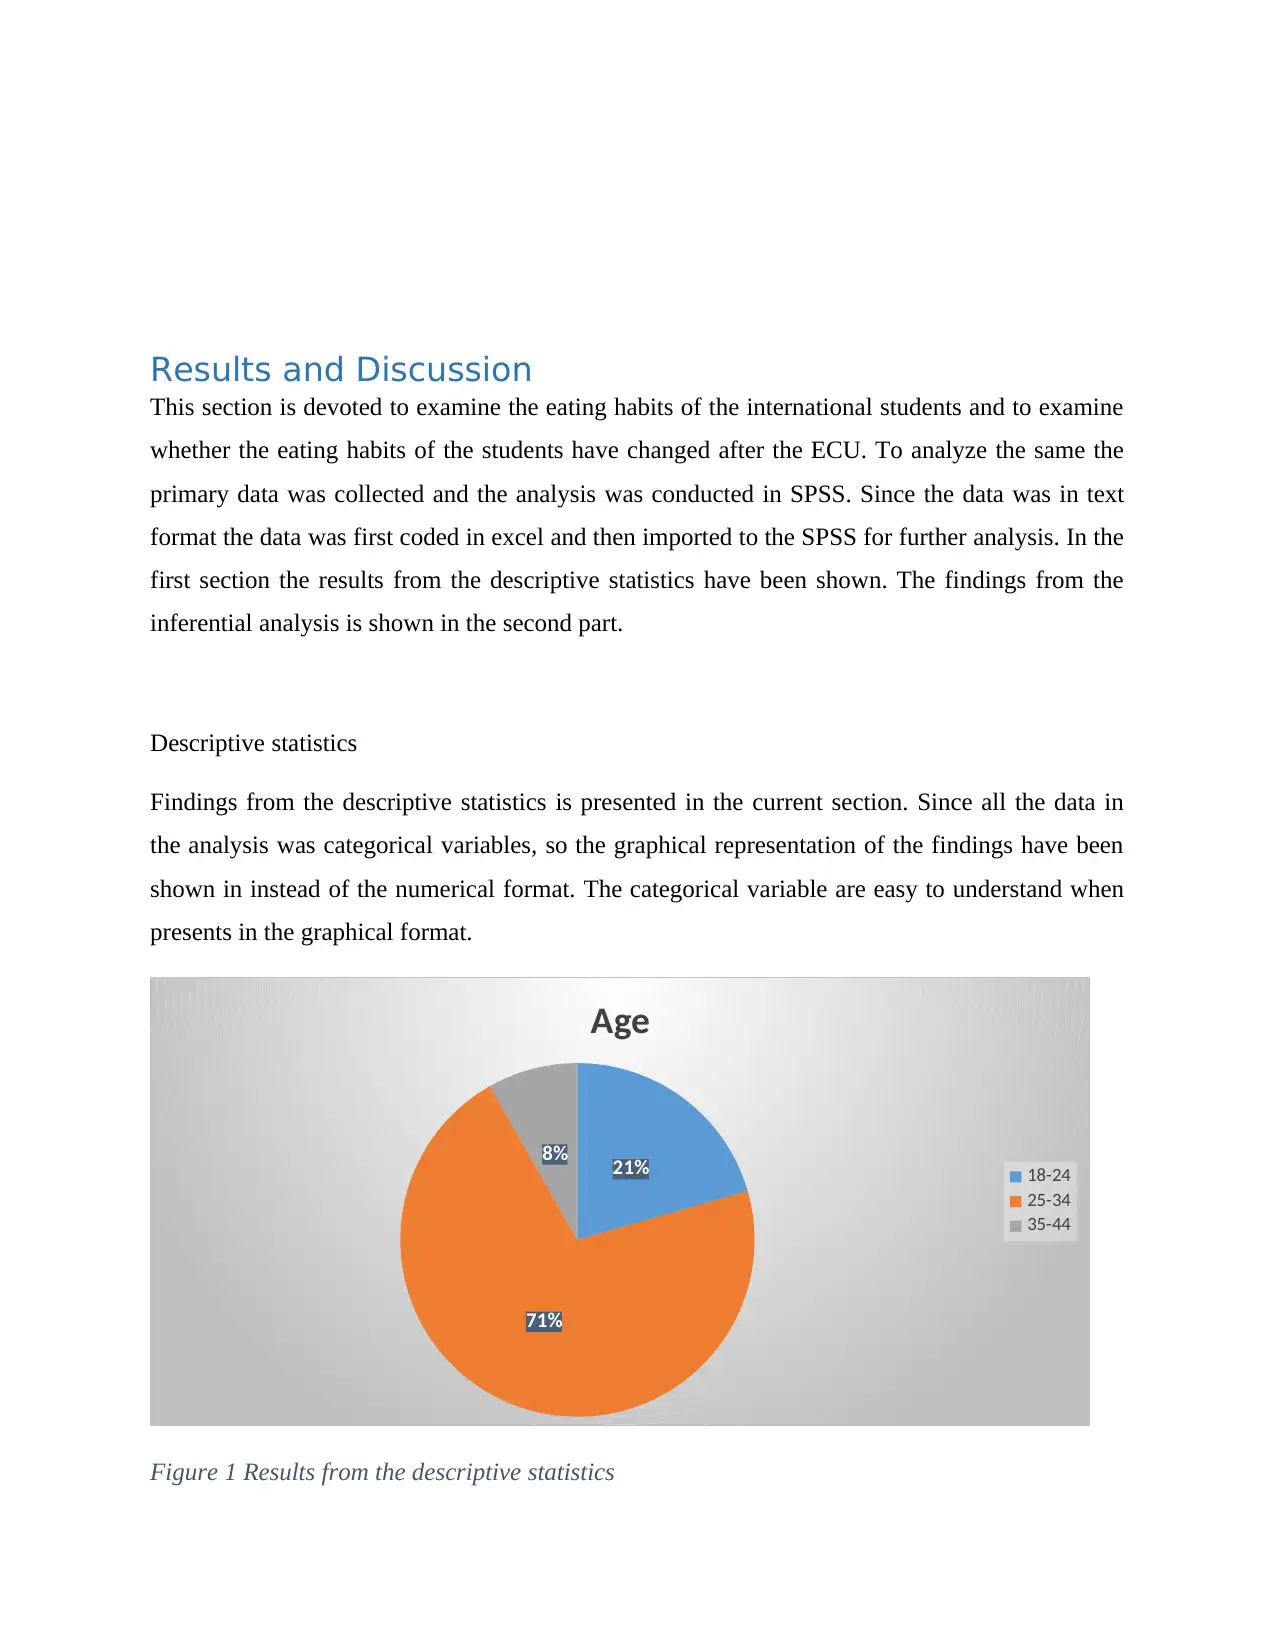
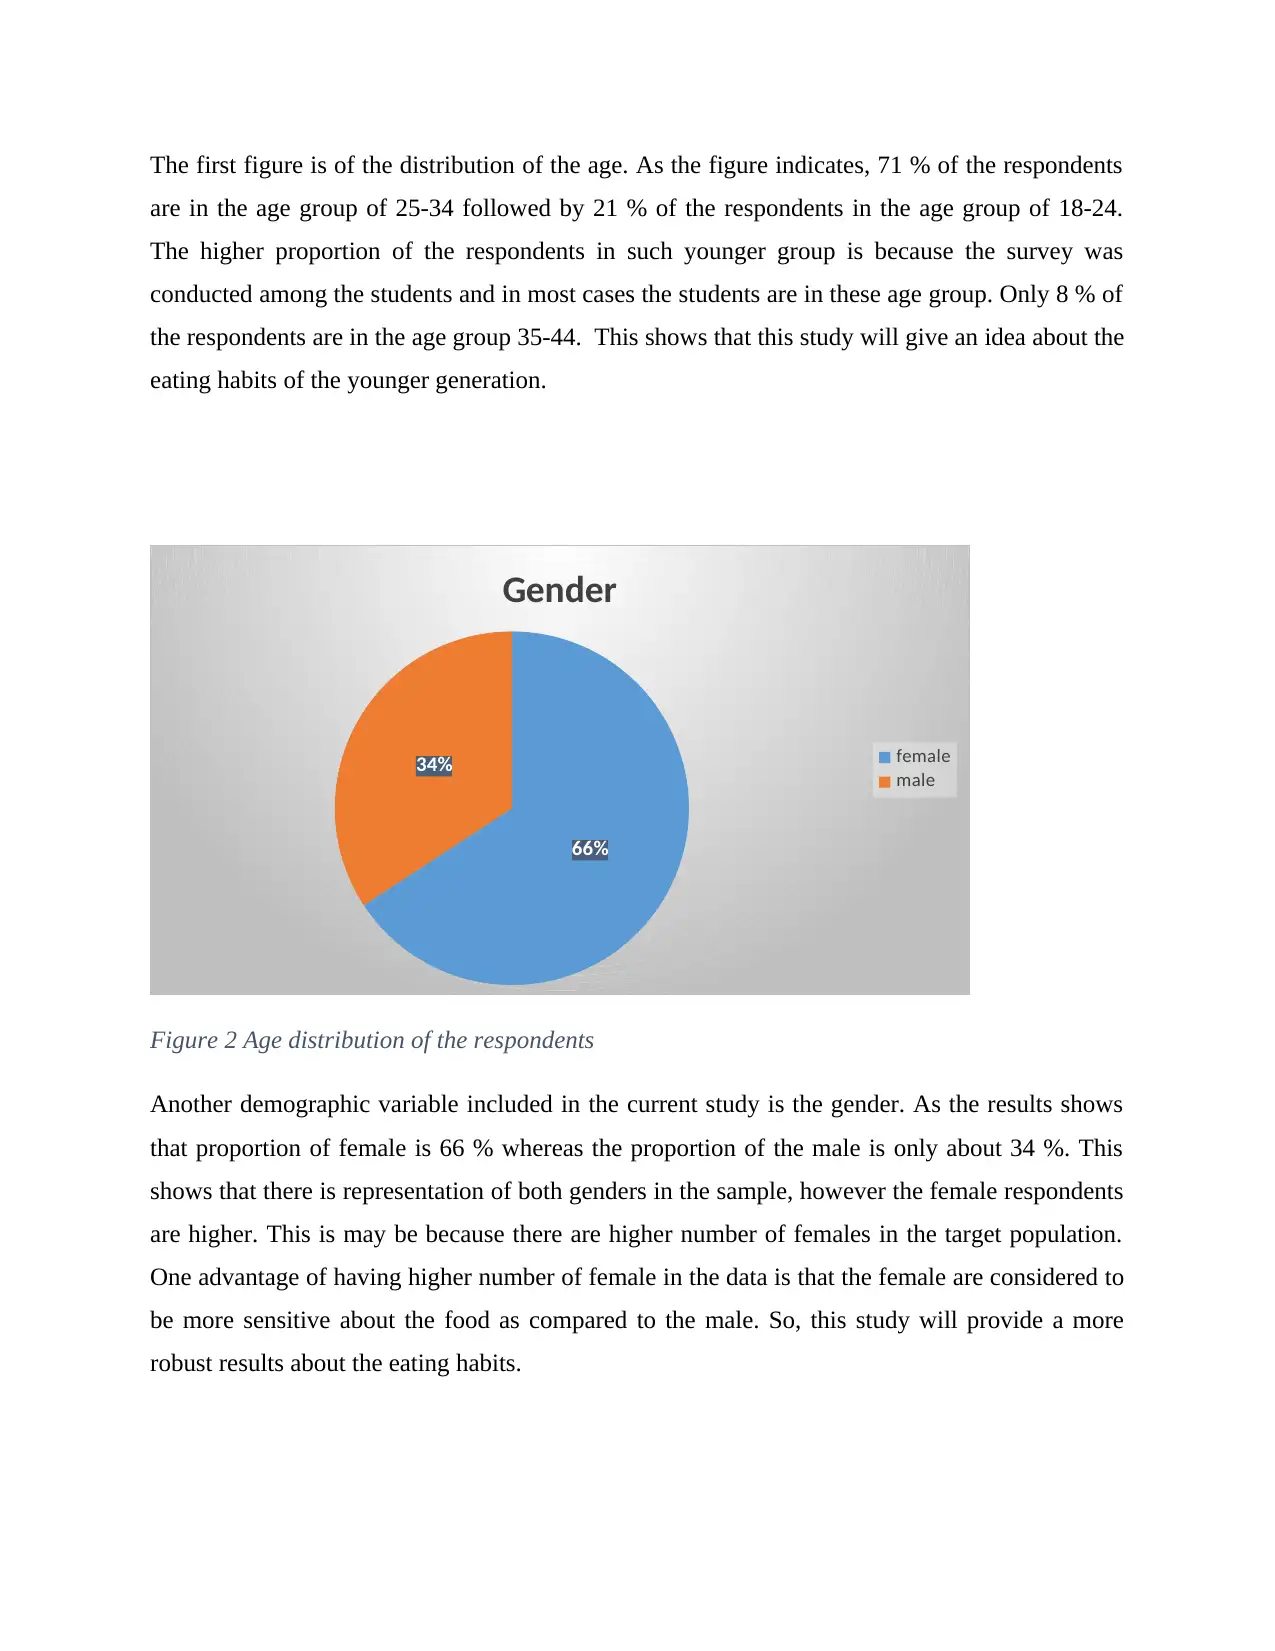
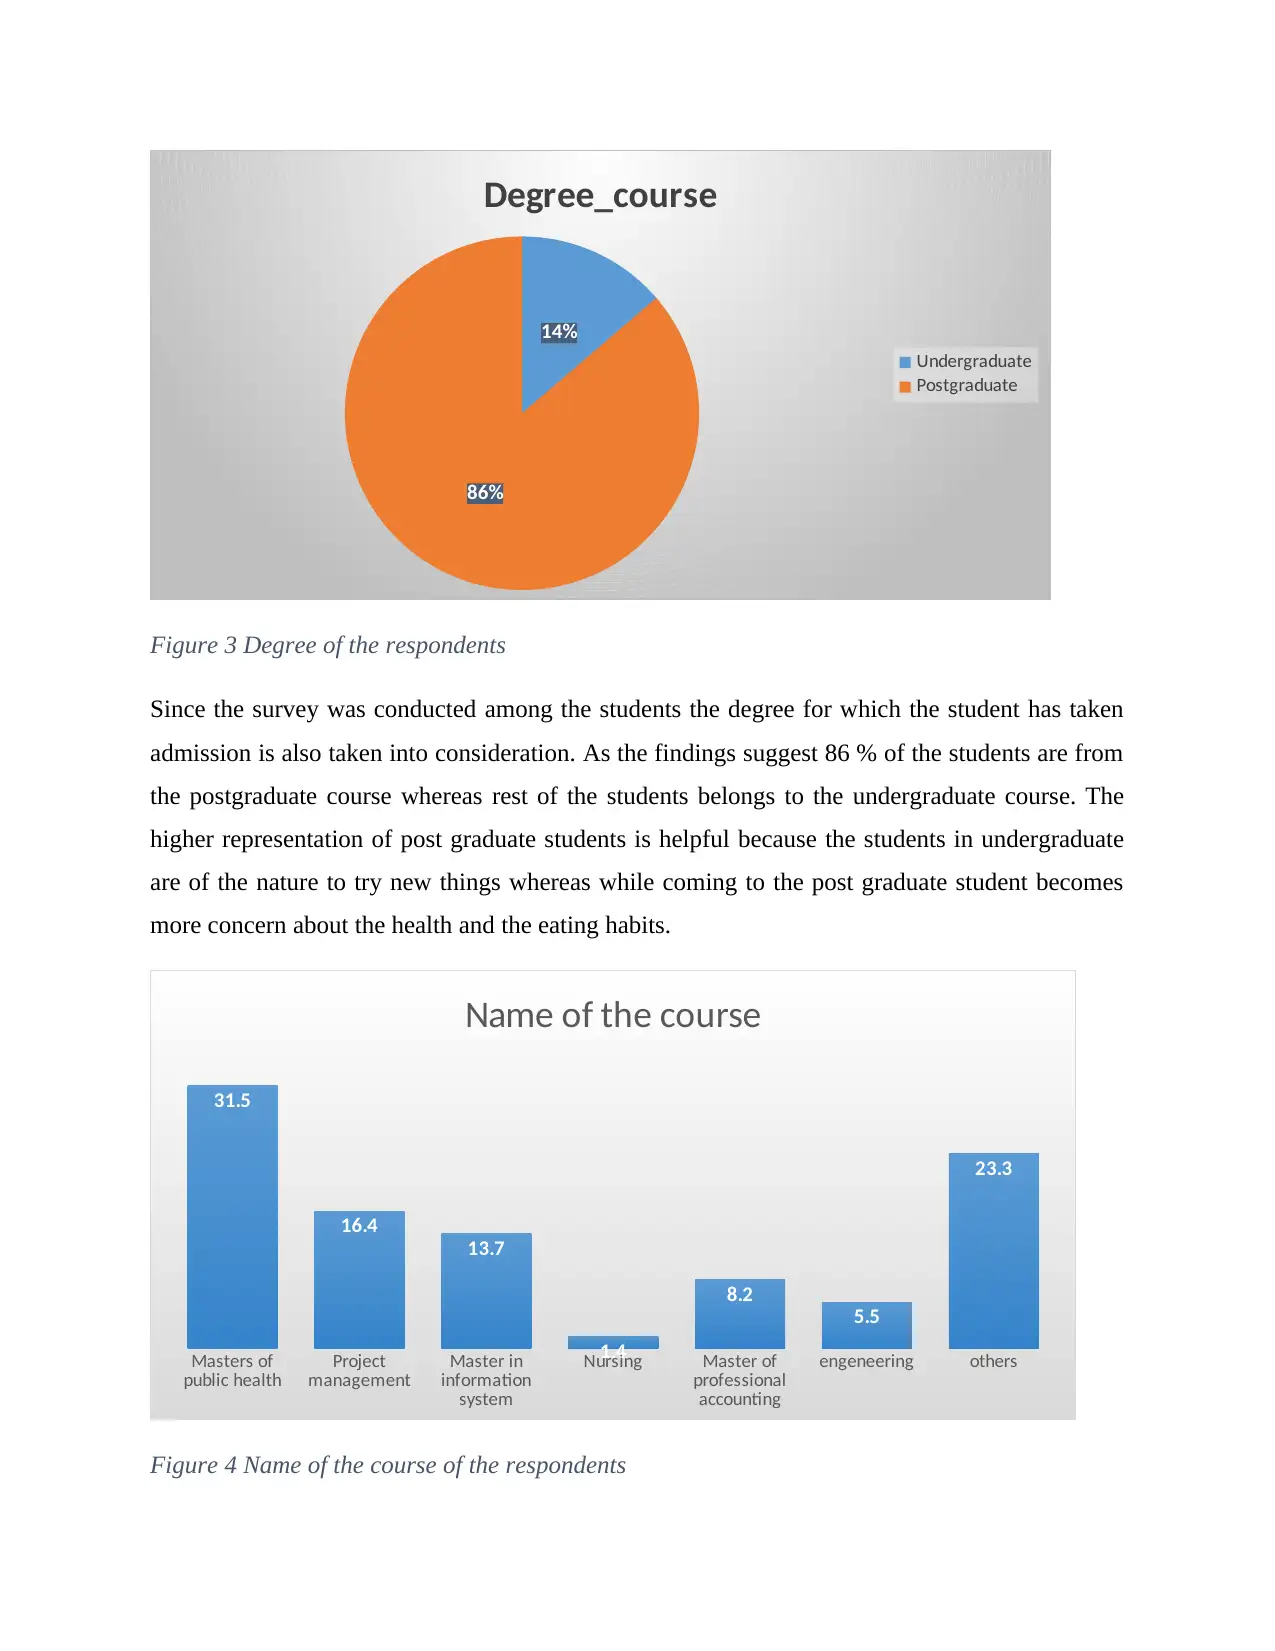
This report presents a quantitative analysis of the eating habits of international students at Edith Cowan University (ECU). The study utilized primary data collected through surveys and analyzed using SPSS to examine the students' dietary patterns and any changes after their arrival at ECU. The results section includes descriptive statistics, presented graphically due to the categorical nature of the data, covering demographics such as age, gender, degree, course, and source of health information. Inferential statistics, specifically chi-square tests, were used to assess relationships between various factors and eating habits. Findings reveal that the majority of respondents are in the 25-34 age group, with a higher proportion of female participants. The analysis explores the frequency of consumption of different food groups, breakfast, lunch, and evening meal habits, and the influence of information sources on dietary choices. The discussion section interprets these findings, exploring the potential impacts of cultural adaptation and university life on student nutrition. Results from the chi-square tests are shown in tables and figures, showing how eating habits vary across different demographic groups and information sources. The study concludes by discussing the implications of these findings and the need for further research to support the health and well-being of international students.
Document Page
Contents
Results and Discussion.................................................................................................................................1
Discussion..................................................................................................................................................16
References.................................................................................................................................................17
List of Tables
Table 1 Results from the chi square test for the change in eating habit for different age group.................11
Table 2 Results from the chi square test for the change in eating habit for different gender......................12
Table 3 Results from the chi square test for the change in eating habit for different course......................13
Table 4 Results from the chi square test for the change in eating habit for different groups of student with
different source of information..................................................................................................................14
Table 5 Results from the Chi square test to examine the difference in the sources of information for
different age group....................................................................................................................................16
List of Figures
Figure 1 Results from the descriptive statistics............................................................................................2
Figure 2 Age distribution of the respondents...............................................................................................3
Figure 3 Degree of the respondents.............................................................................................................4
Figure 4 Name of the course of the respondents..........................................................................................4
Figure 5 Results from the year of course of the students.............................................................................5
Figure 6 Source of information of the respondents......................................................................................6
Figure 7 Whether the students are staying away are staying with the parents..............................................7
Figure 8 Descriptive statistics of other activities of the students.................................................................7
Figure 9 Frequency of the eating habits-1...................................................................................................8
Figure 10 Frequency of the eating habits-2.................................................................................................8
Figure 11 Frequency of the eating habits-3.................................................................................................9
Figure 12 Frequency of the eating habits-4.................................................................................................9
Figure 13 Type of food eaten.....................................................................................................................10
Figure 14 Breakfast eating habit of the respondents..................................................................................10
Figure 15 Lunch eating habits of the respondents......................................................................................11
Figure 16 Evening meal eating habits of the students................................................................................11
Figure 17 Whether the eating habit of the students changed or not...........................................................13
tabler-icon-diamond-filled.svg

Paraphrase This Document

Need a fresh take? Get an instant paraphrase of this document with our AI Paraphraser
Document Page
Results and Discussion
This section is devoted to examine the eating habits of the international students and to examine
whether the eating habits of the students have changed after the ECU. To analyze the same the
primary data was collected and the analysis was conducted in SPSS. Since the data was in text
format the data was first coded in excel and then imported to the SPSS for further analysis. In the
first section the results from the descriptive statistics have been shown. The findings from the
inferential analysis is shown in the second part.
Descriptive statistics
Findings from the descriptive statistics is presented in the current section. Since all the data in
the analysis was categorical variables, so the graphical representation of the findings have been
shown in instead of the numerical format. The categorical variable are easy to understand when
presents in the graphical format.
21%
71%
8%
Age
18-24
25-34
35-44
Figure 1 Results from the descriptive statistics
Document Page
The first figure is of the distribution of the age. As the figure indicates, 71 % of the respondents
are in the age group of 25-34 followed by 21 % of the respondents in the age group of 18-24.
The higher proportion of the respondents in such younger group is because the survey was
conducted among the students and in most cases the students are in these age group. Only 8 % of
the respondents are in the age group 35-44. This shows that this study will give an idea about the
eating habits of the younger generation.
66%
34%
Gender
female
male
Figure 2 Age distribution of the respondents
Another demographic variable included in the current study is the gender. As the results shows
that proportion of female is 66 % whereas the proportion of the male is only about 34 %. This
shows that there is representation of both genders in the sample, however the female respondents
are higher. This is may be because there are higher number of females in the target population.
One advantage of having higher number of female in the data is that the female are considered to
be more sensitive about the food as compared to the male. So, this study will provide a more
robust results about the eating habits.
Document Page
14%
86%
Degree_course
Undergraduate
Postgraduate
Figure 3 Degree of the respondents
Since the survey was conducted among the students the degree for which the student has taken
admission is also taken into consideration. As the findings suggest 86 % of the students are from
the postgraduate course whereas rest of the students belongs to the undergraduate course. The
higher representation of post graduate students is helpful because the students in undergraduate
are of the nature to try new things whereas while coming to the post graduate student becomes
more concern about the health and the eating habits.
Masters of
public health Project
management Master in
information
system
Nursing Master of
professional
accounting
engeneering others
31.5
16.4
13.7
1.4
8.2
5.5
23.3
Name of the course
Figure 4 Name of the course of the respondents
tabler-icon-diamond-filled.svg

Paraphrase This Document

Need a fresh take? Get an instant paraphrase of this document with our AI Paraphraser
Document Page
In terms of the course, most of the students are from the course Masters of public health followed
by the project management course whose proportion in the sample is 16.4 %. Apart from this
other courses included in the study are master in information system, nursing, master of
professional accounting and engineering. This shows that there is representation from all courses
in the sample. This will allow the researcher to generalize the results from the analysis.
First year Second year Third year
23.3
52.1
24.7
Year of course
Figure 5 Results from the year of course of the students
Furthermore the results from the variable, the year of course is shown in the above figure. As the
figure shows 52 % of the respondents are in the second year followed by 24.7 % of the students
in the third year. The proportion of the students in the first year is 23.3. The higher proportion of
the students in the second year is may be because most of the students are from the post graduate
which is usually of 2 years.
Document Page
internet University/school/training
courses Family other
0.0
10.0
20.0
30.0
40.0
50.0
60.0
70.0
80.0 74.0
13.7
4.1 8.2
Source of information about health
Figure 6 Source of information of the respondents
Another important variable for the current study is the source of information about the health
issues. As expected 74 % of the students said that they get information from internet followed by
University/school training courses. The proportion of information from family and other sources
are very less as compared to the internet. With increase in the use of social media and the
development in the information technology most of the information is available online which is
most convenient and cheap source of information. So, in the recent time not only the students but
people in all age group prefer to search it online instead of asking family friends or read books.
60%
37%
3%
You are living with?
Away from your family
With your family
other
Document Page
Figure 7 Whether the students are staying away are staying with the parents
Another question asked to the respondents was whether they live with their family or away from
family. As the figure above shows most of the students stay away from the family. The higher
percentage of students staying away from the family was expected as the students are the
international students. Also, another important point is that the students who stays with their
family are expected to follow the healthy food as compared to the students who stay away from
the family.
Everyday 1-2 times a
week 1-3 times a
month 3-4 times a
week 5-6 times a
week Rarely in a
month Never
0
10
20
30
40
50
60
70
80
90
Other actitivies
Pub Movies Disco/night clubs sports/gym other
Figure 8 Descriptive statistics of other activities of the students
In addition another question was asked about the other activities of the students apart from their
studies. As the results shows different options was given to the students and they were asked to
give the frequency of such activities. As the results shows, the everyday activities includes
movies, sports gym and other activities. However proportion of such students is very low. On
other hand for most of the students do not go to pub and disco. Also the proportion of student
who rarely goes to sports/gym is also higher.
Eating habits
tabler-icon-diamond-filled.svg

Paraphrase This Document

Need a fresh take? Get an instant paraphrase of this document with our AI Paraphraser
Document Page
Everyday 1-2 times a
week 1-3 times a
month 3-4 times a
week 5-6 times a
week Rarely in a
month Never
0.0
10.0
20.0
30.0
40.0
50.0
60.0
Eating Habits
Fresh Fruit raw Veg Cooked vegetables
Cakes/biscuite Grain Cereals Meat
Figure 9 Frequency of the eating habits-1
Results shows that cooked vegetables is eaten everyday by most of the students followed by
grain and cereals. On the other hand meat is the never eaten by most of the students.
Everyday 1-2 times a
week 1-3 times a
month 3-4 times a
week 5-6 times a
week Rarely in a
month Never
0.0
10.0
20.0
30.0
40.0
50.0
60.0
Eating habits
Fish Dairy Meat_prdocut Eggs Hot Chips
Figure 10 Frequency of the eating habits-2
Among other food, dairy products eaten daily by the students followed by eggs and the meant
products and fish are never eaten by most of the students.
Document Page
Everyday 1-2 times a
week 1-3 times a
month 3-4 times a
week 5-6 times a
week Rarely in a
month Never
0.0
5.0
10.0
15.0
20.0
25.0
30.0
35.0
Eating habits
Pulses Fast food Snacks Fresh fruit juice
Figure 11 Frequency of the eating habits-3
Furthermore pulses are eaten by some of the students on daily basis whereas most of them eat only 3-4
times a week. Only small proportion of students have not eaten fast food.
Beer Wine Soft Drinks Spirits Tea/coffee Sauces Milk
0
10
20
30
40
50
60
70
80
90
Eating Habits
Everyday 1-2 times a week 1-3 times a month 3-4 times a week
5-6 times a week Rarely in a month Never
Figure 12 Frequency of the eating habits-4
Lastly the alcoholic products are never used by the students. Milk is used every day by most of
the students.
Document Page
homecooked Cold meals Re-heated
meals Frozen meals Ready meals home made
sandwiches take away
foods
0.0
10.0
20.0
30.0
40.0
50.0
60.0
70.0
Type of food eaten
Everyday 1-2 times a week 1-3 times a month 3-4 times a week
5-6 times a week Rarely in a month Never
Figure 13 Type of food eaten
Results shows that home cooked food is eaten by students on daily basis whereas cold meals, frozen
meals and take away foods are rarely eaten by the students.
At home Cafe/restaurant I usually don't eat
67.1
6.8
26.0
Breakfast
Figure 14 Breakfast eating habit of the respondents
In this section the results for the eating habits of the respondents have been collected. As the
figure above shows when asked about the breakfast 67 % of the students said that they eat
breakfast at home whereas 26 % said they do not eat breakfast at all. Since most of the students
are expected to be at home in the morning the breakfast eating at home is higher.
tabler-icon-diamond-filled.svg

Paraphrase This Document

Need a fresh take? Get an instant paraphrase of this document with our AI Paraphraser
Document Page
At home Cafe/restaurant Packed lunch
prepared at home I usually don't eat
lunch other
34.2
13.7
41.1
9.6
1.4
Lunch
Figure 15 Lunch eating habits of the respondents
When it comes to lunch 41 % said they have lunch prepared at home and another 34 % said they
have lunch at home only. The proportion of students having lunch at café is higher as compared
to the breakfast.
At home Cafe/restaurant I usually don't eat an evening
meal
78.1
9.6 12.3
Evening meal
Figure 16 Evening meal eating habits of the students
Document Page
Finally for the evening meal, 78 % said that they have it at home. This indicates that students try
to have the evening meal at home. They get back from college/work in the evening and have
their food at home.
chevron_up_icon
1 out of 20
circle_padding
hide_on_mobile
zoom_out_icon
[object Object]