Business Analysis Report: Eclipse Vans Performance 2017-2018 Analysis

Verified

Added on  2022/11/22

|9
|1070
|477
Report
AI Summary
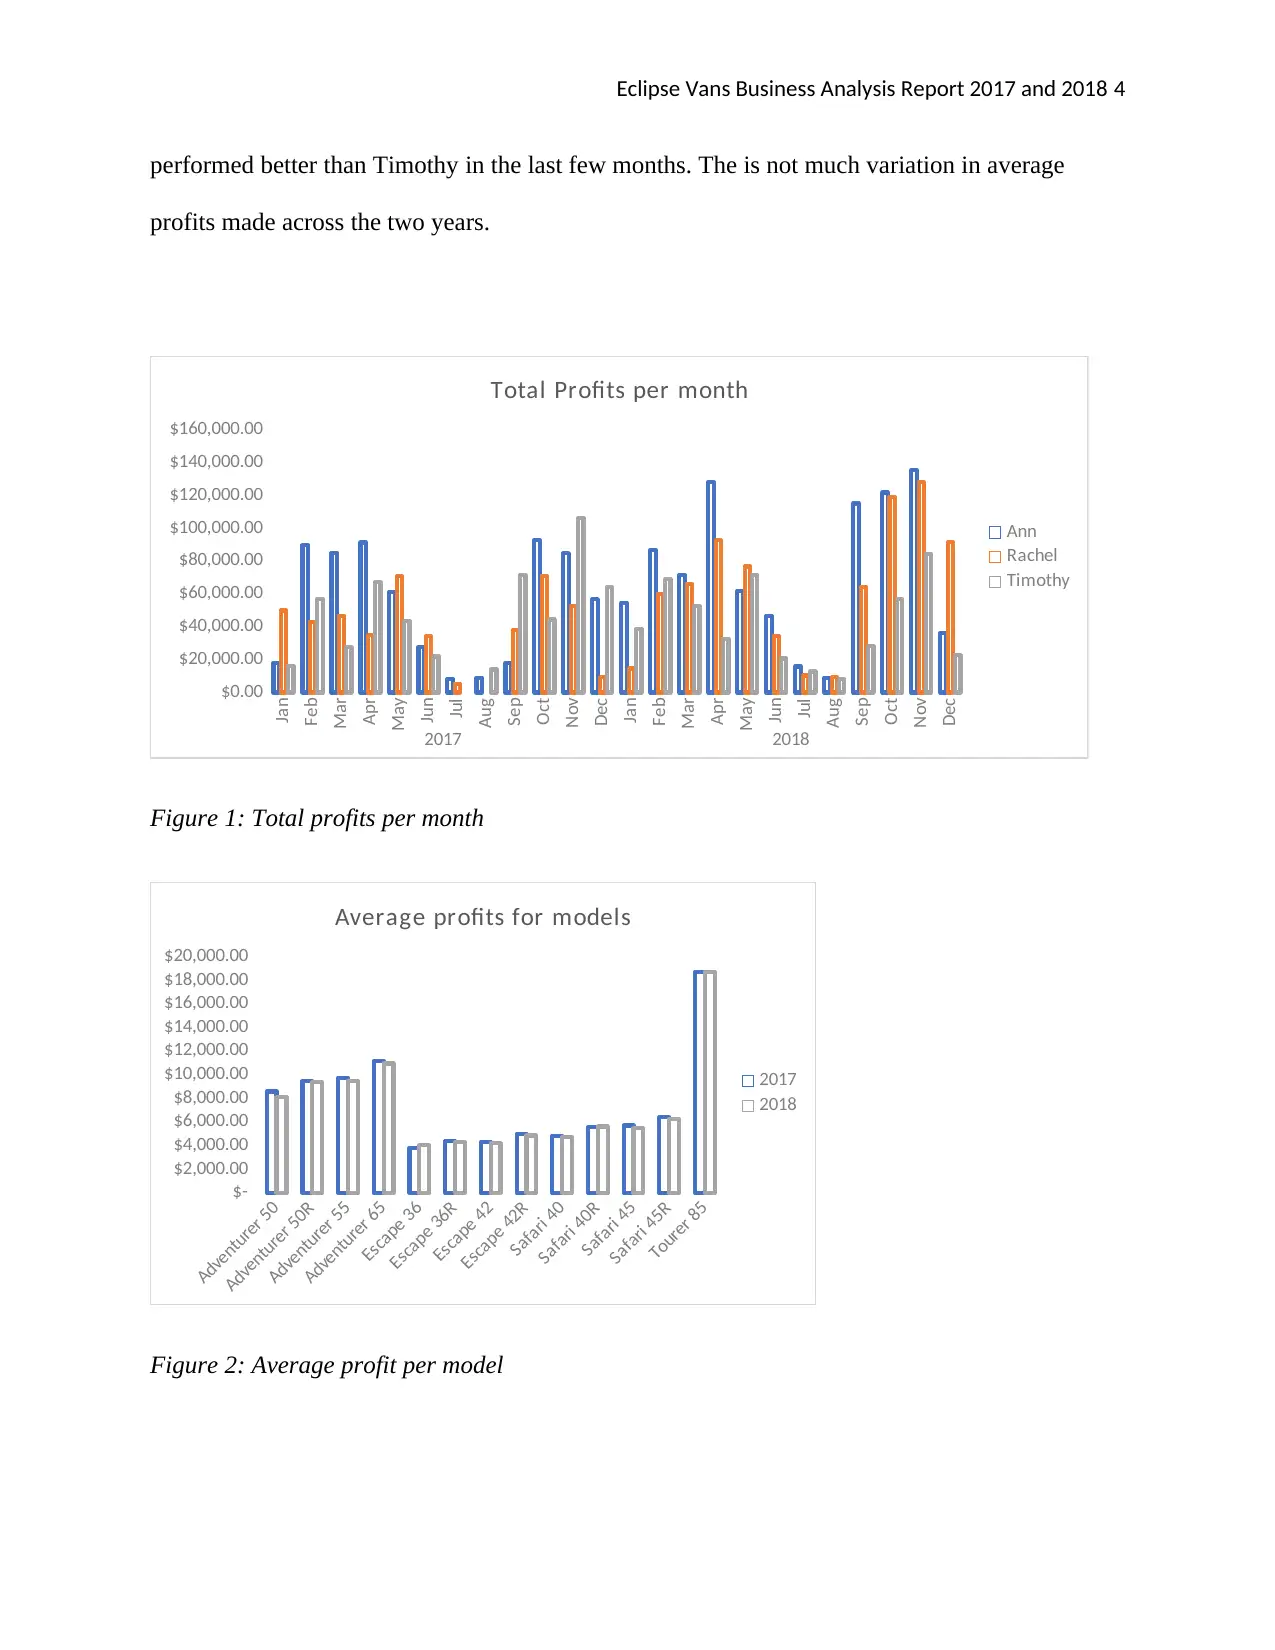
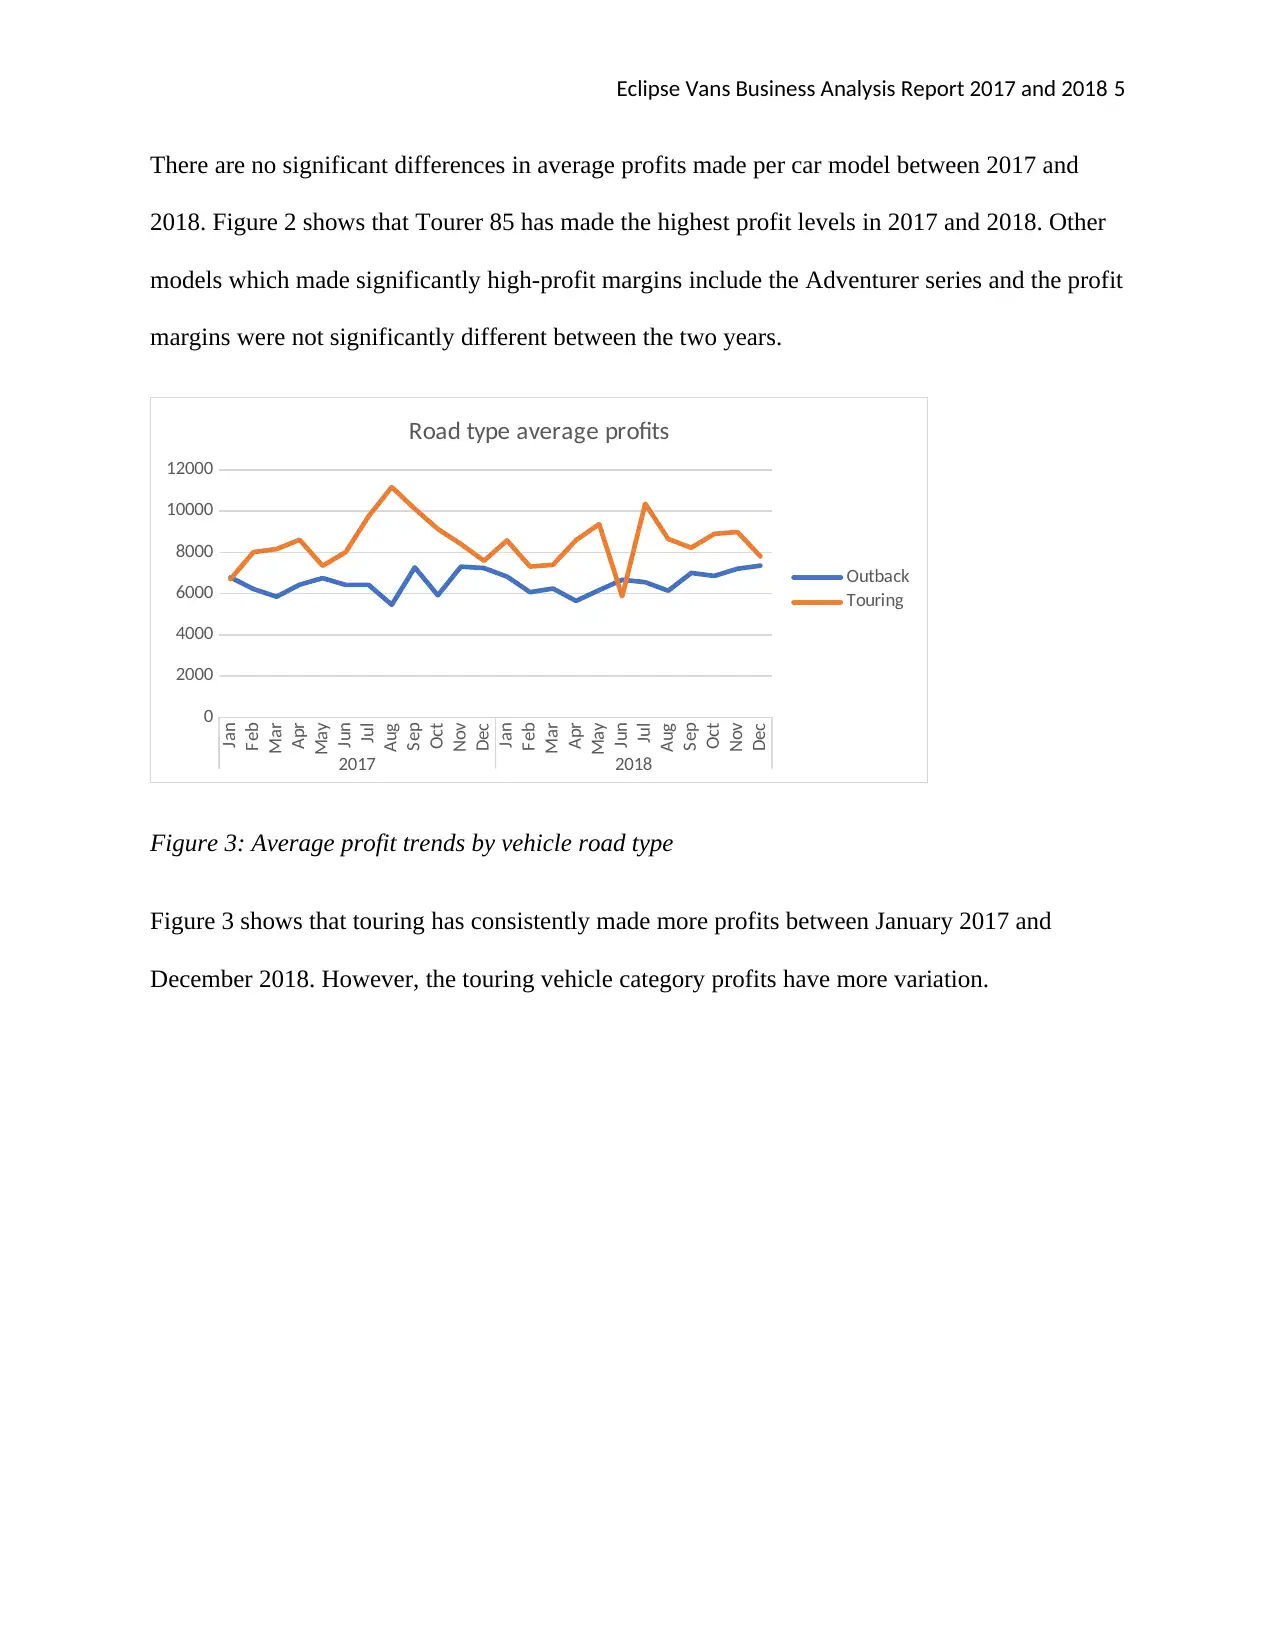
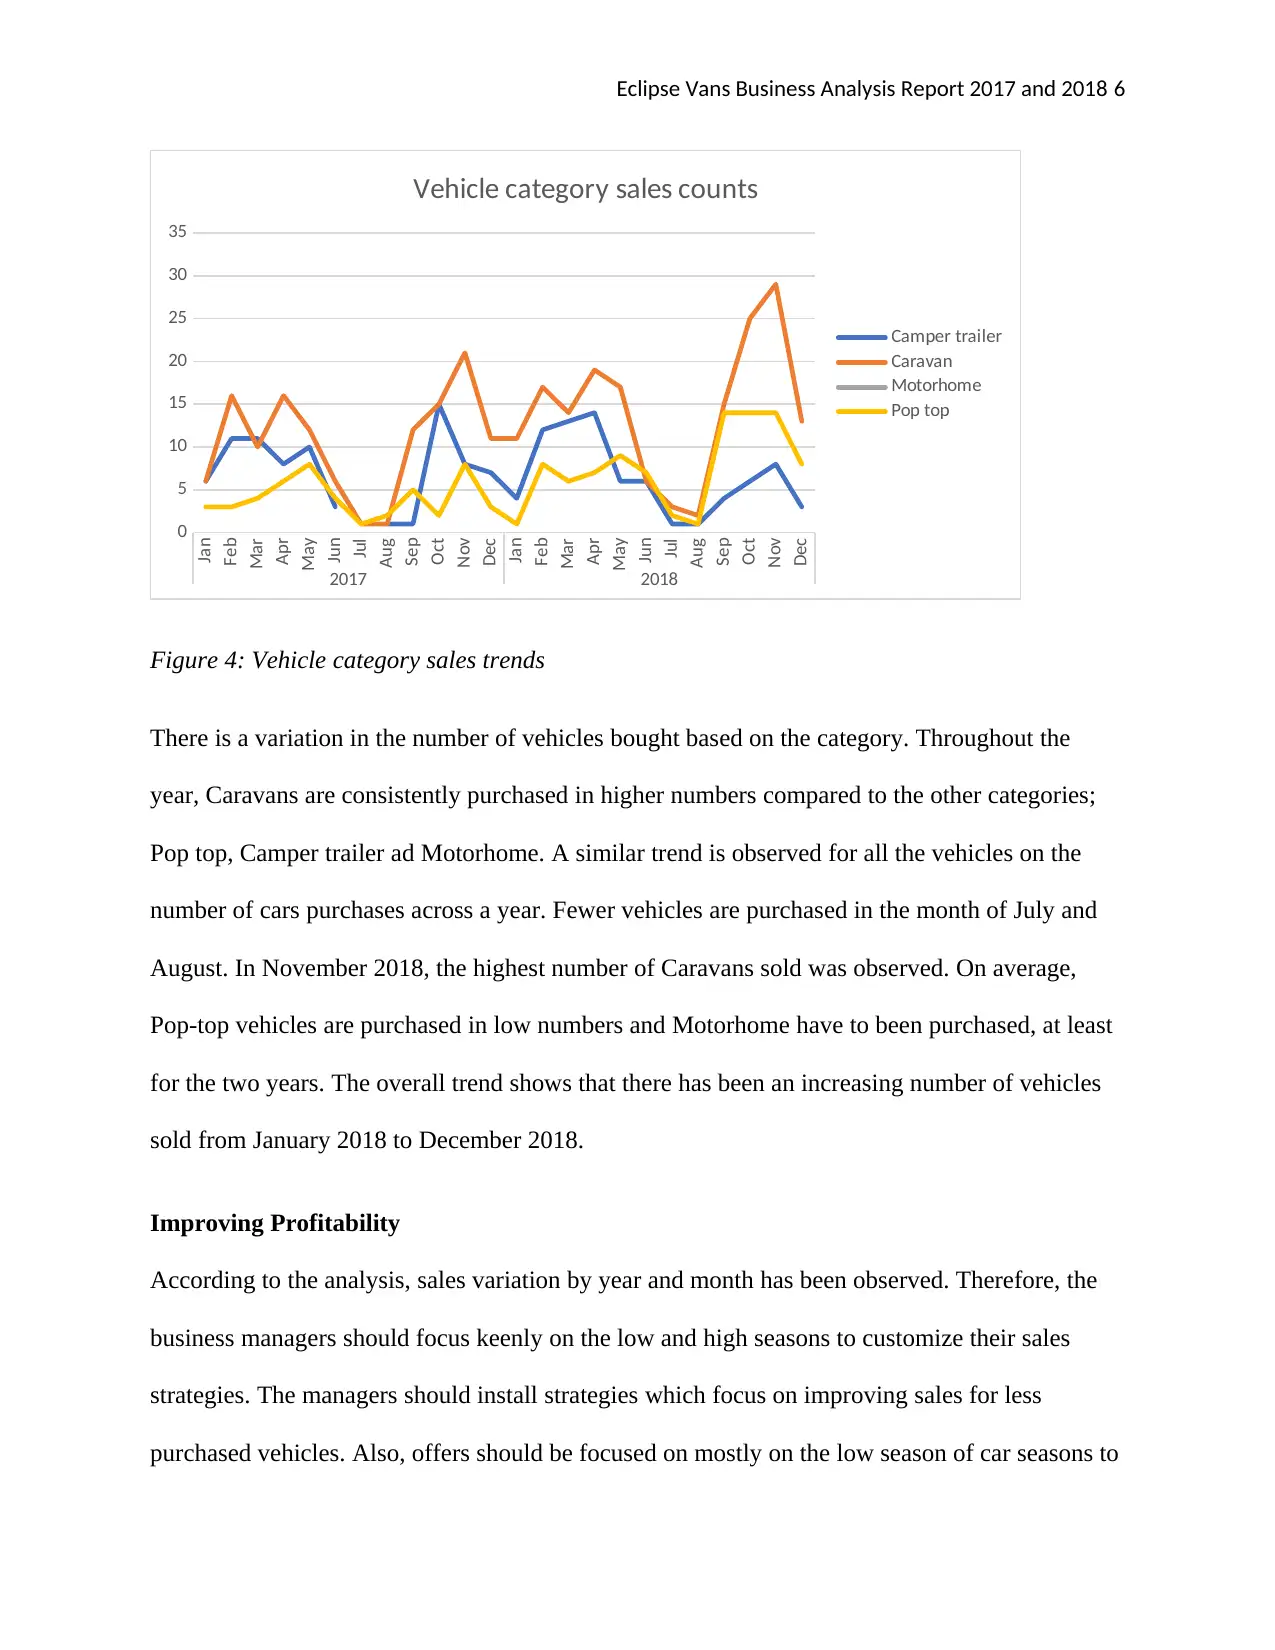
This report provides a comprehensive business analysis of Eclipse Vans, a recreational vehicle manufacturer, using sales data from 2017 and 2018. The analysis examines profitability trends, sales variations by month and vehicle type, and identifies key market insights. The report highlights seasonal patterns in sales, with peak seasons observed from February to May and September to December, and explores the preferences for caravan models. Recommendations are provided to improve profitability, including customized sales strategies for low and high seasons, increased focus on less-purchased vehicles, and further research into customer preferences. The report concludes with actionable strategies for business managers to balance resource allocation and optimize sales performance, emphasizing the importance of understanding customer behavior and market dynamics for sustainable growth. The report also suggests the importance of special offers during low seasons, balancing offers across various models and ensuring there is enough information for customers to make informed decisions.
Document Page
Eclipse Vans Business Analysis Report 2017 and 2018
Name
Course Number
Date
Faculty Name
tabler-icon-diamond-filled.svg

Paraphrase This Document

Need a fresh take? Get an instant paraphrase of this document with our AI Paraphraser
Document Page
Eclipse Vans Business Analysis Report 2017 and 2018 2
Table of Contents
Introduction......................................................................................................................................2
Results..............................................................................................................................................2
Improving Profitability....................................................................................................................5
Conclusion.......................................................................................................................................6
Recommendations............................................................................................................................7
Document Page
Eclipse Vans Business Analysis Report 2017 and 2018 3
Eclipse Vans Business Analysis Report 2017 and 2018
Introduction
Business analysis is crucial in understanding the performance based on profit, loss, sales among
other important aspects. The business performance details help investors understand better ways
of running the business to maximise the profits. Quality data management and recording are
needed to monitor business progress. Further, good statistical analysis provides quality
information about the performance of a business, hence outlining recommendations to better the
business processes.
In this report, sales data for Eclipse Vans manufacturer recorded in the year 2017 and 2018 will
be used to develop a report on profitability, hence recommendations for better strategies. First,
an analysis of the profitability of the business will be conducted to show its past and present
business state. Further, the results will be analysed and options explored for future sales growth
based on the requirements of the business managers. Finally, another business action will be
recommended to help the business make more profits.
Results
Figure 1 below shows total profits in a month for the two years, 2017 and 2018. There is a
systematic trend on how Eclipse Vans makes profits around the year. Generally, every year has
two seasons of high profits, with the first occurring around February to May and the second
September to December. Similarly, low seasons are experienced July and August. On average,
there is no significant difference in the amount of profit earned, however, 2018 experienced more
profits compared with 2017. Ann been making more sales compared with Rachael and Timothy.
However, the junior sales officers are doing remarkably good, although Rachel has consistently
Document Page
Eclipse Vans Business Analysis Report 2017 and 2018 4
performed better than Timothy in the last few months. The is not much variation in average
profits made across the two years.
Jan
Feb
Mar
Apr
May
Jun
Jul
Aug
Sep
Oct
Nov
Dec
Jan
Feb
Mar
Apr
May
Jun
Jul
Aug
Sep
Oct
Nov
Dec
2017 2018
$0.00
$20,000.00
$40,000.00
$60,000.00
$80,000.00
$100,000.00
$120,000.00
$140,000.00
$160,000.00
Total Profits per month
Ann
Rachel
Timothy
Figure 1: Total profits per month
Adventurer 50
Adventurer 50R
Adventurer 55
Adventurer 65
Escape 36
Escape 36R
Escape 42
Escape 42R
Safari 40
Safari 40R
Safari 45
Safari 45R
Tourer 85
$-
$2,000.00
$4,000.00
$6,000.00
$8,000.00
$10,000.00
$12,000.00
$14,000.00
$16,000.00
$18,000.00
$20,000.00
Average profits for models
2017
2018
Figure 2: Average profit per model
tabler-icon-diamond-filled.svg

Paraphrase This Document

Need a fresh take? Get an instant paraphrase of this document with our AI Paraphraser
Document Page
Eclipse Vans Business Analysis Report 2017 and 2018 5
There are no significant differences in average profits made per car model between 2017 and
2018. Figure 2 shows that Tourer 85 has made the highest profit levels in 2017 and 2018. Other
models which made significantly high-profit margins include the Adventurer series and the profit
margins were not significantly different between the two years.
Jan
Feb
Mar
Apr
May
Jun
Jul
Aug
Sep
Oct
Nov
Dec
Jan
Feb
Mar
Apr
May
Jun
Jul
Aug
Sep
Oct
Nov
Dec
2017 2018
0
2000
4000
6000
8000
10000
12000
Road type average profits
Outback
Touring
Figure 3: Average profit trends by vehicle road type
Figure 3 shows that touring has consistently made more profits between January 2017 and
December 2018. However, the touring vehicle category profits have more variation.
Document Page
Eclipse Vans Business Analysis Report 2017 and 2018 6
Jan
Feb
Mar
Apr
May
Jun
Jul
Aug
Sep
Oct
Nov
Dec
Jan
Feb
Mar
Apr
May
Jun
Jul
Aug
Sep
Oct
Nov
Dec
2017 2018
0
5
10
15
20
25
30
35
Vehicle category sales counts
Camper trailer
Caravan
Motorhome
Pop top
Figure 4: Vehicle category sales trends
There is a variation in the number of vehicles bought based on the category. Throughout the
year, Caravans are consistently purchased in higher numbers compared to the other categories;
Pop top, Camper trailer ad Motorhome. A similar trend is observed for all the vehicles on the
number of cars purchases across a year. Fewer vehicles are purchased in the month of July and
August. In November 2018, the highest number of Caravans sold was observed. On average,
Pop-top vehicles are purchased in low numbers and Motorhome have to been purchased, at least
for the two years. The overall trend shows that there has been an increasing number of vehicles
sold from January 2018 to December 2018.
Improving Profitability
According to the analysis, sales variation by year and month has been observed. Therefore, the
business managers should focus keenly on the low and high seasons to customize their sales
strategies. The managers should install strategies which focus on improving sales for less
purchased vehicles. Also, offers should be focused on mostly on the low season of car seasons to
Document Page
Eclipse Vans Business Analysis Report 2017 and 2018 7
encourage customers consider making purchases during these periods. Although the managers
should not neglect the high performing car types, they should not invest too much time on
advertisements and offers. However, more of these models should be produced and quality
managed to maintained or even improve the sales levels.
The managers should do more research on the variation of sales by year and model to have a
clear understanding of the customer preferences and causes of seasonality in purchases. A clear
understanding of the reasons customers opt for Caravan compared with the other vehicles would
help in decision making regarding production and sales. Further, the sales agents would be
reviewed and evaluated to help the managers understand their engagements with the customers
and which issues have been raised during sales process. Vehicles with very low purchase rate
should be produced in low numbers and more sales improvement strategies strengthened. For
instance, Motorhome vehicles have not been purchased and they might possibly be good
vehicles, however, lack of information hindering customers from making a choice. Therefore,
fliers about the available product can be a good option to let the customers and potential
customers know the available products.
Conclusion
In conclusion, the month of the year has been found to be a significant determinant of the total
profits and number of vehicles sold. Also, the type of vehicle also varies and customers seem to
prefer Caravans over the others. Similarly, Touring vehicle types have consistently made more
profits compared to Outback. The manager has a lot to work on in trying to publicize and balance
the special pack offers to reduce the likelihood of inducing offers on less profitable categories. A
better business strategy would be to focus on all the models while balancing resource
tabler-icon-diamond-filled.svg

Paraphrase This Document

Need a fresh take? Get an instant paraphrase of this document with our AI Paraphraser
Document Page
Eclipse Vans Business Analysis Report 2017 and 2018 8
distributions. For instance, producing less of the highly purchases models will be a bad business
decision and vice versa.
Recommendations
As a recommendation, the special offer packs should be focused on low seasons to avoid making
a lot of losses. Finally, model of the car should be considered in imposing the special pack. The
less purchased models should be focused to balance the purchasing rate.
Document Page
Eclipse Vans Business Analysis Report 2017 and 2018 9
Appendix
Filling the profit column
Calculating total profit
chevron_up_icon
1 out of 9
circle_padding
hide_on_mobile
zoom_out_icon
[object Object]