Eco-Fone Smartphones: Data Analysis and Problem Solving in UK Market
VerifiedAdded on 2023/04/11
|14
|2929
|303
Report
AI Summary
This report analyzes the UK technology market, focusing on Eco-Fone Smartphones. It assesses the potential for smartphone business expansion in Kingston, UK, highlighting pros and cons. The report examines market trends, including smartphone usage among older customers, and forecasts future growth. Cost analysis for a new building is included, along with testing net takings in two existing shops. Customer satisfaction is evaluated through questionnaire analysis, revealing insights into service quality and product durability. Quality control procedures are discussed, and key findings are summarized, offering recommendations for Eco-Fone to maintain quality and strategize for future growth. Desklib provides students access to similar reports and solved assignments for academic support.
Running head: Analysing Data For Problem Solving
Analysing Data for Problem Solving
Name of the Student
Name of the University
Author Note
Analysing Data for Problem Solving
Name of the Student
Name of the University
Author Note
Paraphrase This Document
Need a fresh take? Get an instant paraphrase of this document with our AI Paraphraser
1
Analysing Data for Problem Solving
Executive Summary
The reports deal with the technology market of UK. It shows how the scope of business of
smart phone is there in the UK market. The report has been made with the help of the
company name Eco-Fone. It shows what are the pros and cons which the company face while
expanding their business in Kingston. Lastly the report concludes how a company should
maintain its quality procedure and what are the methods which company uses to maintain its
quality. It even shows an analysis of its quality which was done by an questionnaire and it
show all the analysis regard the customer satisfaction.
2
Analysing Data for Problem Solving
Table of Contents
Introduction................................................................................................................................3
1. Analysis of Issues for Eco-Fone Smartphones...................................................................3
1.1 An Overview of the Mobile phone market in the UK.................................................3
1.2 Forecasting the UK Adult Smartphone use.................................................................4
1.3 Smartphones – A potential market for older customers...................................................5
1.4 Feasibility of expanding business to Kingston using Pros and Cons table......................6
1.5 Cost of new Building.......................................................................................................7
1.6 Testing the Possible Differences in Net Takings in the Two Shops................................8
1.7 Customer Satisfaction......................................................................................................9
1.8 Quality Procedures.........................................................................................................10
1.9 Conclusions & Important Findings................................................................................10
References................................................................................................................................12
Appendix..................................................................................................................................14
⊘ This is a preview!⊘
Do you want full access?
Subscribe today to unlock all pages.
Trusted by 1+ million students worldwide
3
Analysing Data for Problem Solving
Introduction
Technology is becoming a part of human life, as with the help of it humans are
upgrading themselves. It can be smart phone or laptop or a tablet. Mobile phone has become
a part of day to day life of people and as it gaining its popularity even it upgrades itself as
from being a communication device now it also helps in navigation (Kwon et al. 2013). It
even helps people to know what happening around the world and even let them save their
personal memory, it helps the person in case of emergency so it can be clearly said that it
become an integral part of people.
1. Analysis of Issues for Eco-Fone Smartphones
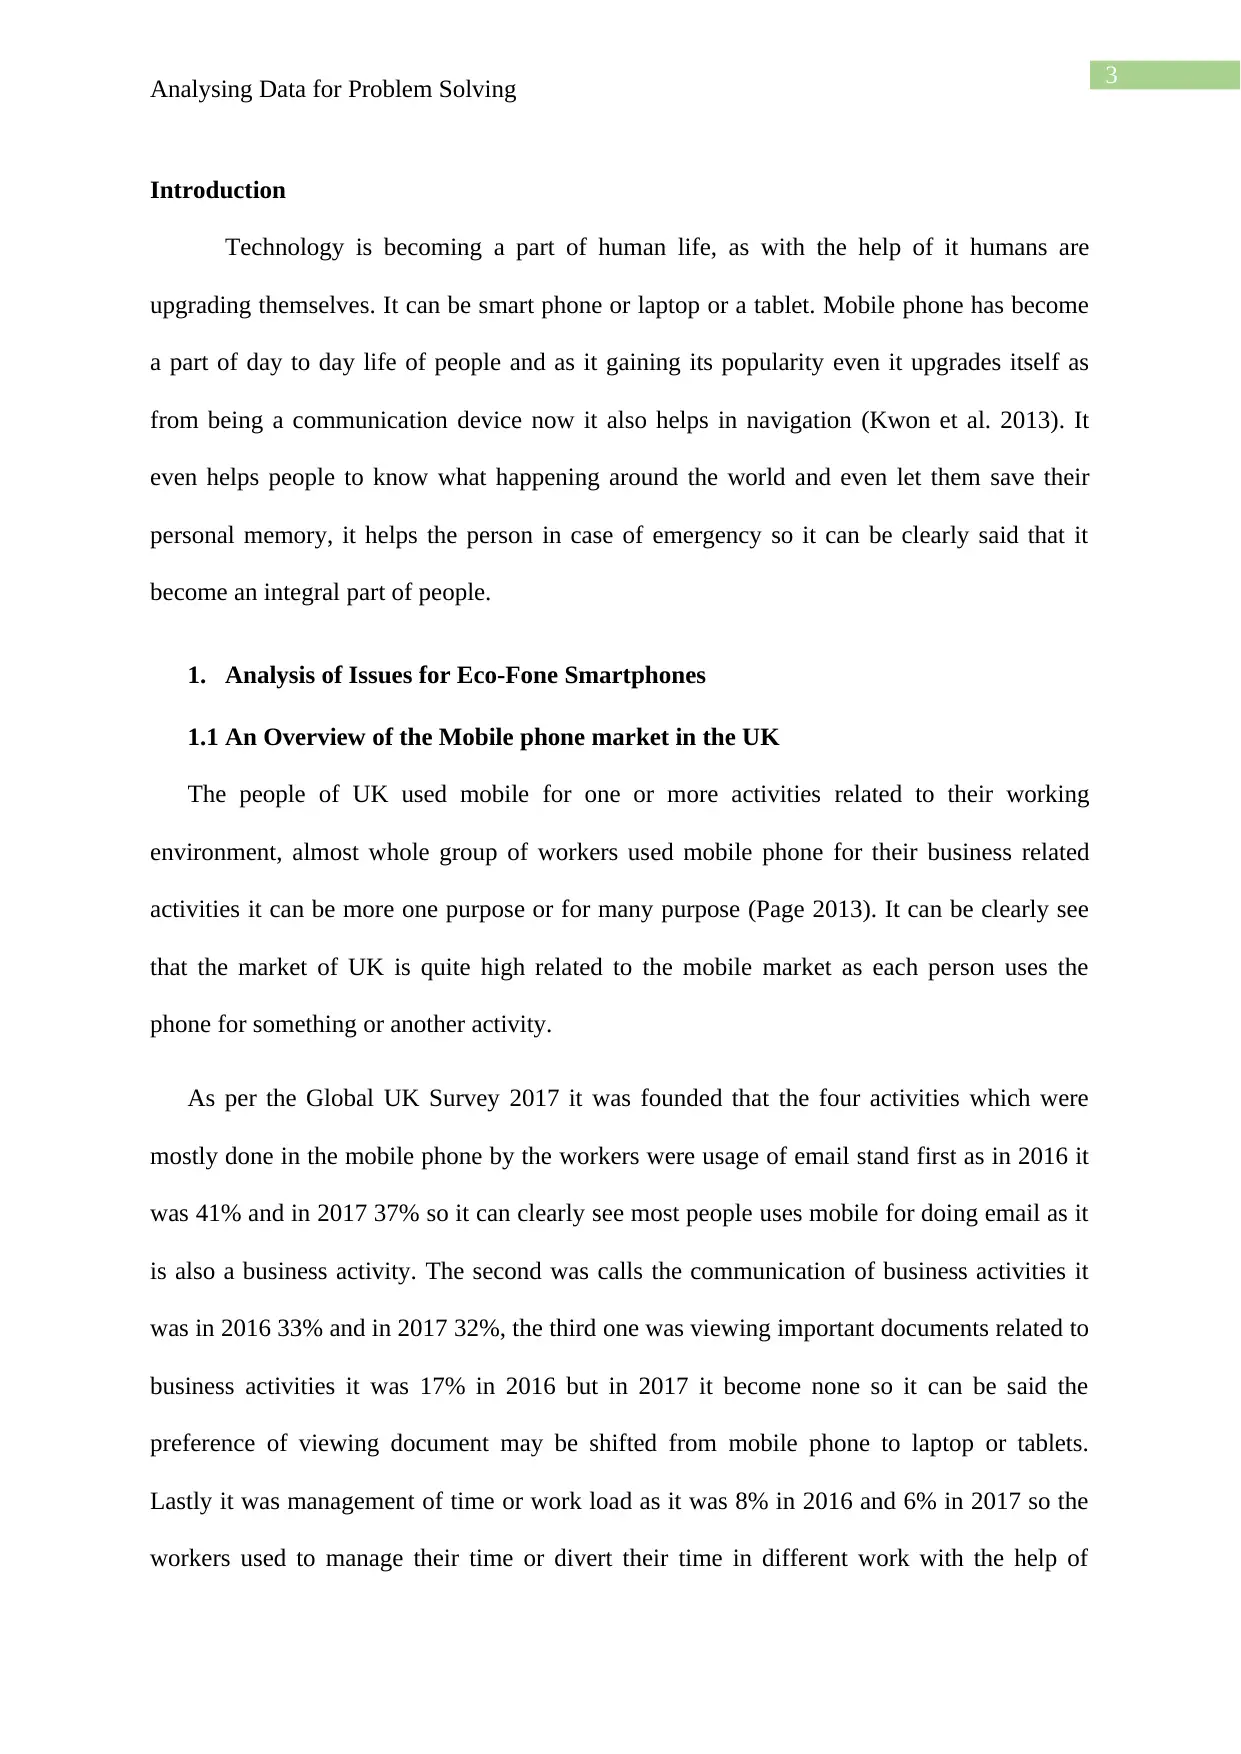
1.1 An Overview of the Mobile phone market in the UK
The people of UK used mobile for one or more activities related to their working
environment, almost whole group of workers used mobile phone for their business related
activities it can be more one purpose or for many purpose (Page 2013). It can be clearly see
that the market of UK is quite high related to the mobile market as each person uses the
phone for something or another activity.
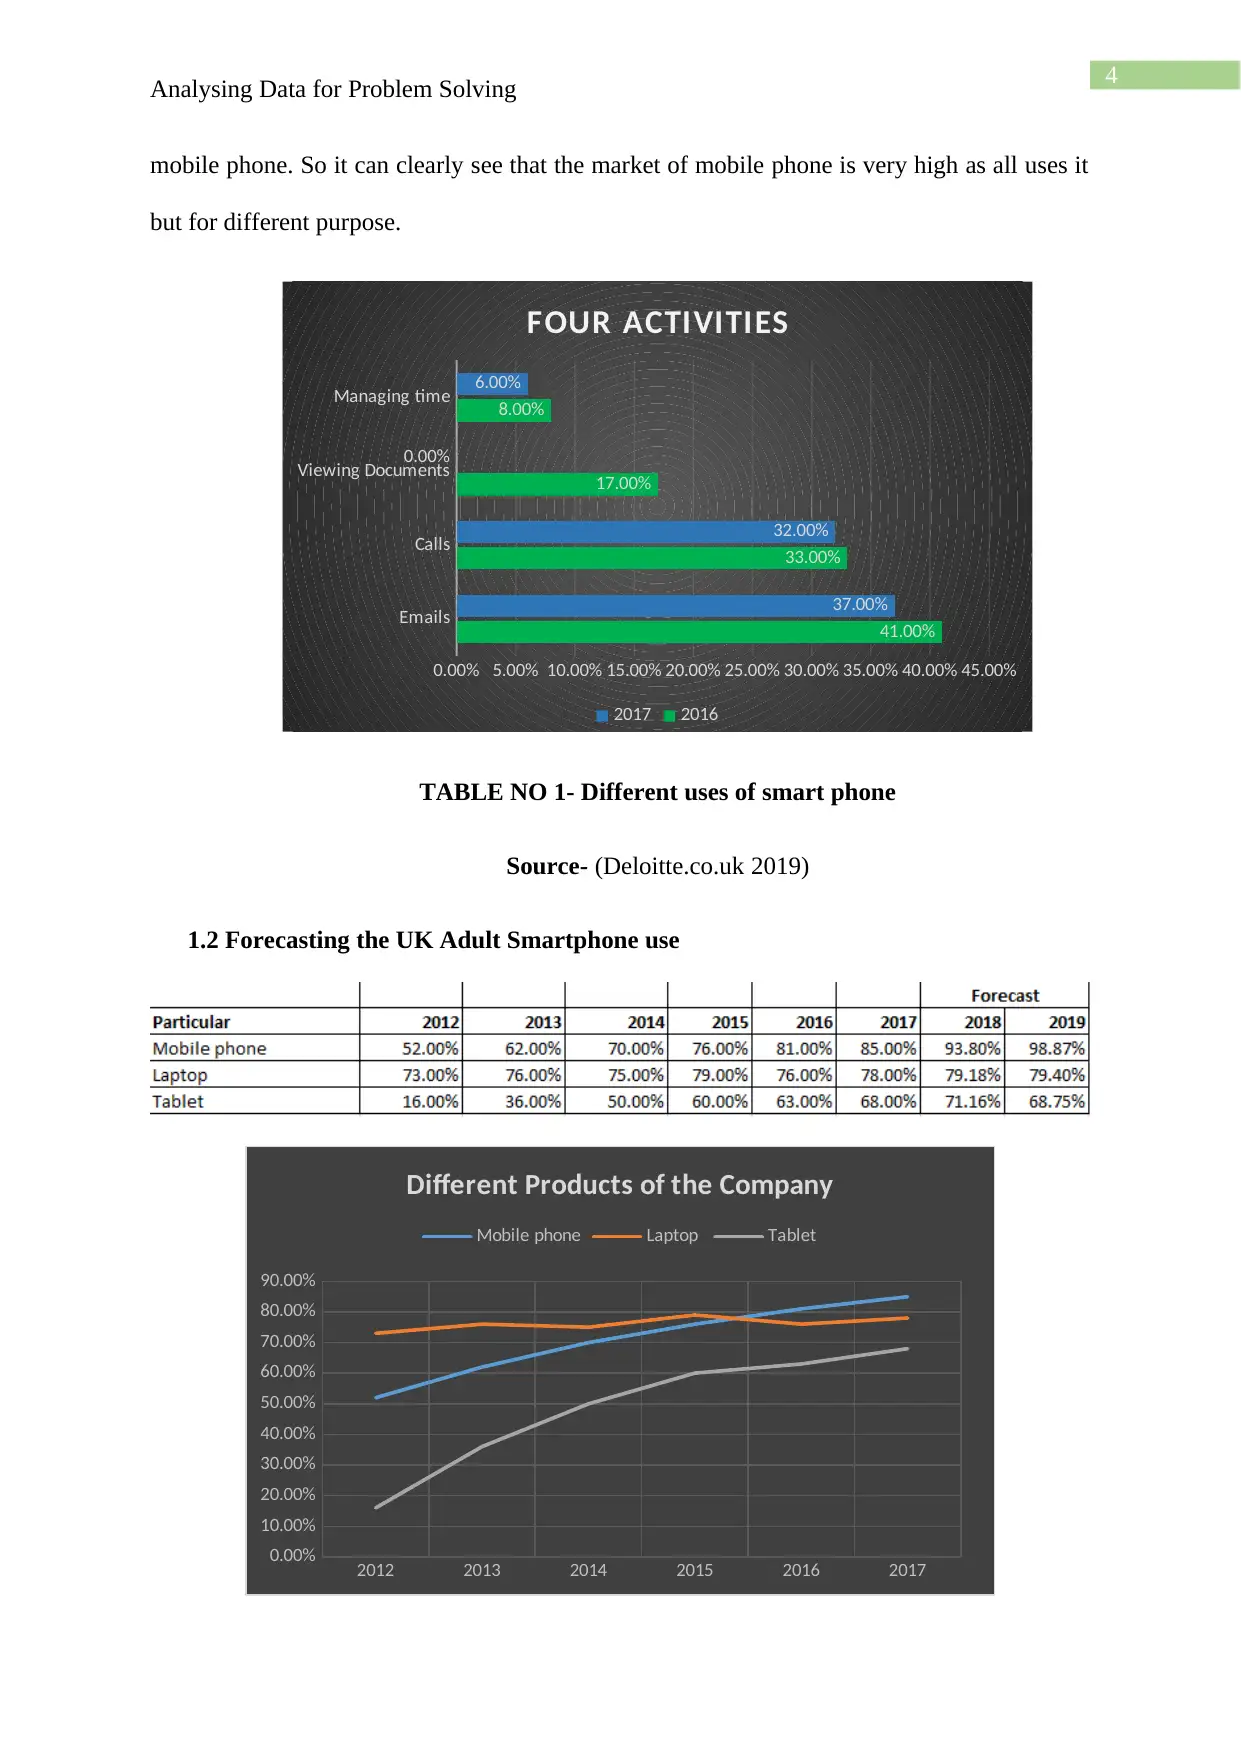
As per the Global UK Survey 2017 it was founded that the four activities which were
mostly done in the mobile phone by the workers were usage of email stand first as in 2016 it
was 41% and in 2017 37% so it can clearly see most people uses mobile for doing email as it
is also a business activity. The second was calls the communication of business activities it
was in 2016 33% and in 2017 32%, the third one was viewing important documents related to
business activities it was 17% in 2016 but in 2017 it become none so it can be said the
preference of viewing document may be shifted from mobile phone to laptop or tablets.
Lastly it was management of time or work load as it was 8% in 2016 and 6% in 2017 so the
workers used to manage their time or divert their time in different work with the help of
Analysing Data for Problem Solving
Introduction
Technology is becoming a part of human life, as with the help of it humans are
upgrading themselves. It can be smart phone or laptop or a tablet. Mobile phone has become
a part of day to day life of people and as it gaining its popularity even it upgrades itself as
from being a communication device now it also helps in navigation (Kwon et al. 2013). It
even helps people to know what happening around the world and even let them save their
personal memory, it helps the person in case of emergency so it can be clearly said that it
become an integral part of people.
1. Analysis of Issues for Eco-Fone Smartphones
1.1 An Overview of the Mobile phone market in the UK
The people of UK used mobile for one or more activities related to their working
environment, almost whole group of workers used mobile phone for their business related
activities it can be more one purpose or for many purpose (Page 2013). It can be clearly see
that the market of UK is quite high related to the mobile market as each person uses the
phone for something or another activity.
As per the Global UK Survey 2017 it was founded that the four activities which were
mostly done in the mobile phone by the workers were usage of email stand first as in 2016 it
was 41% and in 2017 37% so it can clearly see most people uses mobile for doing email as it
is also a business activity. The second was calls the communication of business activities it
was in 2016 33% and in 2017 32%, the third one was viewing important documents related to
business activities it was 17% in 2016 but in 2017 it become none so it can be said the
preference of viewing document may be shifted from mobile phone to laptop or tablets.
Lastly it was management of time or work load as it was 8% in 2016 and 6% in 2017 so the
workers used to manage their time or divert their time in different work with the help of
Paraphrase This Document
Need a fresh take? Get an instant paraphrase of this document with our AI Paraphraser
4
Analysing Data for Problem Solving
mobile phone. So it can clearly see that the market of mobile phone is very high as all uses it
but for different purpose.
Emails
Calls
Viewing Documents
Managing time
0.00% 5.00% 10.00% 15.00% 20.00% 25.00% 30.00% 35.00% 40.00% 45.00%
41.00%
33.00%
17.00%
8.00%
37.00%
32.00%
0.00%
6.00%
FOUR ACTIVITIES
2017 2016
TABLE NO 1- Different uses of smart phone
Source- (Deloitte.co.uk 2019)
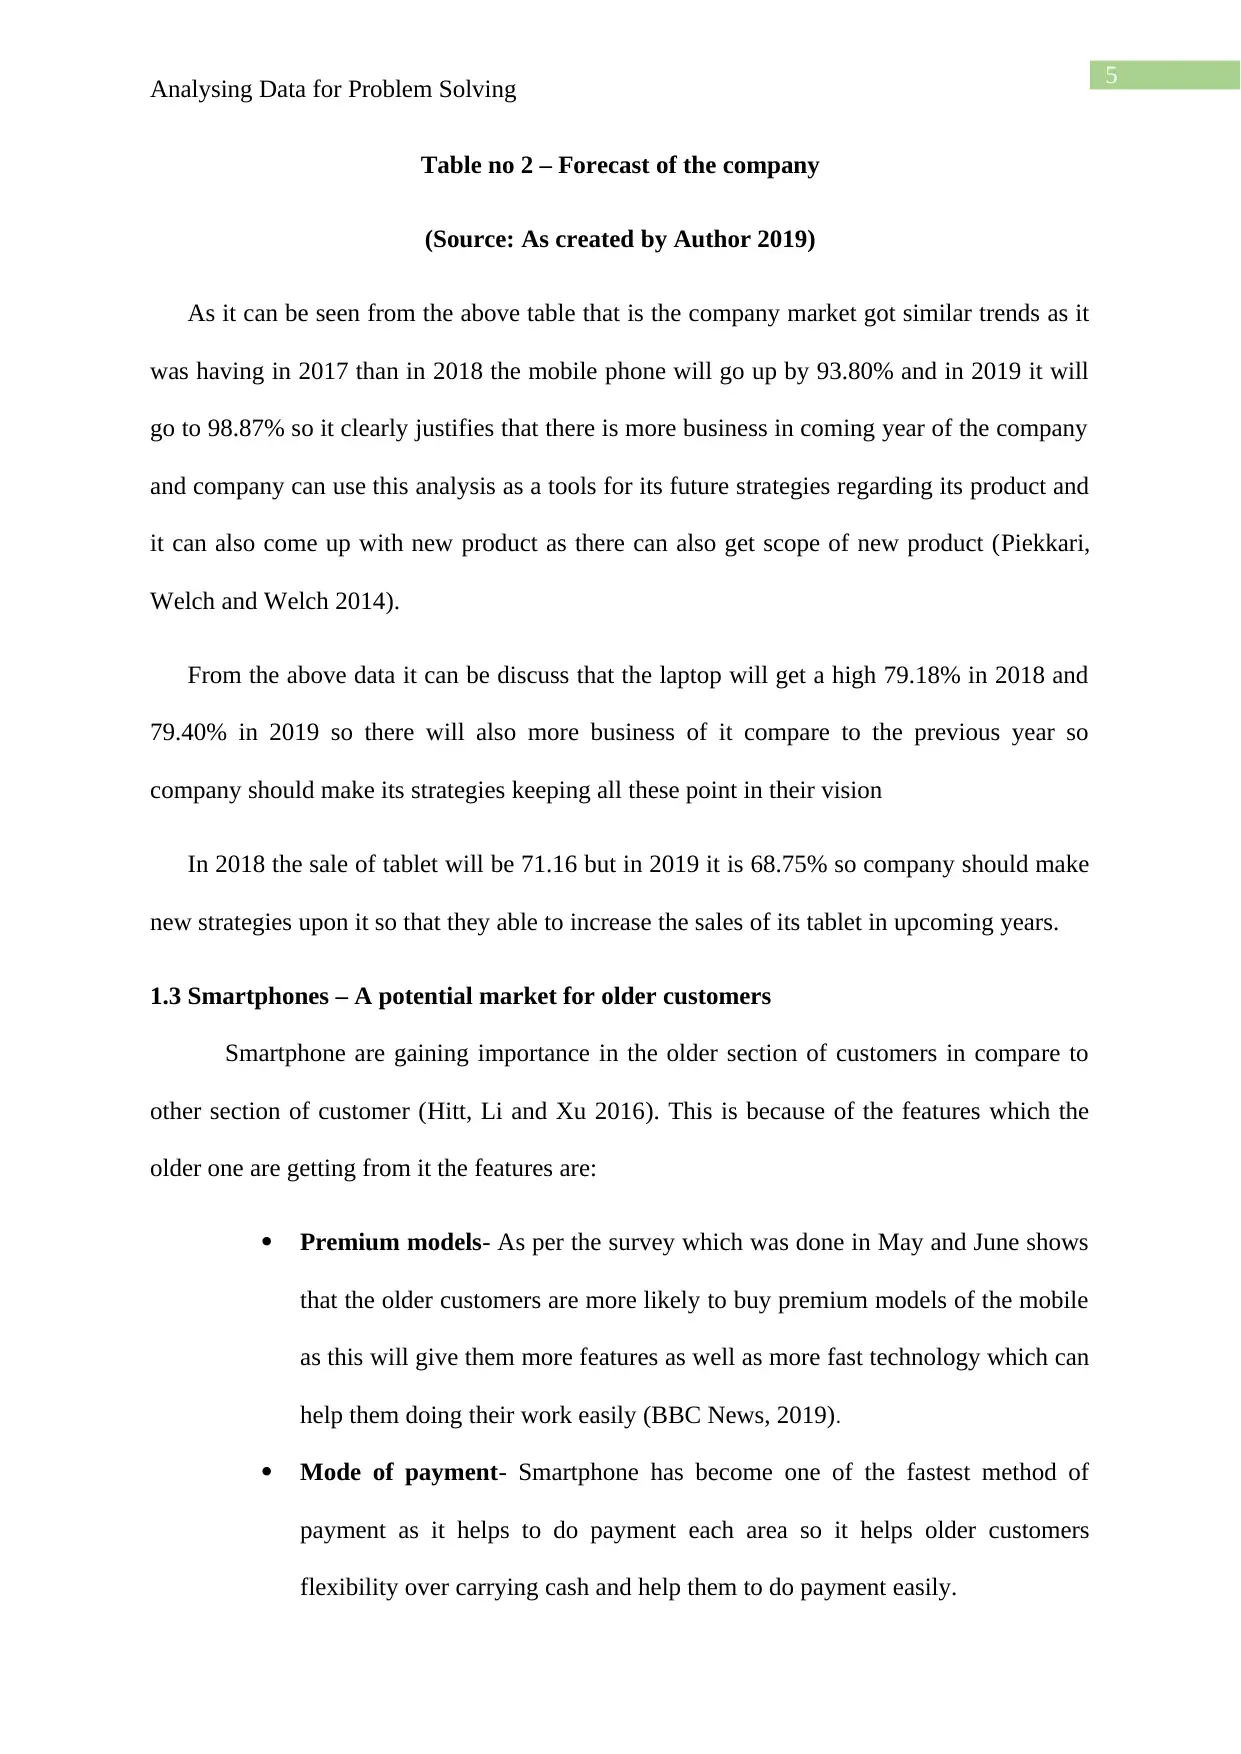
1.2 Forecasting the UK Adult Smartphone use
2012 2013 2014 2015 2016 2017
0.00%
10.00%
20.00%
30.00%
40.00%
50.00%
60.00%
70.00%
80.00%
90.00%
Different Products of the Company
Mobile phone Laptop Tablet
Analysing Data for Problem Solving
mobile phone. So it can clearly see that the market of mobile phone is very high as all uses it
but for different purpose.
Emails
Calls
Viewing Documents
Managing time
0.00% 5.00% 10.00% 15.00% 20.00% 25.00% 30.00% 35.00% 40.00% 45.00%
41.00%
33.00%
17.00%
8.00%
37.00%
32.00%
0.00%
6.00%
FOUR ACTIVITIES
2017 2016
TABLE NO 1- Different uses of smart phone
Source- (Deloitte.co.uk 2019)
1.2 Forecasting the UK Adult Smartphone use
2012 2013 2014 2015 2016 2017
0.00%
10.00%
20.00%
30.00%
40.00%
50.00%
60.00%
70.00%
80.00%
90.00%
Different Products of the Company
Mobile phone Laptop Tablet
5
Analysing Data for Problem Solving
Table no 2 – Forecast of the company
(Source: As created by Author 2019)
As it can be seen from the above table that is the company market got similar trends as it
was having in 2017 than in 2018 the mobile phone will go up by 93.80% and in 2019 it will
go to 98.87% so it clearly justifies that there is more business in coming year of the company
and company can use this analysis as a tools for its future strategies regarding its product and
it can also come up with new product as there can also get scope of new product (Piekkari,
Welch and Welch 2014).
From the above data it can be discuss that the laptop will get a high 79.18% in 2018 and
79.40% in 2019 so there will also more business of it compare to the previous year so
company should make its strategies keeping all these point in their vision
In 2018 the sale of tablet will be 71.16 but in 2019 it is 68.75% so company should make
new strategies upon it so that they able to increase the sales of its tablet in upcoming years.
1.3 Smartphones – A potential market for older customers
Smartphone are gaining importance in the older section of customers in compare to
other section of customer (Hitt, Li and Xu 2016). This is because of the features which the
older one are getting from it the features are:
Premium models- As per the survey which was done in May and June shows
that the older customers are more likely to buy premium models of the mobile
as this will give them more features as well as more fast technology which can
help them doing their work easily (BBC News, 2019).
Mode of payment- Smartphone has become one of the fastest method of
payment as it helps to do payment each area so it helps older customers
flexibility over carrying cash and help them to do payment easily.
⊘ This is a preview!⊘
Do you want full access?
Subscribe today to unlock all pages.
Trusted by 1+ million students worldwide
6
Analysing Data for Problem Solving
Helps in traveling- As the older group have difficulty in traveling so the
mobile application helps the customers to book a cap for their personal
purpose and easily available of cab is there so it helps them to travel without
having any problem (Doyle 2015).
Screen size – Modern mobile phone screen is usually big so it helps the older
section of customers to check their phone as their eyes are not so well so the
size screen helps them to use their mobile phone more easily.
Flexibility of usage – The usage of mobile phone is becoming simple day by
day so any one can use so it helps the older section to use the application very
easily and effectively.
Security – The smart phone has becoming more security concern, it now even
has face recognition and password protect so these help the customers to keep
their personal data protected.
1.4 Feasibility of expanding business to Kingston using Pros and Cons table
PROS Rating
out of
10
Cons Rating
out of
10
Attract new customers as this will
able generate more revenue for the
company.
9 Huge capital requirement is
needed for expansion of the
business which can result in an
economic slum to the company.
8
This will help the company to
diversify their cost of business
into more segments as a result of
8 Expansion can diversify the
expertise of the company which
can result in lack of proper
9
Paraphrase This Document
Need a fresh take? Get an instant paraphrase of this document with our AI Paraphraser
7
Analysing Data for Problem Solving
it will able to reduce it total cost
of the business.
utilization of the resources which
the company has and can
increase the cost of the company.
This will able to increase their
brand value as a whole as it will
get into a new market so it will
able to make a new goodwill of
the company (Staykova and
Damsgaard 2015).
7 Market cannot be obtain by the
company it can result in a big
failure of the company and can
lose its current position in the
market.
7
New products and new changes
can be made in the existing
product as new customers will
help the company to know more
about the product and how the
company can make improvement
in it.
8 Decline in the brand value of the
company if they unable to satisfy
the needs of the customers it can
affect the name of the company
and as result of it can hamper the
goodwill of the company.
6
Average Pros =(9+8+7+8)/4 8 Average Cons = (8+9+7+6)/4 7.5
1.5 Cost of new Building
The monthly cost of the new building will be €3146 as company have to pay it for
next 15 years. Company can raise its funds by any of the UK mortgage company and whom
interest is comparatively low can be selected by the company as per their need of the amount
and repayment method of the company (Reynolds and Yetton 2015). The calculation of the
monthly income has been shown in the appendix of the report where it can been show the
cost has been calculated.
8
Analysing Data for Problem Solving
The eight logo of well-known commercial mortgage lenders in the UK are
1.6 Testing the Possible Differences in Net Takings in the Two Shops
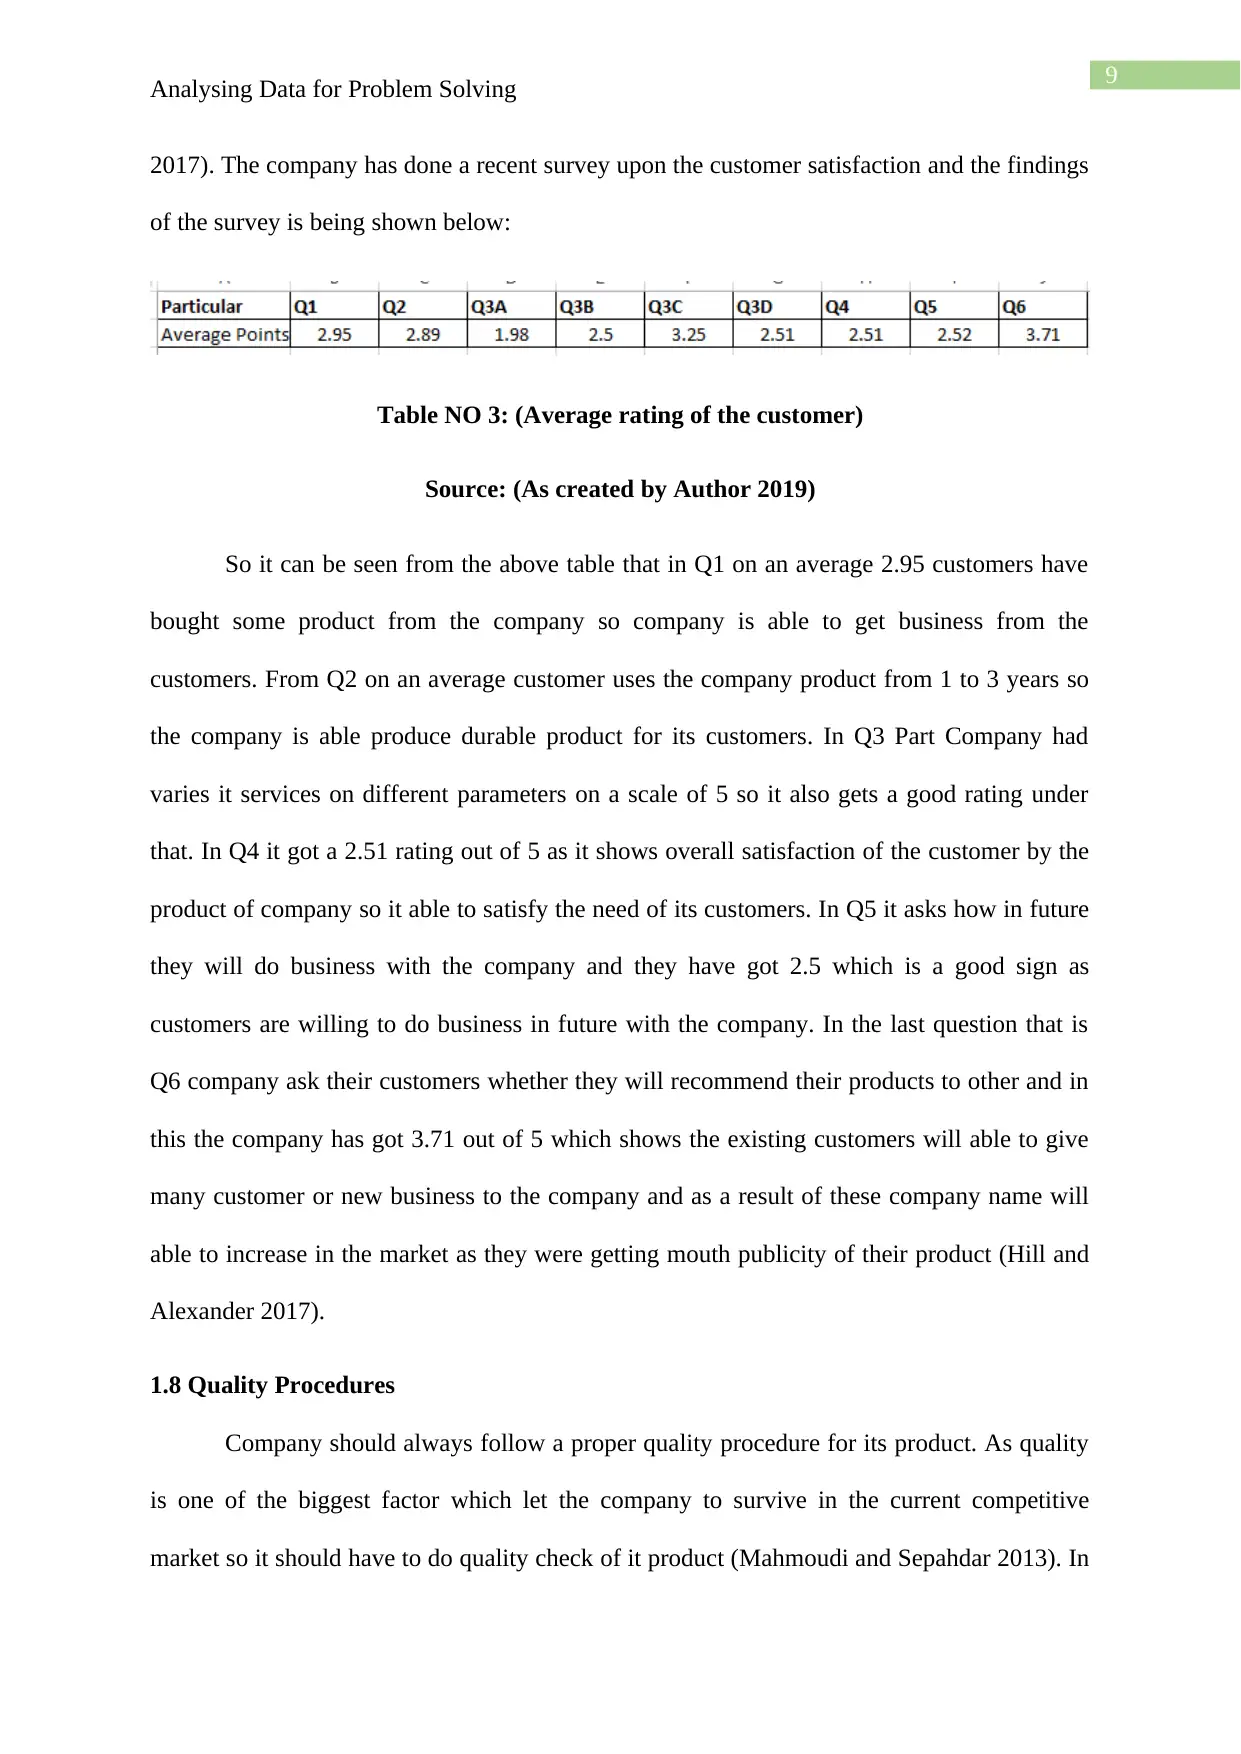
The mean here defines the average profit which the company is earning from its
business (Jiang, Beamish and Makino 2014). As it can be seen from that the company has
taken 40 daily undertaking of its two shop the mean of first shop is €100 so it can be say that
the company is earning an average of €100 so the total earning was €4000 where as in the
second shop the mean is €90 so it is earning €90 of per product an total of €3600 it has earn
by selling 40 undertaking so by mean comparison it can said the first shop is earning on an
average of €10 compare to the second shop. The profit can be increased in terms of second
shop as the profit per unit is high in first shop which is not high in the second shop.
The standard deviation denotes here the variability of the income of the company
(Wan et al. 2014). As each day company varies on different customers so it shows an average
40 undertaking average. The first shop standard deviation is €20 which show the company
income varies a huge where as the standard deviation of second shop is €40 it shows
company varies a little but not much. If a comparison been done than the second shop get
more customers in compare to first shop (Visconti et al. 2015). So the customers go to the
second shop more frequently compare to the first shop so it can gain more sale in compare to
first shop.
1.7 Customer Satisfaction
Company check their customer satisfaction with the help of questionnaires which is
made in hard copy and is available in both of the shops of the company (Hill and Brierley
Analysing Data for Problem Solving
The eight logo of well-known commercial mortgage lenders in the UK are
1.6 Testing the Possible Differences in Net Takings in the Two Shops
The mean here defines the average profit which the company is earning from its
business (Jiang, Beamish and Makino 2014). As it can be seen from that the company has
taken 40 daily undertaking of its two shop the mean of first shop is €100 so it can be say that
the company is earning an average of €100 so the total earning was €4000 where as in the
second shop the mean is €90 so it is earning €90 of per product an total of €3600 it has earn
by selling 40 undertaking so by mean comparison it can said the first shop is earning on an
average of €10 compare to the second shop. The profit can be increased in terms of second
shop as the profit per unit is high in first shop which is not high in the second shop.
The standard deviation denotes here the variability of the income of the company
(Wan et al. 2014). As each day company varies on different customers so it shows an average
40 undertaking average. The first shop standard deviation is €20 which show the company
income varies a huge where as the standard deviation of second shop is €40 it shows
company varies a little but not much. If a comparison been done than the second shop get
more customers in compare to first shop (Visconti et al. 2015). So the customers go to the
second shop more frequently compare to the first shop so it can gain more sale in compare to
first shop.
1.7 Customer Satisfaction
Company check their customer satisfaction with the help of questionnaires which is
made in hard copy and is available in both of the shops of the company (Hill and Brierley
⊘ This is a preview!⊘
Do you want full access?
Subscribe today to unlock all pages.
Trusted by 1+ million students worldwide
9
Analysing Data for Problem Solving
2017). The company has done a recent survey upon the customer satisfaction and the findings
of the survey is being shown below:
Table NO 3: (Average rating of the customer)
Source: (As created by Author 2019)
So it can be seen from the above table that in Q1 on an average 2.95 customers have
bought some product from the company so company is able to get business from the
customers. From Q2 on an average customer uses the company product from 1 to 3 years so
the company is able produce durable product for its customers. In Q3 Part Company had
varies it services on different parameters on a scale of 5 so it also gets a good rating under
that. In Q4 it got a 2.51 rating out of 5 as it shows overall satisfaction of the customer by the
product of company so it able to satisfy the need of its customers. In Q5 it asks how in future
they will do business with the company and they have got 2.5 which is a good sign as
customers are willing to do business in future with the company. In the last question that is
Q6 company ask their customers whether they will recommend their products to other and in
this the company has got 3.71 out of 5 which shows the existing customers will able to give
many customer or new business to the company and as a result of these company name will
able to increase in the market as they were getting mouth publicity of their product (Hill and
Alexander 2017).
1.8 Quality Procedures
Company should always follow a proper quality procedure for its product. As quality
is one of the biggest factor which let the company to survive in the current competitive
market so it should have to do quality check of it product (Mahmoudi and Sepahdar 2013). In
Paraphrase This Document
Need a fresh take? Get an instant paraphrase of this document with our AI Paraphraser
10
Analysing Data for Problem Solving
the given case the company uses Poisson distribution as its quality procedure. Poisson
distribution is one of tools which help to know the probability of a certain events which are
happing in same interval of time or in different interval of time (Hong 2013). It helps the
company to get a sample of its product.
It has been used in the company the product is maintain in same interval of time so it
easy for the company to know about the quality of its product and the company is able to
meets it quality check its getting 2 out of 10000 where as in normal it should get 3 so it able
to minimize its wastage and able to give a proper quality to its product.
1.9 Conclusions & Important Findings
The above discussion has been concluded as the market of UK is very good for
smartphones as there are many users regarding it. So the company can hold more share in the
market. The above report is being made on the company name Eco-Fone which is one of the
smartphone company and has two shops of it. The reports show how the company should
expand their business in Kingston what are the pros and cons related to its expansion and how
they should manage the investment of the new plant which they want to get in expansion in
Kingston should take in lease or should purchase it.
The findings which was founded in the report is that the company should maintain
their quality of its product and should have a proper procedure regarding it. An analysis of
customer satisfaction is being done which was based upon a questionnaire and its show
different parameters of the company regarding its customer satisfaction procedure. The
company also founded out the difference of mean and standard deviation of its two shop and
it got its first shop is earning more profit where is the customers are coming more in second
shop.
11
Analysing Data for Problem Solving
References
BBC News (2019). Smartphone sales boom with over-55s. [online] BBC News. Available at:
https://www.bbc.co.uk/news/technology-41319684 [Accessed 23 Mar. 2019].
Deloitte.co.uk, (2019). [ebook] Available at:
https://www.deloitte.co.uk/mobileuk/assets/img/download/global-mobile-consumer-survey-
2017_uk-cut.pdf) [Accessed 23 Mar. 2019].
Doyle, G., 2015. Brands in international and multi-platform expansion strategies: Economic
and management issues. In Handbook of Media Branding (pp. 53-64). Springer, Cham.
Hill, N. and Alexander, J., 2017. The handbook of customer satisfaction and loyalty
measurement. Routledge.
Hill, N. and Brierley, J., 2017. How to measure customer satisfaction. Routledge.
Hitt, M.A., Li, D. and Xu, K., 2016. International strategy: From local to global and
beyond. Journal of World Business, 51(1), pp.58-73.
Hong, Y., 2013. On computing the distribution function for the Poisson binomial
distribution. Computational Statistics & Data Analysis, 59, pp.41-51.
Jiang, R.J., Beamish, P.W. and Makino, S., 2014. Time compression diseconomies in foreign
expansion. Journal of World Business, 49(1), pp.114-121.
Kwon, M., Lee, J.Y., Won, W.Y., Park, J.W., Min, J.A., Hahn, C., Gu, X., Choi, J.H. and
Kim, D.J., 2013. Development and validation of a smartphone addiction scale (SAS). PloS
one, 8(2), p.e56936.
Mahmoudi, E. and Sepahdar, A., 2013. Exponentiated Weibull–Poisson distribution: Model,
properties and applications. Mathematics and computers in simulation, 92, pp.76-97.
⊘ This is a preview!⊘
Do you want full access?
Subscribe today to unlock all pages.
Trusted by 1+ million students worldwide
1 out of 14
Related Documents


Your All-in-One AI-Powered Toolkit for Academic Success.
+13062052269
info@desklib.com
Available 24*7 on WhatsApp / Email
![[object Object]](/_next/static/media/star-bottom.7253800d.svg)
Unlock your academic potential
Copyright © 2020–2026 A2Z Services. All Rights Reserved. Developed and managed by ZUCOL.