Analysing Eco-Fone's Performance and Expansion: A Business Report
VerifiedAdded on 2022/11/25
|14
|2818
|139
Report
AI Summary
This report analyzes Eco-Fone, a smartphone company operating in the UK, addressing various aspects of its business. It begins with an overview of the UK mobile phone market, highlighting usage trends and forecasting smartphone adoption among adults for 2018 and 2019. The report then examines smartphone sales among older customers, discussing relevant features and payment methods. A pros and cons analysis evaluates the potential expansion of the business to Kingston. The report also includes financial analysis, such as the cost of a new building and net takings from two shops, along with customer satisfaction data. Quality procedures using Poisson distribution are also discussed. The report concludes with key findings and recommendations based on the analysis of Eco-Fone's business operations and market position. The assignment is prepared for the Business School, University of Roehampton.
Running head: ANALYSING INFORMATION AND DATA ANALYSIS
Analysing Information and Data Analysis
Name of the Student:
Name of the University:
Author Note:
Analysing Information and Data Analysis
Name of the Student:
Name of the University:
Author Note:
Paraphrase This Document
Need a fresh take? Get an instant paraphrase of this document with our AI Paraphraser
1ANALYSING INFORMATION AND DATA ANALYSIS
Table of Contents
Introduction................................................................................................................................3
1. An overview of the mobile phone market in the UK.........................................................3
2. Forecasting the use of smartphones by the UK adults for 2018 and 2019.........................4
3. Smartphone sales, market for older customers..................................................................5
4. Expanding business to Kingston through pros and cons method.......................................6
5. Cost for the new building...................................................................................................7
6. Net takings of the two shops’.............................................................................................8
8. Quality Procedures.............................................................................................................9
10. Conclusions & Important Findings...............................................................................10
Reference..................................................................................................................................11
Appendices...............................................................................................................................13
2ANALYSING INFORMATION AND DATA ANALYSIS
Introduction
Technology has been upgraded tremendously in the last few decades. Technology has
improved the day to day life of humans being an endless source of communication and
entertainment. The technology can be the mobile phone, laptop and tablet. Now a days
mobile phones has become an integral part of humans. As, the device is upgraded and
majorly used for communication as well as it helps in navigation. This can schedule the
meetings, it brings all the news around the world in the hands of user and can help to collect
public information.
1. An overview of the mobile phone market in the UK
Most commonly used device in UK is mobile phone. They use the device in the
activities that are related to their working environment. People used smartphones in business
activities like managing time, marketing standard calls and emails. This is observed that the
UK market is highly relatable to the market of mobile phones as almost everyone uses the
phone in an activity either related to the business or not related to the business.
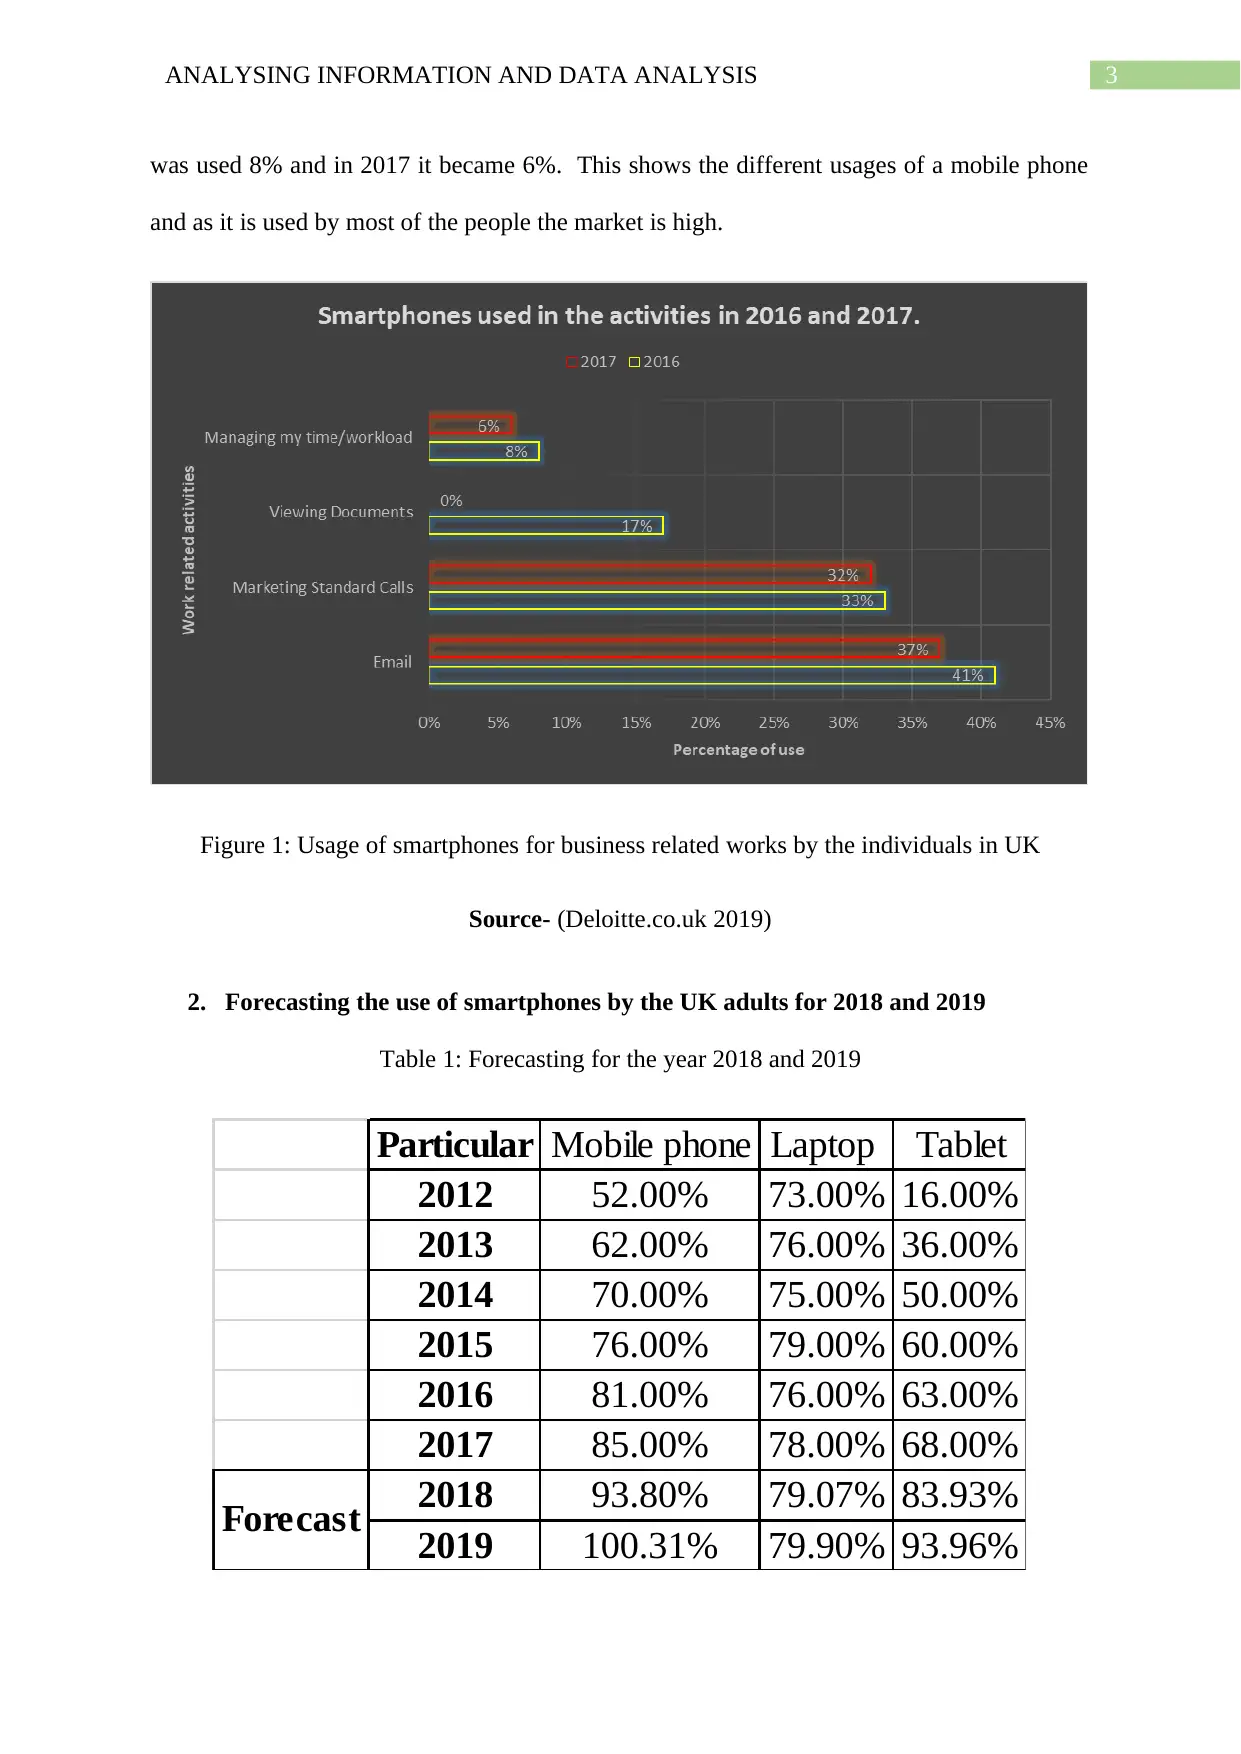
According to the Global UK survey 2017, it has been observed that the activities
mostly done with the help of mobile phone are managing my time/workload, viewing
documents, calls and emails. People mostly use the phone to make emails as a business
activity and the data shows that mobile is used 41% just for mails in 2016 and it was 37% in
2017. The second highest use of mobile phone in business activity is calls. This is found that
the phone is used 33% for calls in 2016 and 32%% in 2017. Thus the third highest use of
mobile phone is viewing documents associated with the business activity. The mobile is used
17% for viewing documents in 2016. However, in 2017 the mobile was not in use to view
documents that means people started using alternatives for viewing document. Finally,
managing time related to business activity is done by the mobile phones. In 2016, the phone
Introduction
Technology has been upgraded tremendously in the last few decades. Technology has
improved the day to day life of humans being an endless source of communication and
entertainment. The technology can be the mobile phone, laptop and tablet. Now a days
mobile phones has become an integral part of humans. As, the device is upgraded and
majorly used for communication as well as it helps in navigation. This can schedule the
meetings, it brings all the news around the world in the hands of user and can help to collect
public information.
1. An overview of the mobile phone market in the UK
Most commonly used device in UK is mobile phone. They use the device in the
activities that are related to their working environment. People used smartphones in business
activities like managing time, marketing standard calls and emails. This is observed that the
UK market is highly relatable to the market of mobile phones as almost everyone uses the
phone in an activity either related to the business or not related to the business.
According to the Global UK survey 2017, it has been observed that the activities
mostly done with the help of mobile phone are managing my time/workload, viewing
documents, calls and emails. People mostly use the phone to make emails as a business
activity and the data shows that mobile is used 41% just for mails in 2016 and it was 37% in
2017. The second highest use of mobile phone in business activity is calls. This is found that
the phone is used 33% for calls in 2016 and 32%% in 2017. Thus the third highest use of
mobile phone is viewing documents associated with the business activity. The mobile is used
17% for viewing documents in 2016. However, in 2017 the mobile was not in use to view
documents that means people started using alternatives for viewing document. Finally,
managing time related to business activity is done by the mobile phones. In 2016, the phone
⊘ This is a preview!⊘
Do you want full access?
Subscribe today to unlock all pages.
Trusted by 1+ million students worldwide
3ANALYSING INFORMATION AND DATA ANALYSIS
was used 8% and in 2017 it became 6%. This shows the different usages of a mobile phone
and as it is used by most of the people the market is high.
Figure 1: Usage of smartphones for business related works by the individuals in UK
Source- (Deloitte.co.uk 2019)
2. Forecasting the use of smartphones by the UK adults for 2018 and 2019
Table 1: Forecasting for the year 2018 and 2019
Particular Mobile phone Laptop Tablet
2012 52.00% 73.00% 16.00%
2013 62.00% 76.00% 36.00%
2014 70.00% 75.00% 50.00%
2015 76.00% 79.00% 60.00%
2016 81.00% 76.00% 63.00%
2017 85.00% 78.00% 68.00%
2018 93.80% 79.07% 83.93%
2019 100.31% 79.90% 93.96%
Forecast
Paraphrase This Document
Need a fresh take? Get an instant paraphrase of this document with our AI Paraphraser
4ANALYSING INFORMATION AND DATA ANALYSIS
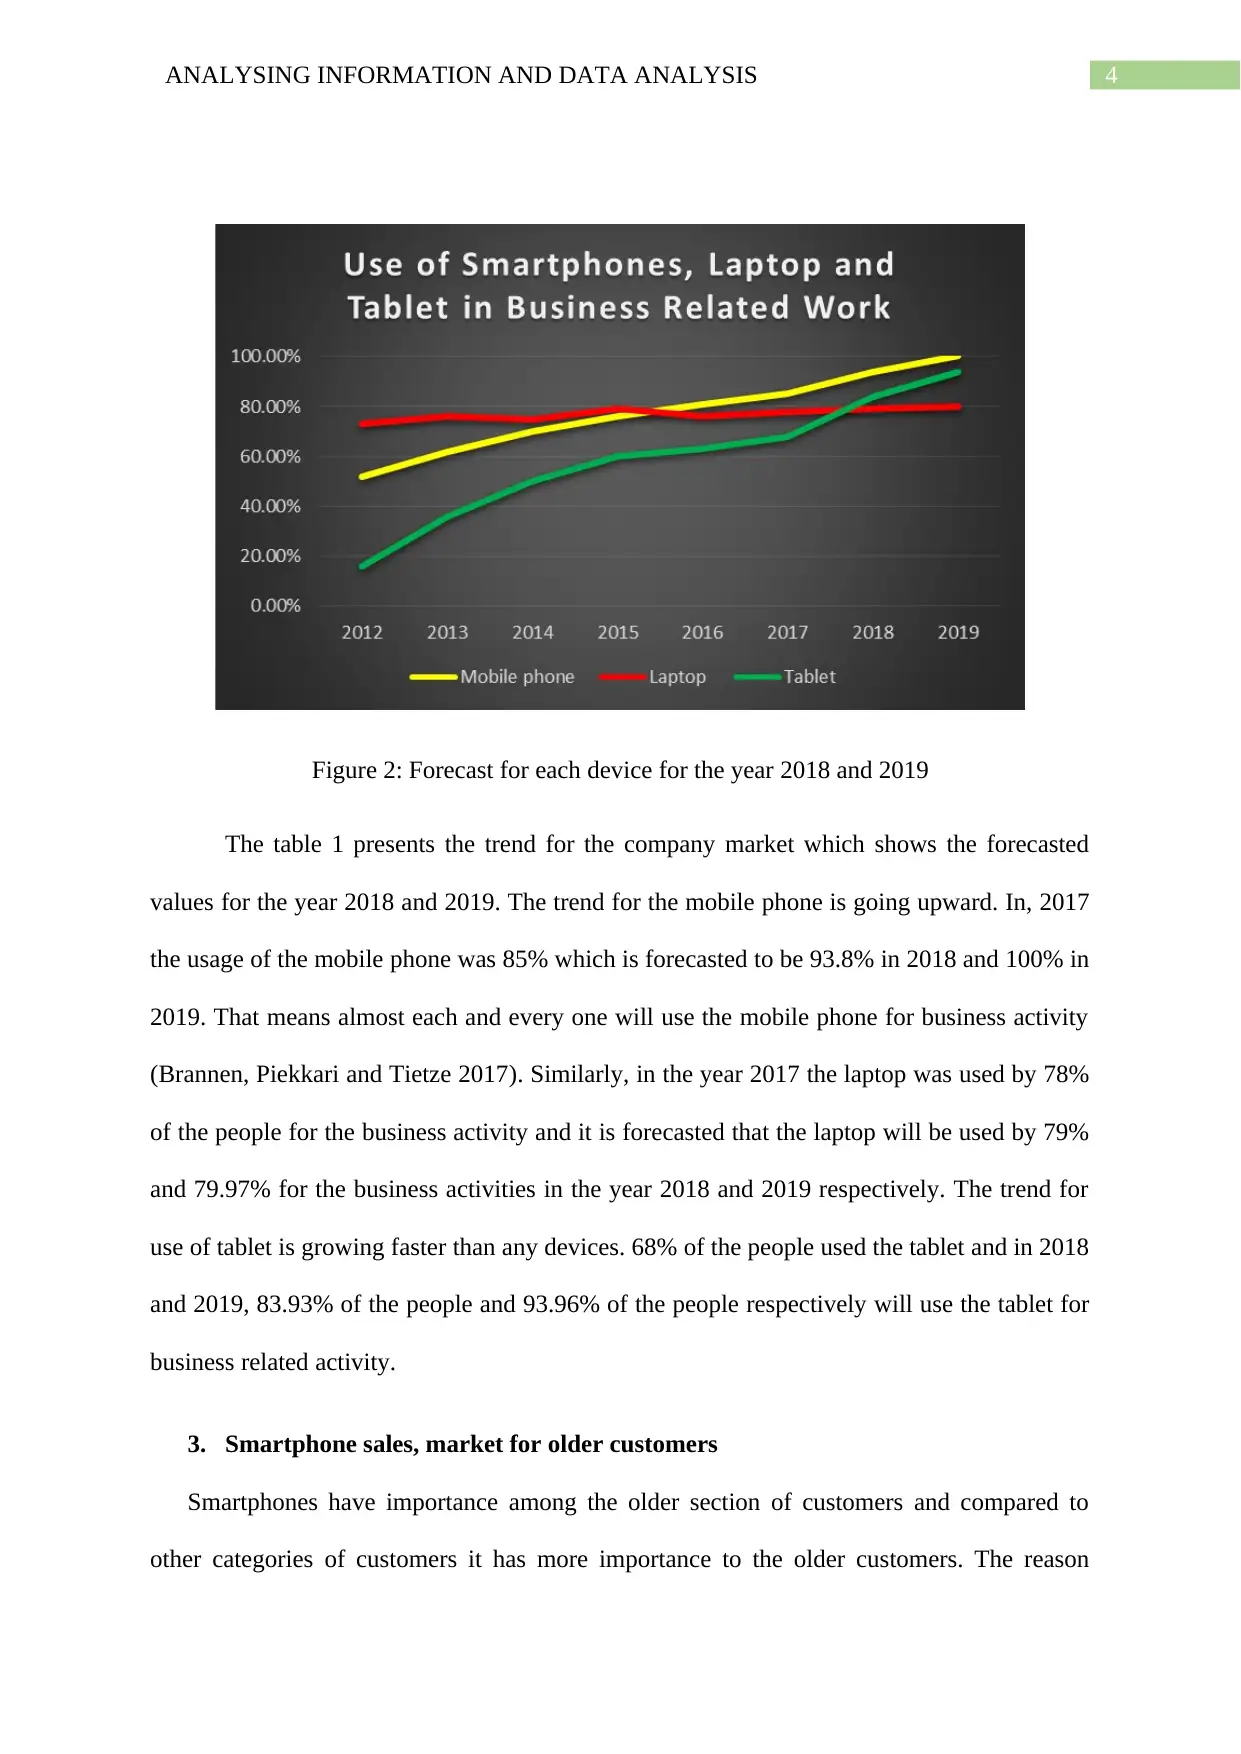
Figure 2: Forecast for each device for the year 2018 and 2019
The table 1 presents the trend for the company market which shows the forecasted
values for the year 2018 and 2019. The trend for the mobile phone is going upward. In, 2017
the usage of the mobile phone was 85% which is forecasted to be 93.8% in 2018 and 100% in
2019. That means almost each and every one will use the mobile phone for business activity
(Brannen, Piekkari and Tietze 2017). Similarly, in the year 2017 the laptop was used by 78%
of the people for the business activity and it is forecasted that the laptop will be used by 79%
and 79.97% for the business activities in the year 2018 and 2019 respectively. The trend for
use of tablet is growing faster than any devices. 68% of the people used the tablet and in 2018
and 2019, 83.93% of the people and 93.96% of the people respectively will use the tablet for
business related activity.
3. Smartphone sales, market for older customers
Smartphones have importance among the older section of customers and compared to
other categories of customers it has more importance to the older customers. The reason
5ANALYSING INFORMATION AND DATA ANALYSIS
behind the incident is the feature of the mobile phones to the older customers (Knight and
Liesch 2016). Some of the features are discussed below:
Version of the phone: According to the survey of May and June presents that the older
customers prefers the premium version of the phone compared to other versions. This is
because of the extra features available in the premium version and the faster technology
which can help the customers in their activities (BBC News, 2019).
Payment Mode: Smartphones are easy to use for making digital payments which is the
fastest mode of payment. Thus mobile phones provides the flexibility over cash payments and
help to make easy payments.
Travel Guide: Mobile phone is easy to use to book a cab while it is very difficult to find
a cab and bargain for the destination for the older group of people.
Screen Size: Latest mobile phones have large screen and it is very helpful to the older
people to read. The large screen displays large fonts and clear pictures. This is crucial feature
for the people who have problems in eyes.
Flexible to use: The upgraded mobile phones are now very easy to use. The developers
has made the phone simple to use for everyone. This makes easy to use the applications
installed in the phone.
Secured System: The smart phones are much secured with face lock, pattern lock and
touch lock. This all security systems are to protect the personal data of the customer.
4. Expanding business to Kingston through pros and cons method
PROS Rating
out of 10 Cons Rating
out of 10
Attracts new customers and this
have the potential to generate
more profit.
8
Capital requirement is huge
to expand the business for
which the result will be the
transformation from an
9
⊘ This is a preview!⊘
Do you want full access?
Subscribe today to unlock all pages.
Trusted by 1+ million students worldwide
6ANALYSING INFORMATION AND DATA ANALYSIS
economic slum to the
company.
The expansion of the company
can help to diversify the cost of
business to the broader segments
and this will result in the
reduction of the total cost of the
business.
9
The expansion of the
business can significantly
distract the expertise of the
company and this could
cause improper utilisation of
the resources. This will
result in an increase of cost
to the company.
8
The brand value will rise due to
the expansion of the business.
This will happen because the
business will be spread in new
markets and it will make new
goodwill which will add value
into the company (Staykova and
Damsgaard 2015).
8
Entering into the new market
will raise the competition
and there are uncertainties to
get a position in the market.
This may result in a failure
and can lose the current
position too.
6
This will lead the company to
introduce new products and
changes in existing products to
attract the new customers. This
will have a positive impact on
the business.
7
If, the changes in the
products and newly
introduced products does not
satisfy the customers then
the band value will fall.
Thus it can have the negative
impact on the good will too.
7
Average Pros =(8+9+8+7)/4 8 Average Cons =
(9+8+6+7)/4 7.5
5. Cost for the new building
The cost to the new building will be £3146 per month for the coming 15 years at 7%
mortgage rate per annum. This will be raised by any UK mortgage company according to the
requirement of the amount and repayment of the company (Coltman et al. 2015). In the
appendix A and B, the formula used to calculate and the result of the calculation is presented
respectively.
The logo of commercial mortgage lenders that are famous in the UK are presented below:
Paraphrase This Document
Need a fresh take? Get an instant paraphrase of this document with our AI Paraphraser
7ANALYSING INFORMATION AND DATA ANALYSIS
6. Net takings of the two shops’
A sample has been taken of 40 net daily takings of the companies two shops. The given
information about the first shop is that the shop has a mean £100 and the SD of £20. This
implies that the average earning is £100 and thus the total earning is £4000. Similarly, the
average earning of the second shop is £90 and thus the total earning is £3600. This earning
has come from selling 40 net daily takings. Hence, by the comparison of the mean this can be
assured that the average earning is £10 higher for the first shop than the second shop.
However, the rise in profit van can be gained from first shop compared to the second shop as
per unit profit is higher in case of first shop.
The variability of the earning is explained by the standard deviation. The earning of the
shops differs due to the variation in the customers. The given standard deviation is £20 for
the first shop and the standard deviation is £40 for the second shop. This implies that the
existing variability in the first shop is less than the second shop. The smaller SD presents
smaller variance and thus the second shop has a large variation in the earrings. From this it
can be predicted that customers goes to the second shop more frequently which creates more
variability for the shop.
7. Customer Satisfaction
Company decided to check the customer satisfaction and to do so questionnaires are
prepared and printed in hard copy. To get the responses from the customers it was made
8ANALYSING INFORMATION AND DATA ANALYSIS
available in both the shops. After collecting the data a simple analysis is done with the mean.
The result is presented below:
Q1 Q2 Q3a Q3b Q3c Q3d Q4 Q5 Q6
Average Points 2.95 2.89 1.98 2.50 3.25 2.51 2.51 2.52 3.71
Table 2: Average rating of the customer
The above table presents the average of rating of customers and each rating is
discussed here. The average rating in Q1 is 2.95. This implies that the same product is bought
by an average of 2.95 customers. Mean of Q2 indicates an average amount of customers who
purchase the products of the company from 1 to 3 years. That is why the company produces
durable goods. The Q3 implies that the company has variation in services and products on the
basis of different parameters. There is good rating on this the average response is around 3.
The average rating is 2.51 in Q4 out of 5. This indicates the satisfaction level as a whole, the
customer’s satisfaction after using the company services and product. In Q5, this wants to
know thww future business perspective. The average rating in Q5 is 2.5 which indicates an
average level of willingness of the customers to be connected with the business in future. In
the final question Q6, Company wants to know about the customers that they will recommend
their products to others or not. In this section, the average rating is recorded as 3.71. This
indicates that customers of the company can recommend new customers that means they can
give customers to the company (Hill and Alexander 2017).
8. Quality Procedures
Poisson distribution has some specific features which is usually used in case of discrete
probability distribution. In this case the distribution of events occurring in a given time period
is discrete. Now, a company always follows a proper quality procedure for its product. Now
⊘ This is a preview!⊘
Do you want full access?
Subscribe today to unlock all pages.
Trusted by 1+ million students worldwide
9ANALYSING INFORMATION AND DATA ANALYSIS
to check the quality the company should tale the passion distribution to collect the samples
for analysis of the quality (Mahmoudi and Sepahdar 2013).
It is used by the company and the product has been maintained in the same time
interval. This makes the process easy to be aware of the quality services and products. Now
the company is aware about the quality check.
10. Conclusions & Important Findings
The UK market is positively supportive for the smartphone due to consumer needs and
demand for the mobile by adults and older that means demand is from each age category. The
report has been prepared on the company named Eco-Fone. Eco-Fone is the smartphone
company among others in UK market and it has two shops on the basis of which the analysis
is prepeared. The report has also presented that how the company is going for expansion of
the business in Kingsotne by using the pros and cons method. The finding of the above
analysis is that the customer satisfaction is done which was done on the basis of questioners
with different parameters. With the help of the statistic mean and standard deviation off both
the shops sales it is found that the rise in profit van can be gained from first shop compared to
the second shop as per unit profit is higher in case of first shop.
Paraphrase This Document
Need a fresh take? Get an instant paraphrase of this document with our AI Paraphraser

10ANALYSING INFORMATION AND DATA ANALYSIS
11ANALYSING INFORMATION AND DATA ANALYSIS
Reference
BBC News (2019). Smartphone sales boom with over-55s. [online] BBC News. Available at:
https://www.bbc.co.uk/news/technology-41319684 [Accessed 23 Mar. 2019]
Bowtell, D.D., Böhm, S., Ahmed, A.A., Aspuria, P.J., Bast Jr, R.C., Beral, V., Berek, J.S.,
Birrer, M.J., Blagden, S., Bookman, M.A. and Brenton, J.D., 2015. Rethinking ovarian
cancer II: reducing mortality from high-grade serous ovarian cancer. Nature reviews Cancer,
15(11), p.668.
Brannen, M.Y., Piekkari, R. and Tietze, S., 2017. The multifaceted role of language in
international business: Unpacking the forms, functions and features of a critical challenge to
MNC theory and performance. In Language in international business (pp. 139-162). Palgrave
Macmillan, Cham.
Coltman, T., Tallon, P., Sharma, R. and Queiroz, M., 2015. Strategic IT alignment: twenty-
five years on.
Deloitte.co.uk, (2019). [ebook] Available at:
https://www.deloitte.co.uk/mobileuk/assets/img/download/global-mobile-consumer-survey-
2017_uk-cut.pdf) [Accessed 23 Mar. 2019].
Gannamaneni, A., Ondrus, J. and Lyytinen, K., 2015, January. A post-failure analysis of
mobile payment platforms. In 2015 48th Hawaii International Conference on System
Sciences (pp. 1159-1168). IEEE.
Gannamaneni, A., Ondrus, J. and Lyytinen, K., 2015, January. A post-failure analysis of
mobile payment platforms. In 2015 48th Hawaii International Conference on System
Sciences (pp. 1159-1168). IEEE.
⊘ This is a preview!⊘
Do you want full access?
Subscribe today to unlock all pages.
Trusted by 1+ million students worldwide
1 out of 14
Related Documents


Your All-in-One AI-Powered Toolkit for Academic Success.
+13062052269
info@desklib.com
Available 24*7 on WhatsApp / Email
![[object Object]](/_next/static/media/star-bottom.7253800d.svg)
Unlock your academic potential
Copyright © 2020–2026 A2Z Services. All Rights Reserved. Developed and managed by ZUCOL.