Eco-Fone Case Study: Market Analysis, Expansion, and Financials
VerifiedAdded on 2021/01/13
|12
|2293
|117
Case Study
AI Summary
This case study examines Eco-Fone, a smartphone retailer, and its operations within the UK market. The report analyzes the mobile phone market, including smartphone usage trends among different age groups and the features that drive their popularity. It prepares a line chart to represent UK adult smartphone usage from 2012-2017 and evaluates the pros and cons of expanding the business to Kingston. The study also includes financial calculations related to a mortgage and assesses the net takings of two shops using Z-score assessment. Furthermore, it justifies the use of the Poisson distribution for the firm and presents key findings and conclusions regarding market trends and expansion strategies. The analysis provides valuable insights into market dynamics and business decision-making for Eco-Fone.

Case study
Paraphrase This Document
Need a fresh take? Get an instant paraphrase of this document with our AI Paraphraser
Table of Contents
INTRODUCTION...........................................................................................................................1
TASK 1............................................................................................................................................1
Overview of mobile phone market.........................................................................................1
TASK 2............................................................................................................................................2
Preparing an appropriate line chart.........................................................................................2
TASK 3............................................................................................................................................3
Features which make smartphone so popular.........................................................................3
TASK 4............................................................................................................................................3
Pros and cons of expansion....................................................................................................3
TASK 5............................................................................................................................................4
Calculation..............................................................................................................................4
TASK 6............................................................................................................................................5
Presenting the findings...........................................................................................................5
TASK 7............................................................................................................................................6
TASK 8............................................................................................................................................7
TASK 9- REFERENCES.................................................................................................................7
TASK 10..........................................................................................................................................8
Findings..................................................................................................................................8
CONCLUSION................................................................................................................................9

⊘ This is a preview!⊘
Do you want full access?
Subscribe today to unlock all pages.
Trusted by 1+ million students worldwide
INTRODUCTION
The report is based upon the case study of Eco-Fone which sells smartphones and
different accessories from its two shops and in every year the net profit also raises from year
after year. The report is also helps to understand the mobile phone market in UK and by using
appropriate line chart the report also represent UK adult smartphone in 2012-2017. Further it
identify many features which make the smartphone so popular with older customers and then
shows the pros and cons of expansion. Moreover, report also explain why a poisson distribution
is an appropriate for the quoted firm and then describe the findings as well.
TASK 1
Overview of mobile phone market
In UK, there are around 33.5 million people and out of them 32 million of people are in
work. As per the research, over half of the respondents says that they all are currently in
employment who used their phones for at least one work that is related to their business as well.
It has been analysed that these smartphones are used for emails, voice calls and calender
management because it makes easy the work for them (Ellis and et.al., 2018). On the other side,
in UK, the people also used little information related to legacy information and reporting system,
even there are some unofficial applications are also available such as instant messages, mobile
browser, navigation, social media. It has been further analysed that around 43% of the people
also use Whatsapp as well at least once for a day and it shows that they all are optimised for
smartphone usage. Apart from this, it has been analysed that only 5% of them are used their
phone for time sheet, 4% of them for submitting their expenses and 6% for access an intranet.
There are many applications which are also introduced every year and the scarcity of
using the smartphone is for work purpose as well. Thus, the UK people that includes millions of
them for whom the smartphone is the ideal information device such that a normal person to
traffic warden, there are a lot of people who uses smartphones and even they do not need a
keyboard (Rosales and Fernández-Ardèvol, 2019). Therefore, smartphone is one of the best
device that is used to gain excess information.
1
Paraphrase This Document
Need a fresh take? Get an instant paraphrase of this document with our AI Paraphraser
TASK 2
Preparing an appropriate line chart
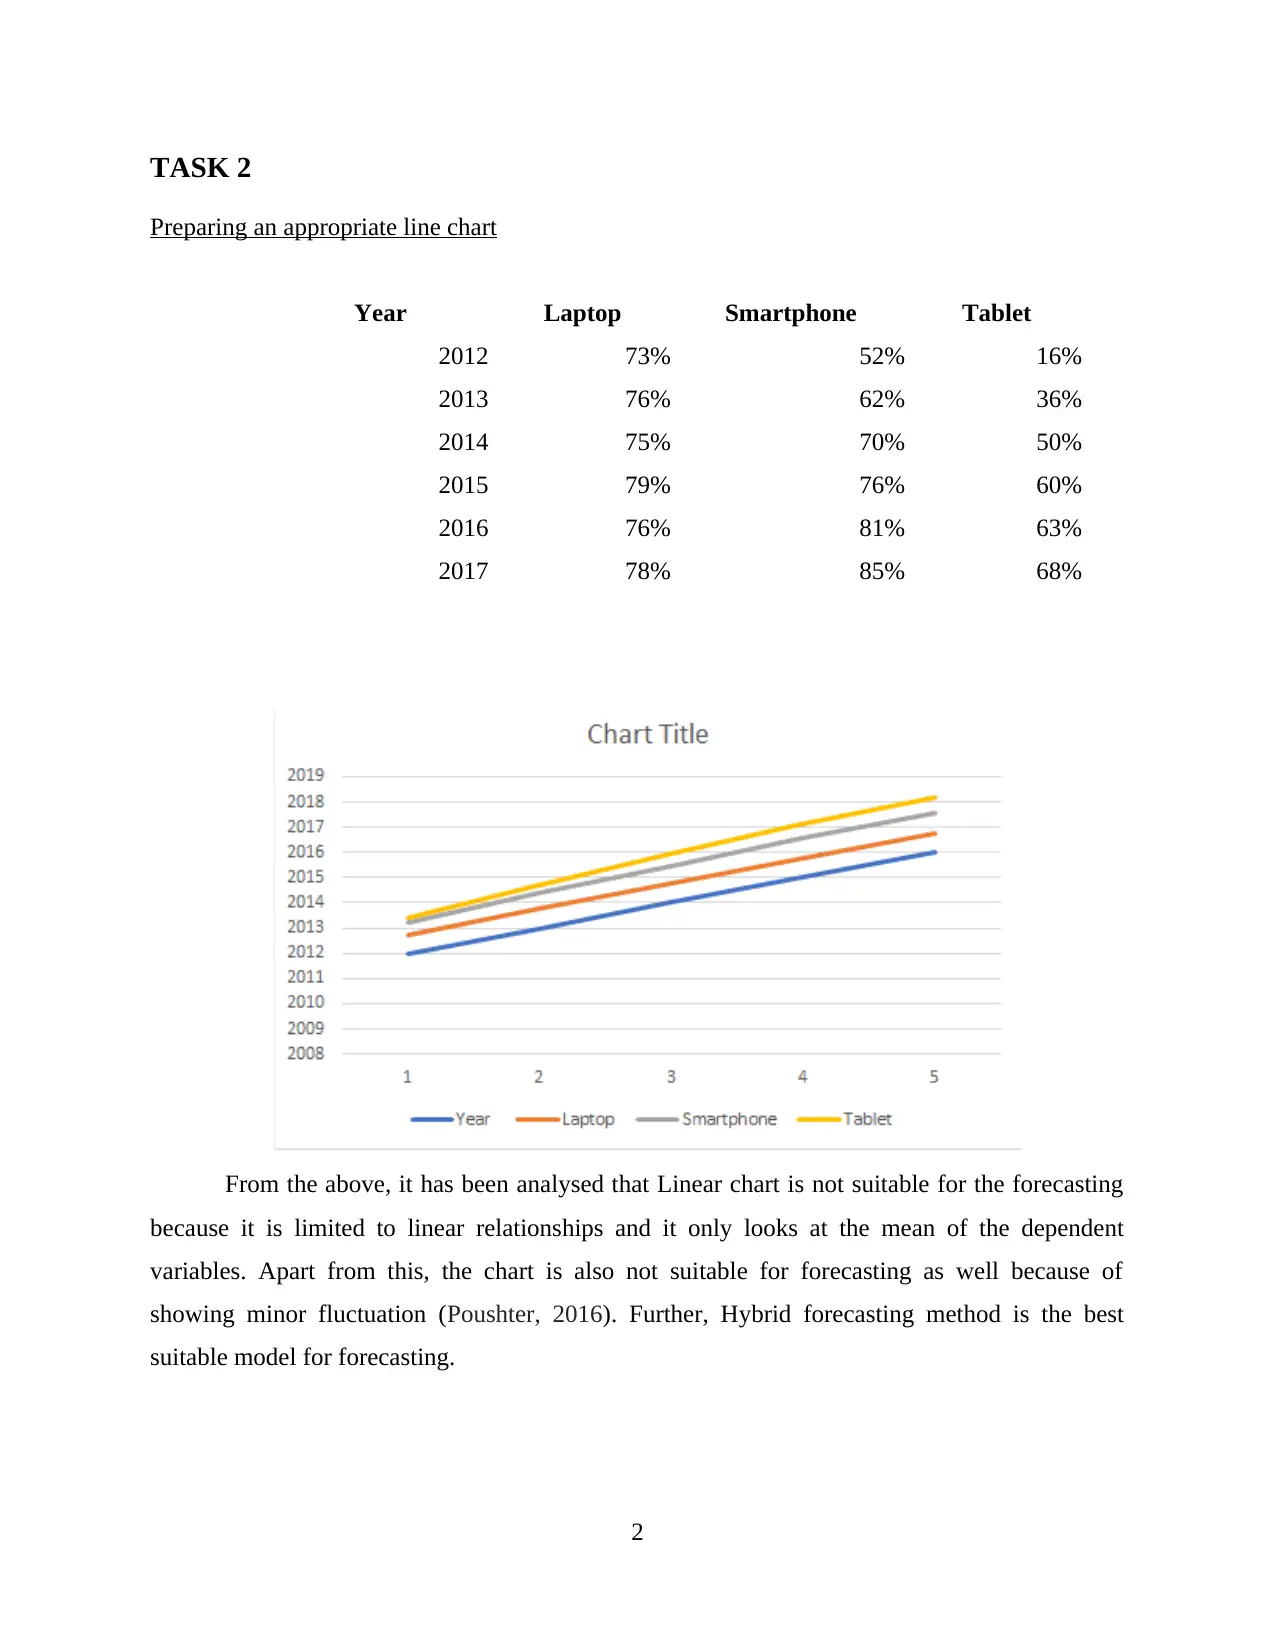
Year Laptop Smartphone Tablet
2012 73% 52% 16%
2013 76% 62% 36%
2014 75% 70% 50%
2015 79% 76% 60%
2016 76% 81% 63%
2017 78% 85% 68%
From the above, it has been analysed that Linear chart is not suitable for the forecasting
because it is limited to linear relationships and it only looks at the mean of the dependent
variables. Apart from this, the chart is also not suitable for forecasting as well because of
showing minor fluctuation (Poushter, 2016). Further, Hybrid forecasting method is the best
suitable model for forecasting.
2
Preparing an appropriate line chart
Year Laptop Smartphone Tablet
2012 73% 52% 16%
2013 76% 62% 36%
2014 75% 70% 50%
2015 79% 76% 60%
2016 76% 81% 63%
2017 78% 85% 68%
From the above, it has been analysed that Linear chart is not suitable for the forecasting
because it is limited to linear relationships and it only looks at the mean of the dependent
variables. Apart from this, the chart is also not suitable for forecasting as well because of
showing minor fluctuation (Poushter, 2016). Further, Hybrid forecasting method is the best
suitable model for forecasting.
2
TASK 3
Features which make smartphone so popular
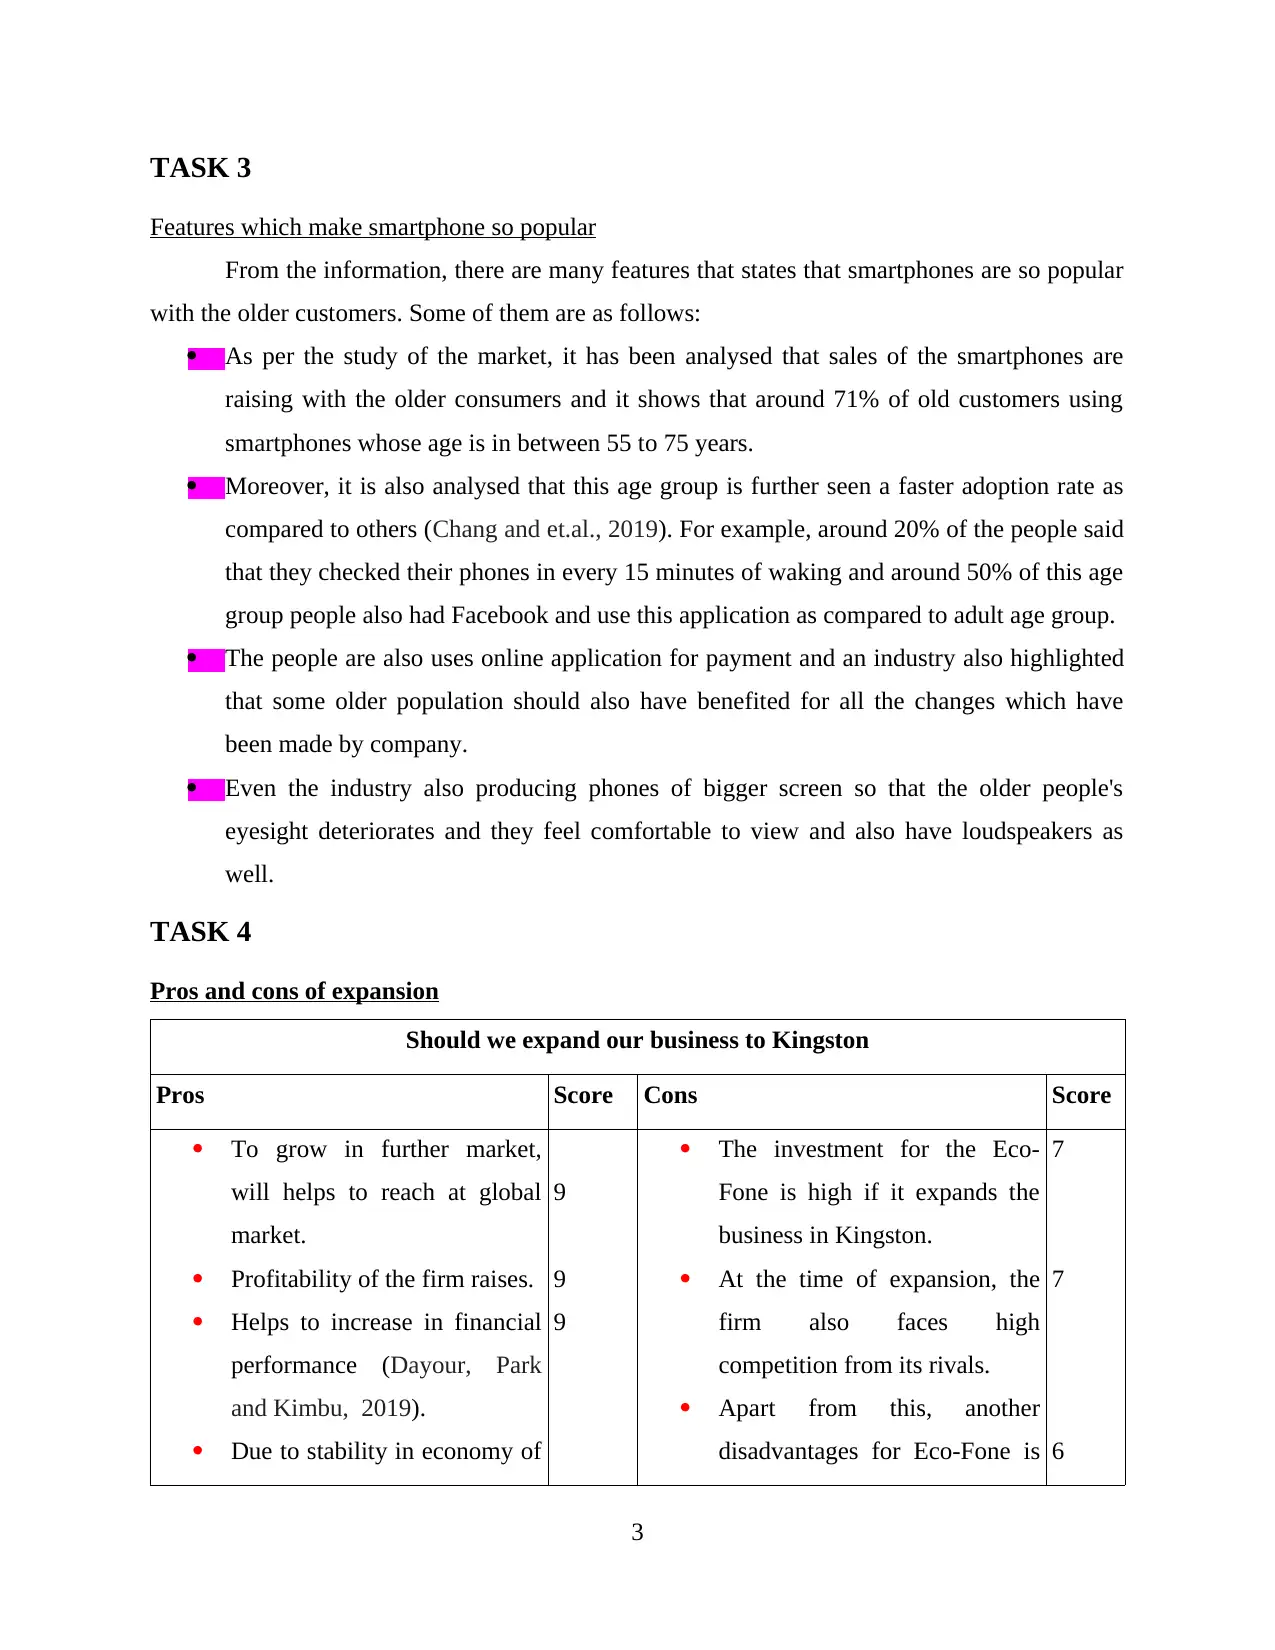
From the information, there are many features that states that smartphones are so popular
with the older customers. Some of them are as follows:
As per the study of the market, it has been analysed that sales of the smartphones are
raising with the older consumers and it shows that around 71% of old customers using
smartphones whose age is in between 55 to 75 years.
Moreover, it is also analysed that this age group is further seen a faster adoption rate as
compared to others (Chang and et.al., 2019). For example, around 20% of the people said
that they checked their phones in every 15 minutes of waking and around 50% of this age
group people also had Facebook and use this application as compared to adult age group.
The people are also uses online application for payment and an industry also highlighted
that some older population should also have benefited for all the changes which have
been made by company.
Even the industry also producing phones of bigger screen so that the older people's
eyesight deteriorates and they feel comfortable to view and also have loudspeakers as
well.
TASK 4
Pros and cons of expansion
Should we expand our business to Kingston
Pros Score Cons Score
To grow in further market,
will helps to reach at global
market.
Profitability of the firm raises.
Helps to increase in financial
performance (Dayour, Park
and Kimbu, 2019).
Due to stability in economy of
9
9
9
The investment for the Eco-
Fone is high if it expands the
business in Kingston.
At the time of expansion, the
firm also faces high
competition from its rivals.
Apart from this, another
disadvantages for Eco-Fone is
7
7
6
3
Features which make smartphone so popular
From the information, there are many features that states that smartphones are so popular
with the older customers. Some of them are as follows:
As per the study of the market, it has been analysed that sales of the smartphones are
raising with the older consumers and it shows that around 71% of old customers using
smartphones whose age is in between 55 to 75 years.
Moreover, it is also analysed that this age group is further seen a faster adoption rate as
compared to others (Chang and et.al., 2019). For example, around 20% of the people said
that they checked their phones in every 15 minutes of waking and around 50% of this age
group people also had Facebook and use this application as compared to adult age group.
The people are also uses online application for payment and an industry also highlighted
that some older population should also have benefited for all the changes which have
been made by company.
Even the industry also producing phones of bigger screen so that the older people's
eyesight deteriorates and they feel comfortable to view and also have loudspeakers as
well.
TASK 4
Pros and cons of expansion
Should we expand our business to Kingston
Pros Score Cons Score
To grow in further market,
will helps to reach at global
market.
Profitability of the firm raises.
Helps to increase in financial
performance (Dayour, Park
and Kimbu, 2019).
Due to stability in economy of
9
9
9
The investment for the Eco-
Fone is high if it expands the
business in Kingston.
At the time of expansion, the
firm also faces high
competition from its rivals.
Apart from this, another
disadvantages for Eco-Fone is
7
7
6
3
⊘ This is a preview!⊘
Do you want full access?
Subscribe today to unlock all pages.
Trusted by 1+ million students worldwide
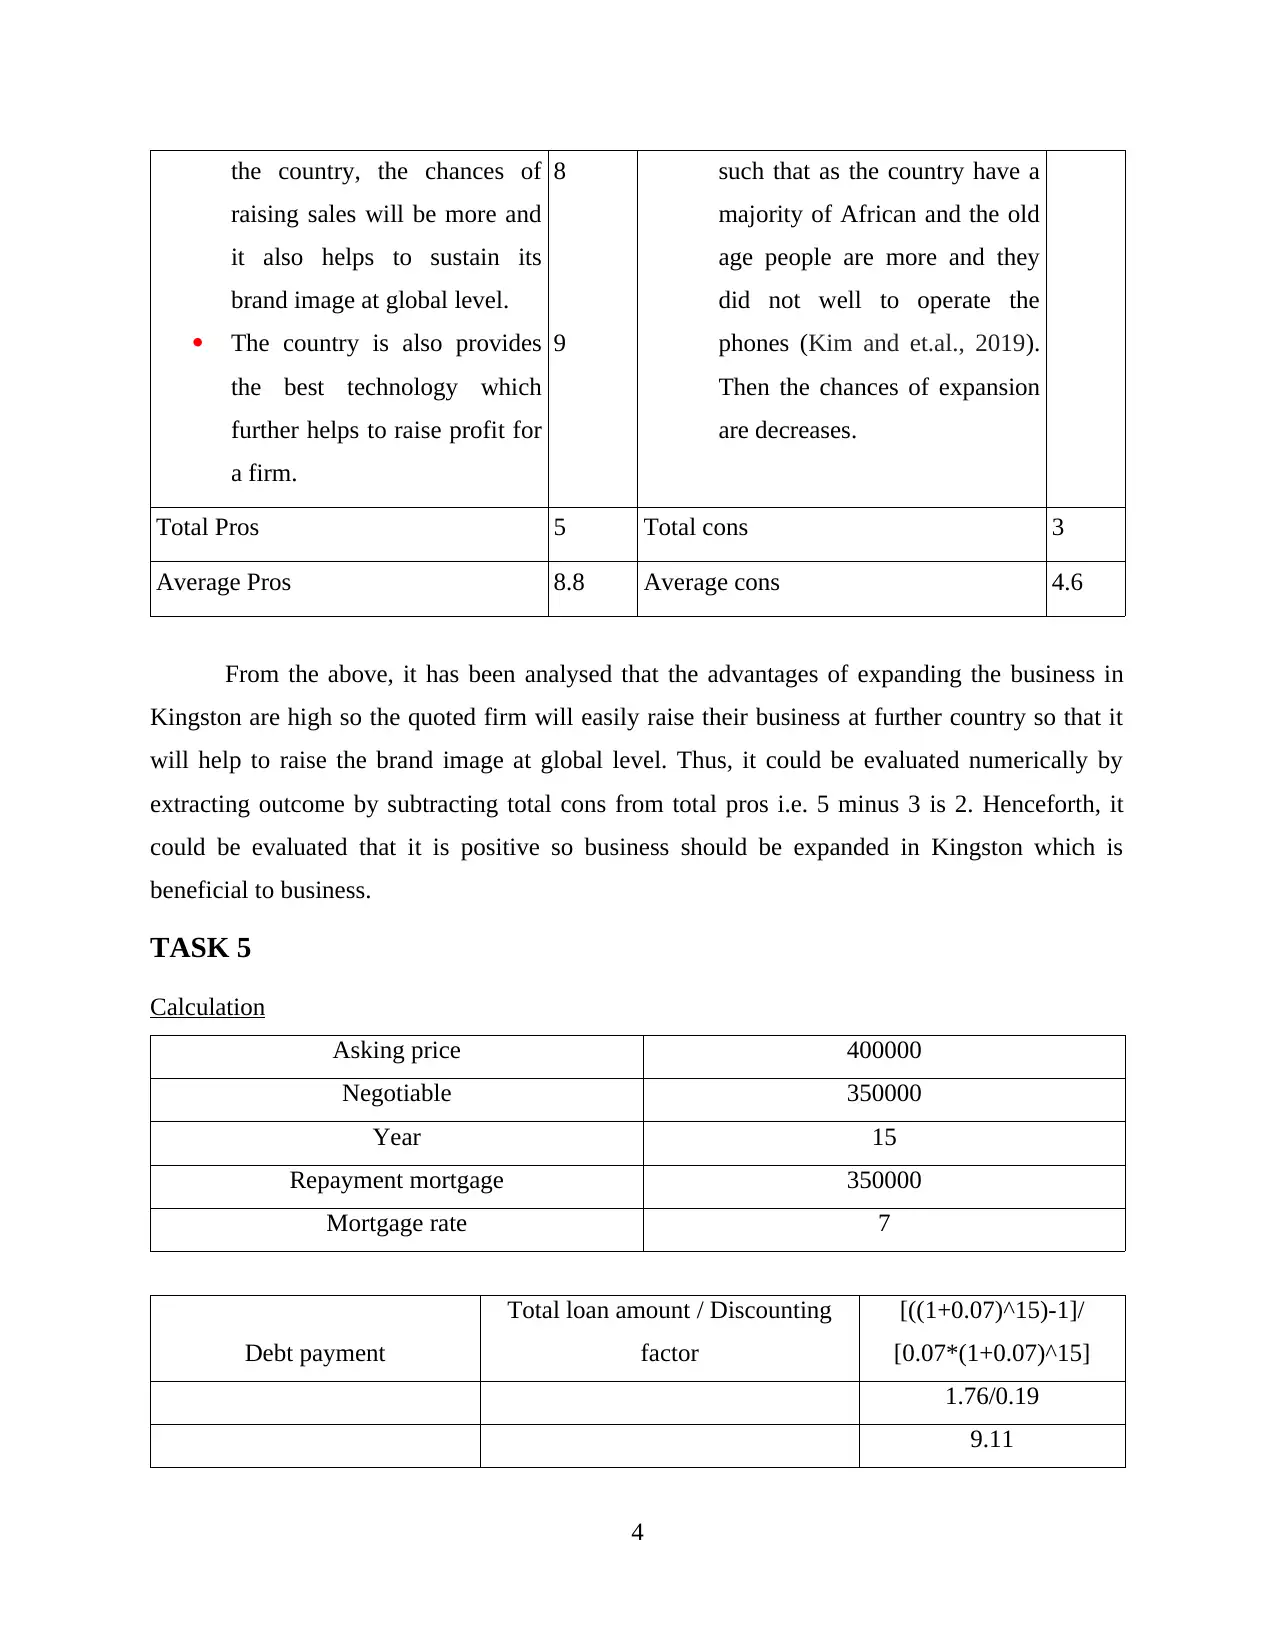
the country, the chances of
raising sales will be more and
it also helps to sustain its
brand image at global level.
The country is also provides
the best technology which
further helps to raise profit for
a firm.
8
9
such that as the country have a
majority of African and the old
age people are more and they
did not well to operate the
phones (Kim and et.al., 2019).
Then the chances of expansion
are decreases.
Total Pros 5 Total cons 3
Average Pros 8.8 Average cons 4.6
From the above, it has been analysed that the advantages of expanding the business in
Kingston are high so the quoted firm will easily raise their business at further country so that it
will help to raise the brand image at global level. Thus, it could be evaluated numerically by
extracting outcome by subtracting total cons from total pros i.e. 5 minus 3 is 2. Henceforth, it
could be evaluated that it is positive so business should be expanded in Kingston which is
beneficial to business.
TASK 5
Calculation
Asking price 400000
Negotiable 350000
Year 15
Repayment mortgage 350000
Mortgage rate 7
Debt payment
Total loan amount / Discounting
factor
[((1+0.07)^15)-1]/
[0.07*(1+0.07)^15]
1.76/0.19
9.11
4
Paraphrase This Document
Need a fresh take? Get an instant paraphrase of this document with our AI Paraphraser
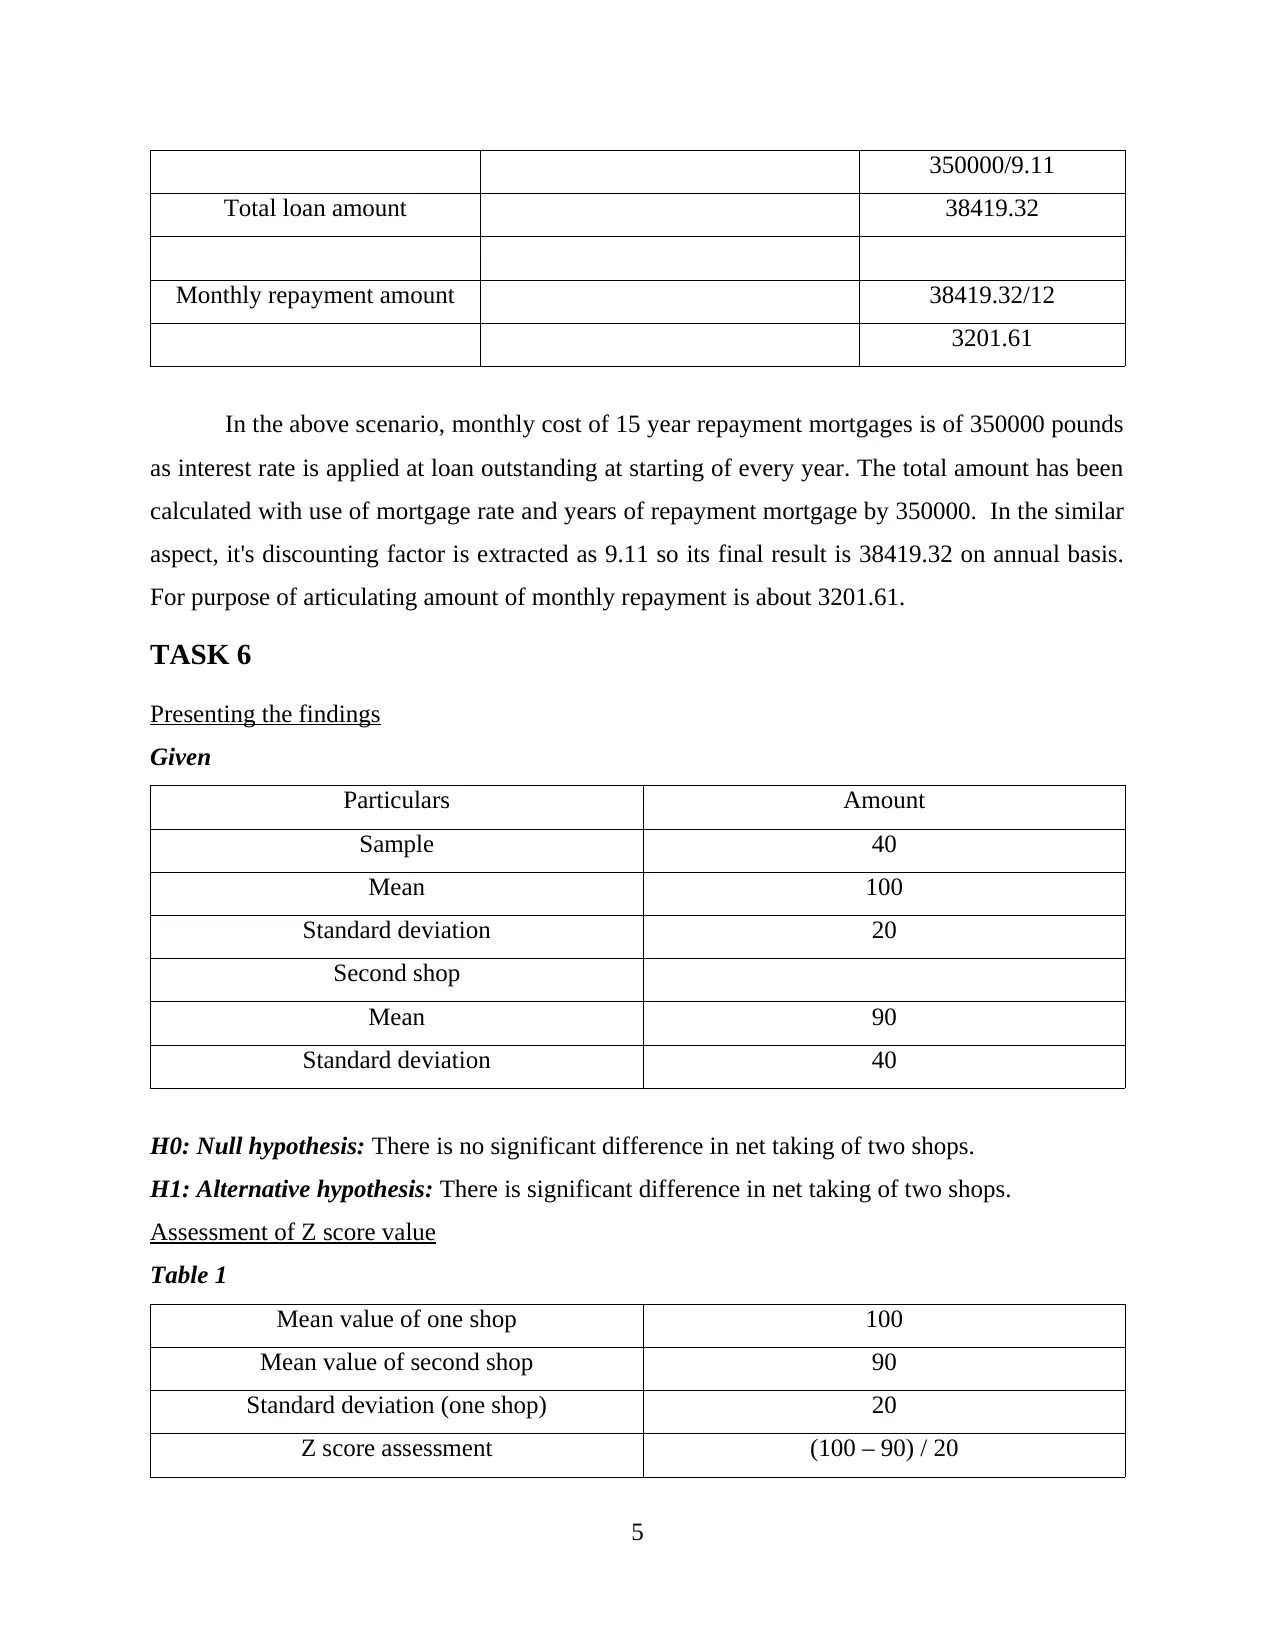
350000/9.11
Total loan amount 38419.32
Monthly repayment amount 38419.32/12
3201.61
In the above scenario, monthly cost of 15 year repayment mortgages is of 350000 pounds
as interest rate is applied at loan outstanding at starting of every year. The total amount has been
calculated with use of mortgage rate and years of repayment mortgage by 350000. In the similar
aspect, it's discounting factor is extracted as 9.11 so its final result is 38419.32 on annual basis.
For purpose of articulating amount of monthly repayment is about 3201.61.
TASK 6
Presenting the findings
Given
Particulars Amount
Sample 40
Mean 100
Standard deviation 20
Second shop
Mean 90
Standard deviation 40
H0: Null hypothesis: There is no significant difference in net taking of two shops.
H1: Alternative hypothesis: There is significant difference in net taking of two shops.
Assessment of Z score value
Table 1
Mean value of one shop 100
Mean value of second shop 90
Standard deviation (one shop) 20
Z score assessment (100 – 90) / 20
5
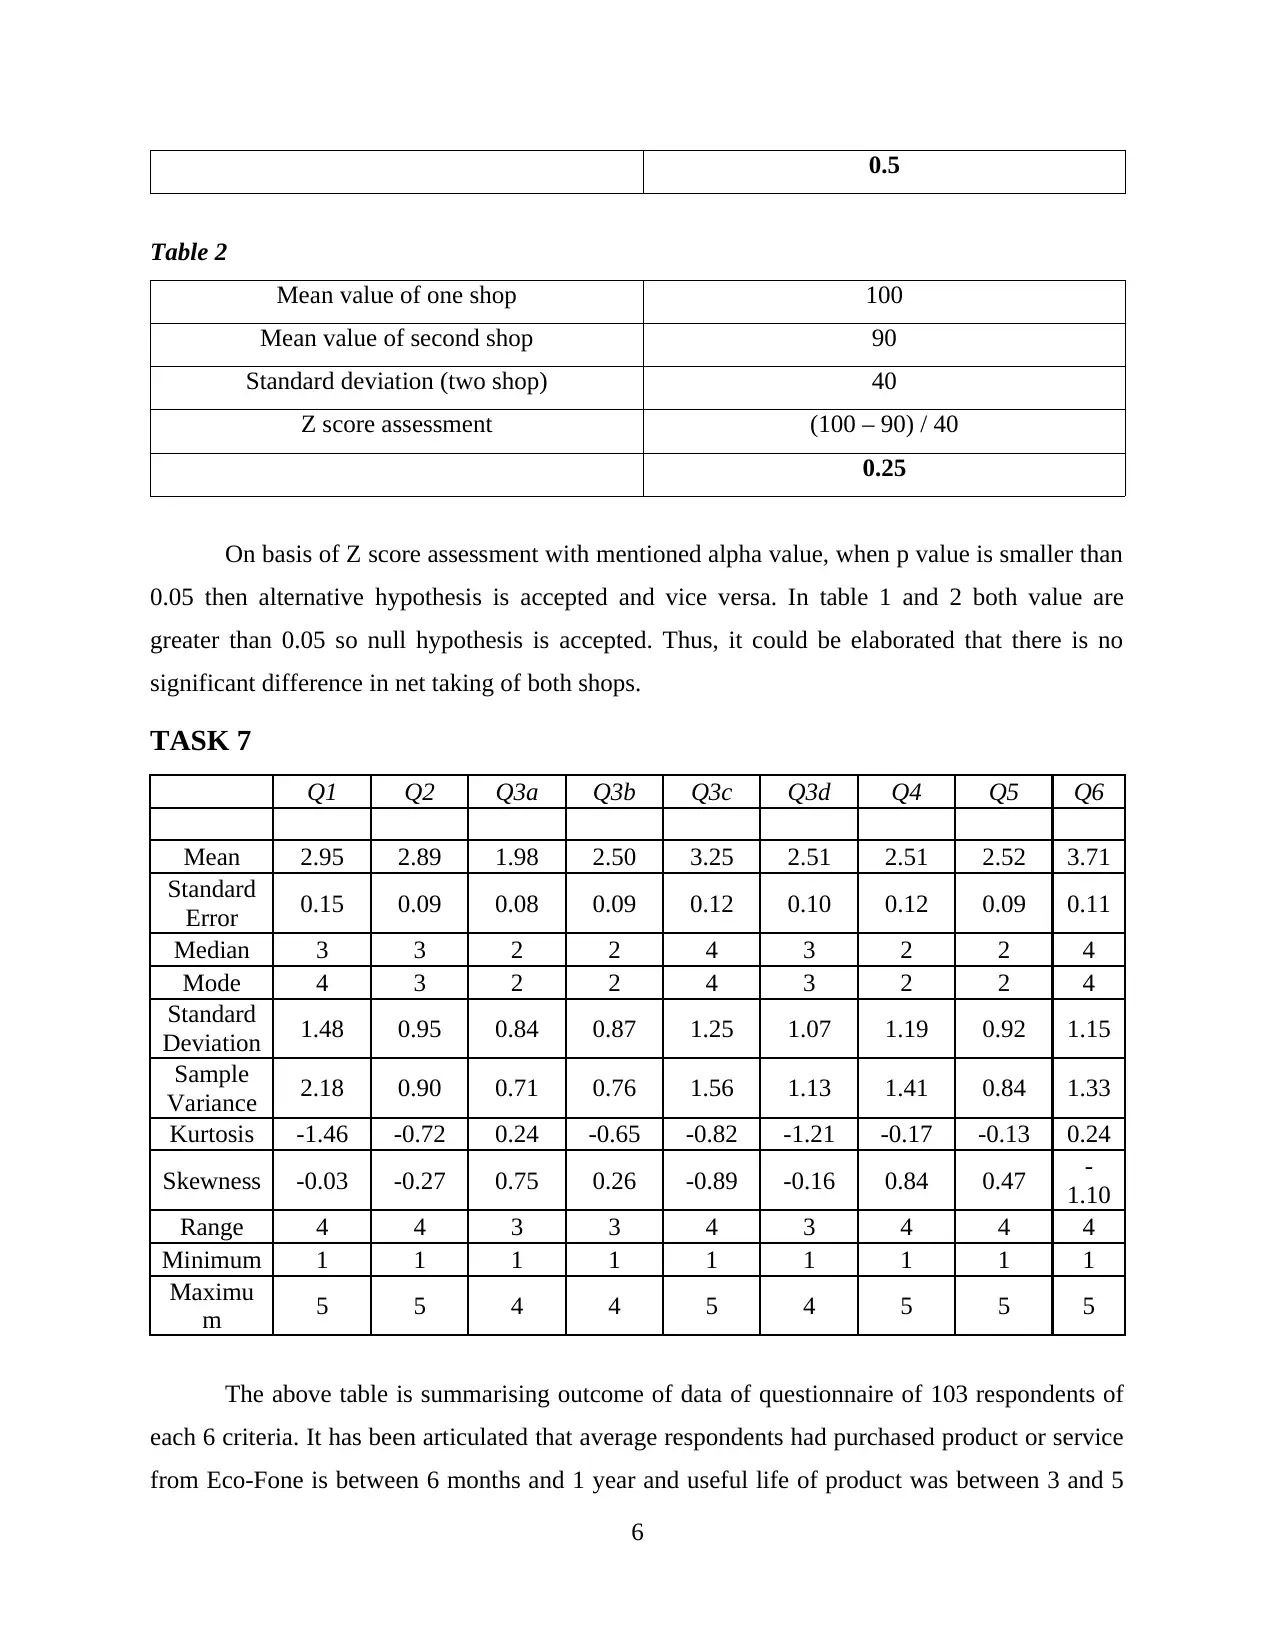
0.5
Table 2
Mean value of one shop 100
Mean value of second shop 90
Standard deviation (two shop) 40
Z score assessment (100 – 90) / 40
0.25
On basis of Z score assessment with mentioned alpha value, when p value is smaller than
0.05 then alternative hypothesis is accepted and vice versa. In table 1 and 2 both value are
greater than 0.05 so null hypothesis is accepted. Thus, it could be elaborated that there is no
significant difference in net taking of both shops.
TASK 7
Q1 Q2 Q3a Q3b Q3c Q3d Q4 Q5 Q6
Mean 2.95 2.89 1.98 2.50 3.25 2.51 2.51 2.52 3.71
Standard
Error 0.15 0.09 0.08 0.09 0.12 0.10 0.12 0.09 0.11
Median 3 3 2 2 4 3 2 2 4
Mode 4 3 2 2 4 3 2 2 4
Standard
Deviation 1.48 0.95 0.84 0.87 1.25 1.07 1.19 0.92 1.15
Sample
Variance 2.18 0.90 0.71 0.76 1.56 1.13 1.41 0.84 1.33
Kurtosis -1.46 -0.72 0.24 -0.65 -0.82 -1.21 -0.17 -0.13 0.24
Skewness -0.03 -0.27 0.75 0.26 -0.89 -0.16 0.84 0.47 -
1.10
Range 4 4 3 3 4 3 4 4 4
Minimum 1 1 1 1 1 1 1 1 1
Maximu
m 5 5 4 4 5 4 5 5 5
The above table is summarising outcome of data of questionnaire of 103 respondents of
each 6 criteria. It has been articulated that average respondents had purchased product or service
from Eco-Fone is between 6 months and 1 year and useful life of product was between 3 and 5
6
⊘ This is a preview!⊘
Do you want full access?
Subscribe today to unlock all pages.
Trusted by 1+ million students worldwide
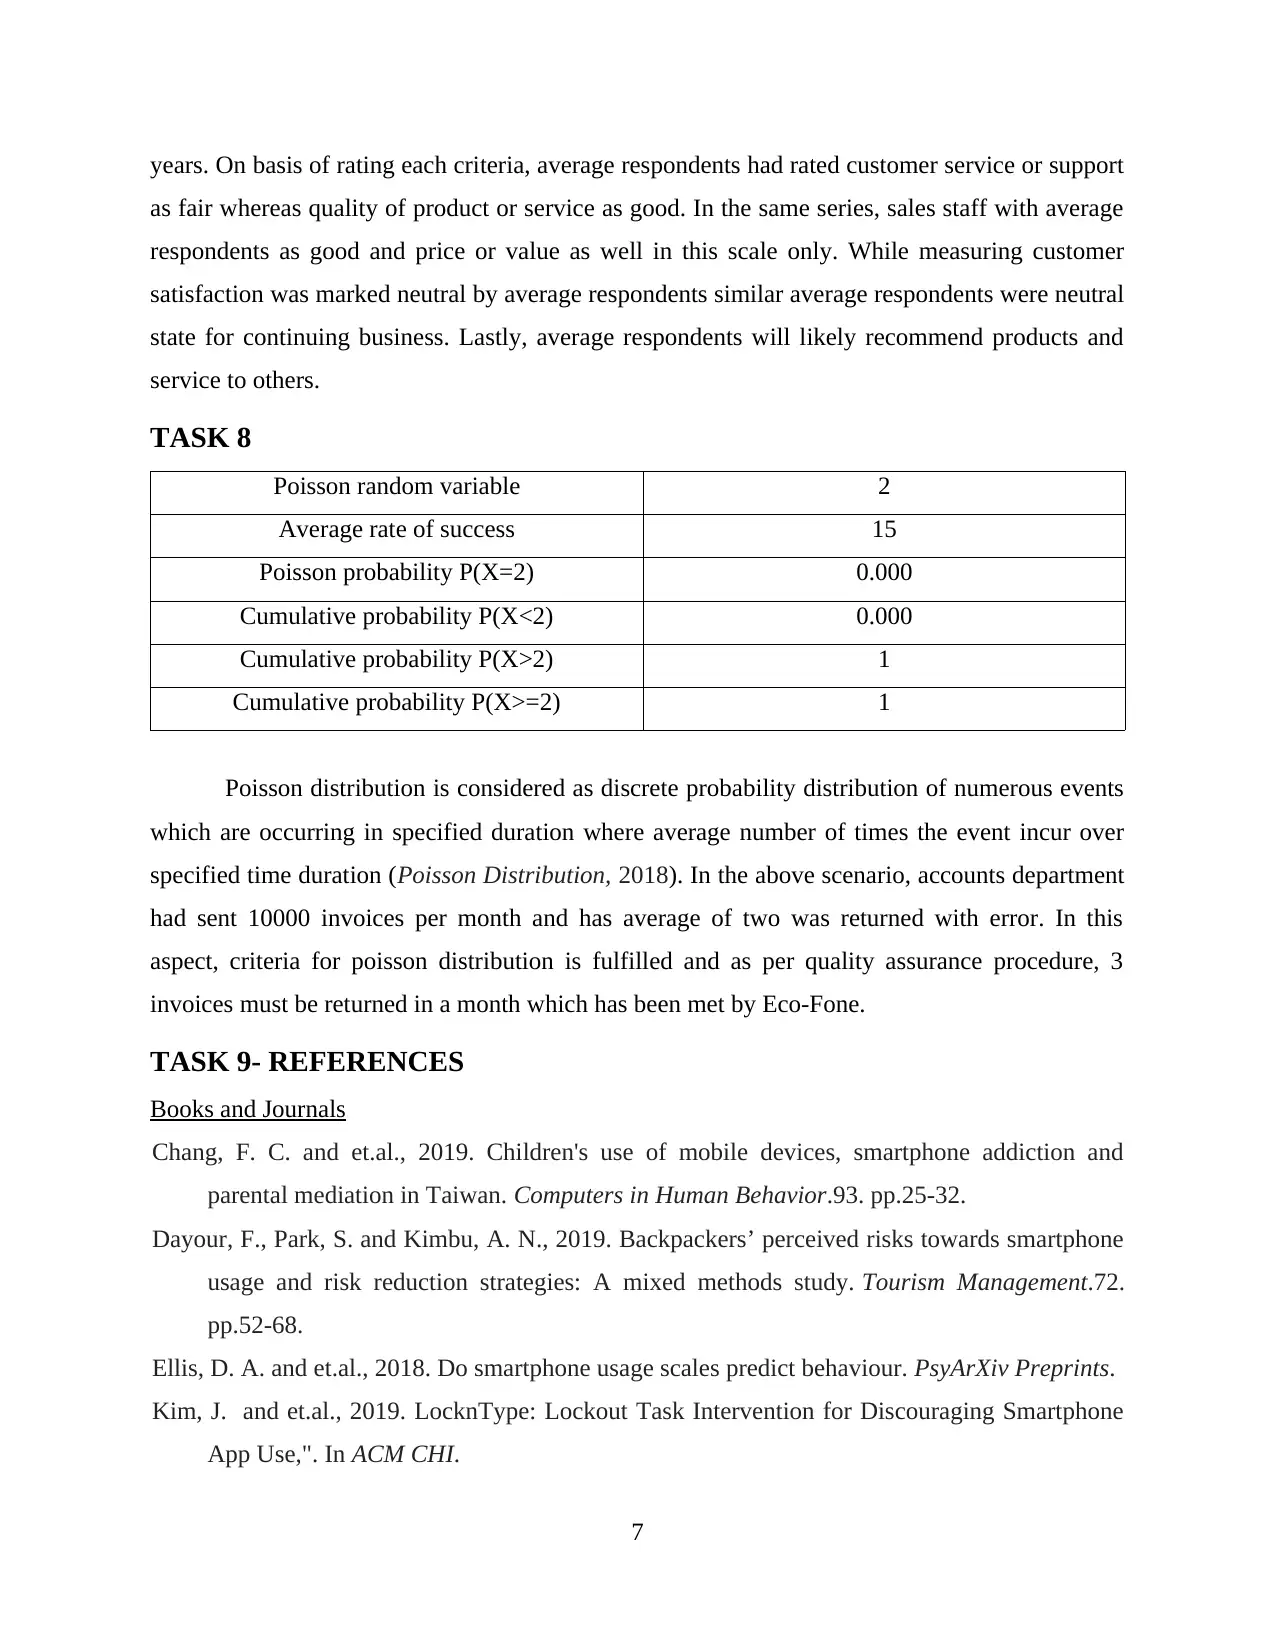
years. On basis of rating each criteria, average respondents had rated customer service or support
as fair whereas quality of product or service as good. In the same series, sales staff with average
respondents as good and price or value as well in this scale only. While measuring customer
satisfaction was marked neutral by average respondents similar average respondents were neutral
state for continuing business. Lastly, average respondents will likely recommend products and
service to others.
TASK 8
Poisson random variable 2
Average rate of success 15
Poisson probability P(X=2) 0.000
Cumulative probability P(X<2) 0.000
Cumulative probability P(X>2) 1
Cumulative probability P(X>=2) 1
Poisson distribution is considered as discrete probability distribution of numerous events
which are occurring in specified duration where average number of times the event incur over
specified time duration (Poisson Distribution, 2018). In the above scenario, accounts department
had sent 10000 invoices per month and has average of two was returned with error. In this
aspect, criteria for poisson distribution is fulfilled and as per quality assurance procedure, 3
invoices must be returned in a month which has been met by Eco-Fone.
TASK 9- REFERENCES
Books and Journals
Chang, F. C. and et.al., 2019. Children's use of mobile devices, smartphone addiction and
parental mediation in Taiwan. Computers in Human Behavior.93. pp.25-32.
Dayour, F., Park, S. and Kimbu, A. N., 2019. Backpackers’ perceived risks towards smartphone
usage and risk reduction strategies: A mixed methods study. Tourism Management.72.
pp.52-68.
Ellis, D. A. and et.al., 2018. Do smartphone usage scales predict behaviour. PsyArXiv Preprints.
Kim, J. and et.al., 2019. LocknType: Lockout Task Intervention for Discouraging Smartphone
App Use,". In ACM CHI.
7
Paraphrase This Document
Need a fresh take? Get an instant paraphrase of this document with our AI Paraphraser
Poushter, J., 2016. Smartphone ownership and internet usage continues to climb in emerging
economies. Pew Research Center. 22. pp.1-44.
Rosales, A. and Fernández-Ardèvol, M., 2019. Smartphone Usage Diversity among Older
People. In Perspectives on Human-Computer Interaction Research with Older People (pp.
51-66). Springer, Cham.
Strain, T., Wijndaele, K. L. and Brage, S., 2019. Physical activity surveillance through
smartphone applications and wearable trackers: Examining the UK potential for nationally
representative sampling.
Online
Poisson Distribution. 2018. [Online[. Available through
<https://www.onlinemathlearning.com/poisson-distribution.html>.
TASK 10
Findings
From the above, it has been find that the smartphones are one of the most important and
basic need for all age group. From the report it has been analysed that in UK, the majority of old
age group people used the smartphones in order to keep themselves engaged. For that reason,
even the industry also develop their new phones which contain bigger screen that helps to view
for old age group as well. Apart from this, further it is also analysed that for forecasting, the line
chart is not appropriate because does not help to show the exact fluctuation. Therefore, using
hybrid forecasting method will be beneficial for Eco-Fone (Strain, Wijndaele and Brage, 2019).
Moreover, as the firm provide good products and always satisfy their customers needs
then it shows that the quoted firm will easily shows expand the business at further country.
Beside this, from the above table, it has been analysed that the chances of expansion in Kingston
are more because it helps to raise its profitability and can sustain its image in market as well. In
the same series, it has been articulated that net takings of both shop are similar with application
of Z score assessment and poisson distribution is appropriate for extracting probability.
CONCLUSION
By summing up above report, it has been concluded that in UK, the smartphone sales are
increases and every age group people uses this for their official as well as unofficial way.
Further, report also concluded that old age people whose age is in between 15-25 also uses the
8

smartphones. Moreover, it shows the calculation of monthly cost of 15 year repayment using the
formula and then concluded the pros and cons of expanding the Eco- Fone into Kingston as well.
Apart from this, report also calculated the average values and shows the reason of using Poisson
distribution as well.
9
formula and then concluded the pros and cons of expanding the Eco- Fone into Kingston as well.
Apart from this, report also calculated the average values and shows the reason of using Poisson
distribution as well.
9
⊘ This is a preview!⊘
Do you want full access?
Subscribe today to unlock all pages.
Trusted by 1+ million students worldwide
1 out of 12
Related Documents


Your All-in-One AI-Powered Toolkit for Academic Success.
+13062052269
info@desklib.com
Available 24*7 on WhatsApp / Email
![[object Object]](/_next/static/media/star-bottom.7253800d.svg)
Unlock your academic potential
Copyright © 2020–2026 A2Z Services. All Rights Reserved. Developed and managed by ZUCOL.