Eco-Fone: Business Analysis Report on UK Smartphone Market Expansion
VerifiedAdded on 2023/01/12
|19
|4390
|31
Report
AI Summary
This report presents a business analysis for Eco-Fone, a smartphone retailer operating in the UK, with a focus on market trends, expansion opportunities, and customer satisfaction. The report begins with an overview of the UK mobile phone market, forecasting smartphone usage and identifying potential market segments, particularly older customers. It then assesses the feasibility of expanding the business to Kingston, using a pros and cons analysis, and evaluates the costs associated with a new building. The report investigates the differences in net takings between Eco-Fone's existing shops and analyzes customer satisfaction through survey data. Quality procedures are also examined using the Poisson distribution technique. The analysis includes forecasting future smartphone usage and considering factors that influence customer satisfaction, such as product features, service quality, and pricing. Overall, the report provides insights into Eco-Fone's strategic decisions and offers recommendations for business growth and customer retention.
B11650
ECO FONE
ECO FONE
Paraphrase This Document
Need a fresh take? Get an instant paraphrase of this document with our AI Paraphraser
Table of Contents
INTRODUCTION...........................................................................................................................3
1. Analysis of Issues for Eco-Fone Smartphones.........................................................................4
1.1 An Overview of the Mobile phone market in the UK.......................................................4
1.2 Forecasting the UK Adult Smartphone use.......................................................................5
1.3 Smartphones – A potential market for older customers....................................................6
1.4 Feasibility of Expanding business to Kingston using Pros and Cons table......................7
1.5 Cost of a New Building.....................................................................................................8
1.6 Testing the possible difference in Net Takings in the two shops......................................9
1.7 Customer satisfaction......................................................................................................10
1.8 Quality Procedures..........................................................................................................11
Conclusion.....................................................................................................................................12
REFERENCES..............................................................................................................................13
Appendices....................................................................................................................................14
INTRODUCTION
This project report applies the business analysis tool through hypothetical company EcoFone;
this company engages in selling smartphones through two shops situated at Putney and
Richmond. As per case study company established in 2014 and wants to expand its business all
over Kingston. Business report will cover pros and cons analyses techniques and presented
survey data through the help of line graph. Forecasting has been done to find how much increase
can be seen in financial year of 2018-19. Monthly mortgage amount has been calculated with the
help of excel sheet formulae. For analyzing quality assessment; poison distribution technique has
been applied to find error in invoice supply. Report also carries survey report on old customers
usage of phones and feedback of 103 aspirants regarding the service and other factors of
EcoFone will help in supporting strategies to improve those components which forced customer
to underrating the company.
⊘ This is a preview!⊘
Do you want full access?
Subscribe today to unlock all pages.
Trusted by 1+ million students worldwide
1. Analysis of Issues for Eco-Fone Smartphones
1.1 An Overview of the Mobile phone market in the UK
A survey report on population of UK shows that the total population of the country
which is 33.5 million is categorized into different groups; 32 million are workers, 1
millions are teenagers going to schools and colleges and 0.5 millions are non-working
women. Studies reveal that fifty percent of workers population forced to use
mobilephones at least for one business apps to work efficiently and report on time.
Some apps found important on the basis of data, collected from workers group. Hence
according to survey outcome; 44% users prefers email, 34% give preference to voice
calls and only 23% utilizes phone managing important events on calendar. But some of
the features demand technical or professional knowledge records less usage by workers
such as forming legacy information and transferring important information’s to boss
through reporting systems apps (Karlis, 2003). There are still some more utilities in
smartphone which don’t have any use in offices or work places but this can make
people’s life easy like instant messaging, mobile browsers, mobile navigation and photo
filters to make own photo funny and awesome. Most of the people according to survey
report; see whatsapp at least once a day. The further strudy of data also shows that,
vendors, direct marketer, seller and any field job worker cannot carry laptop and
computer at any place; but they still required to share their reports online and updated
location with google map tools. Hence mobile phones fulfills their desired needs
through sending mail, sending reports, checking any disclosures and tracking goods left
in warehouses; and make strategy to improve logistics.
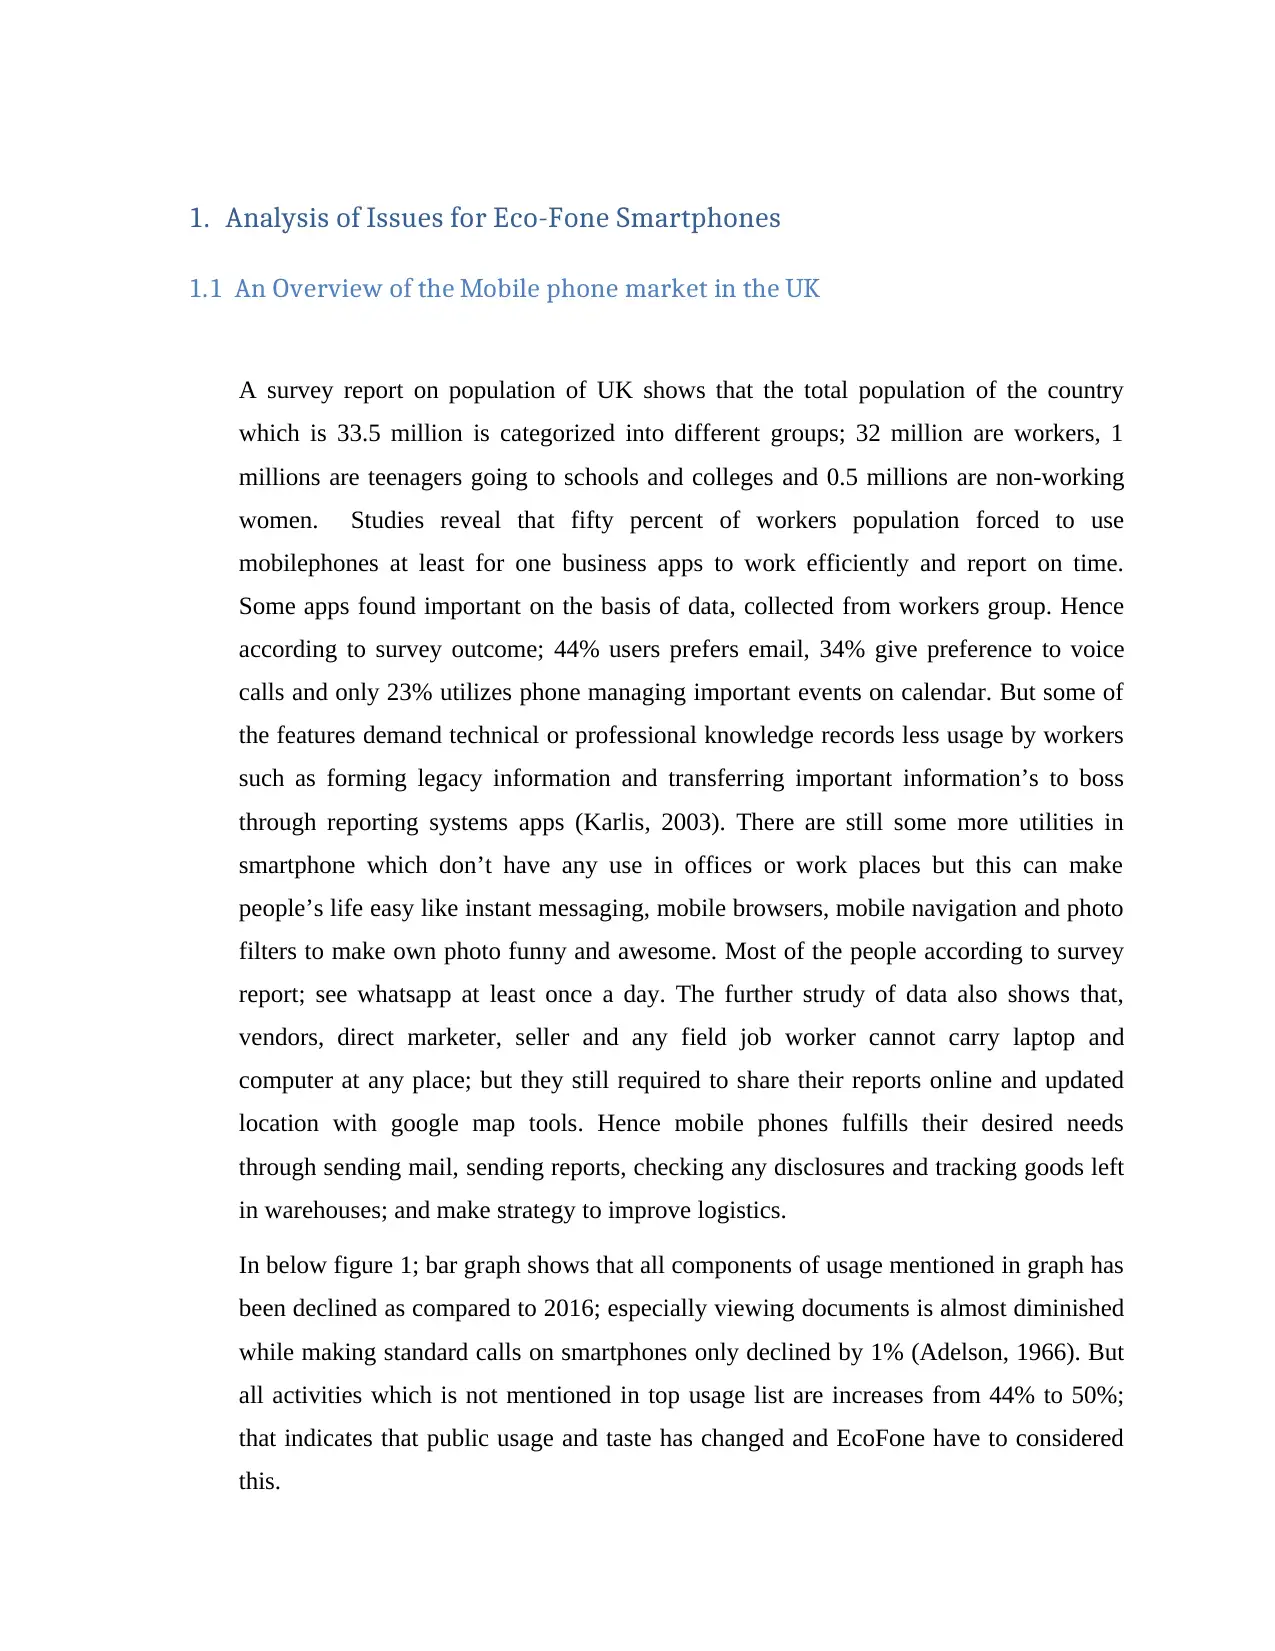
In below figure 1; bar graph shows that all components of usage mentioned in graph has
been declined as compared to 2016; especially viewing documents is almost diminished
while making standard calls on smartphones only declined by 1% (Adelson, 1966). But
all activities which is not mentioned in top usage list are increases from 44% to 50%;
that indicates that public usage and taste has changed and EcoFone have to considered
this.
1.1 An Overview of the Mobile phone market in the UK
A survey report on population of UK shows that the total population of the country
which is 33.5 million is categorized into different groups; 32 million are workers, 1
millions are teenagers going to schools and colleges and 0.5 millions are non-working
women. Studies reveal that fifty percent of workers population forced to use
mobilephones at least for one business apps to work efficiently and report on time.
Some apps found important on the basis of data, collected from workers group. Hence
according to survey outcome; 44% users prefers email, 34% give preference to voice
calls and only 23% utilizes phone managing important events on calendar. But some of
the features demand technical or professional knowledge records less usage by workers
such as forming legacy information and transferring important information’s to boss
through reporting systems apps (Karlis, 2003). There are still some more utilities in
smartphone which don’t have any use in offices or work places but this can make
people’s life easy like instant messaging, mobile browsers, mobile navigation and photo
filters to make own photo funny and awesome. Most of the people according to survey
report; see whatsapp at least once a day. The further strudy of data also shows that,
vendors, direct marketer, seller and any field job worker cannot carry laptop and
computer at any place; but they still required to share their reports online and updated
location with google map tools. Hence mobile phones fulfills their desired needs
through sending mail, sending reports, checking any disclosures and tracking goods left
in warehouses; and make strategy to improve logistics.
In below figure 1; bar graph shows that all components of usage mentioned in graph has
been declined as compared to 2016; especially viewing documents is almost diminished
while making standard calls on smartphones only declined by 1% (Adelson, 1966). But
all activities which is not mentioned in top usage list are increases from 44% to 50%;
that indicates that public usage and taste has changed and EcoFone have to considered
this.
Paraphrase This Document
Need a fresh take? Get an instant paraphrase of this document with our AI Paraphraser
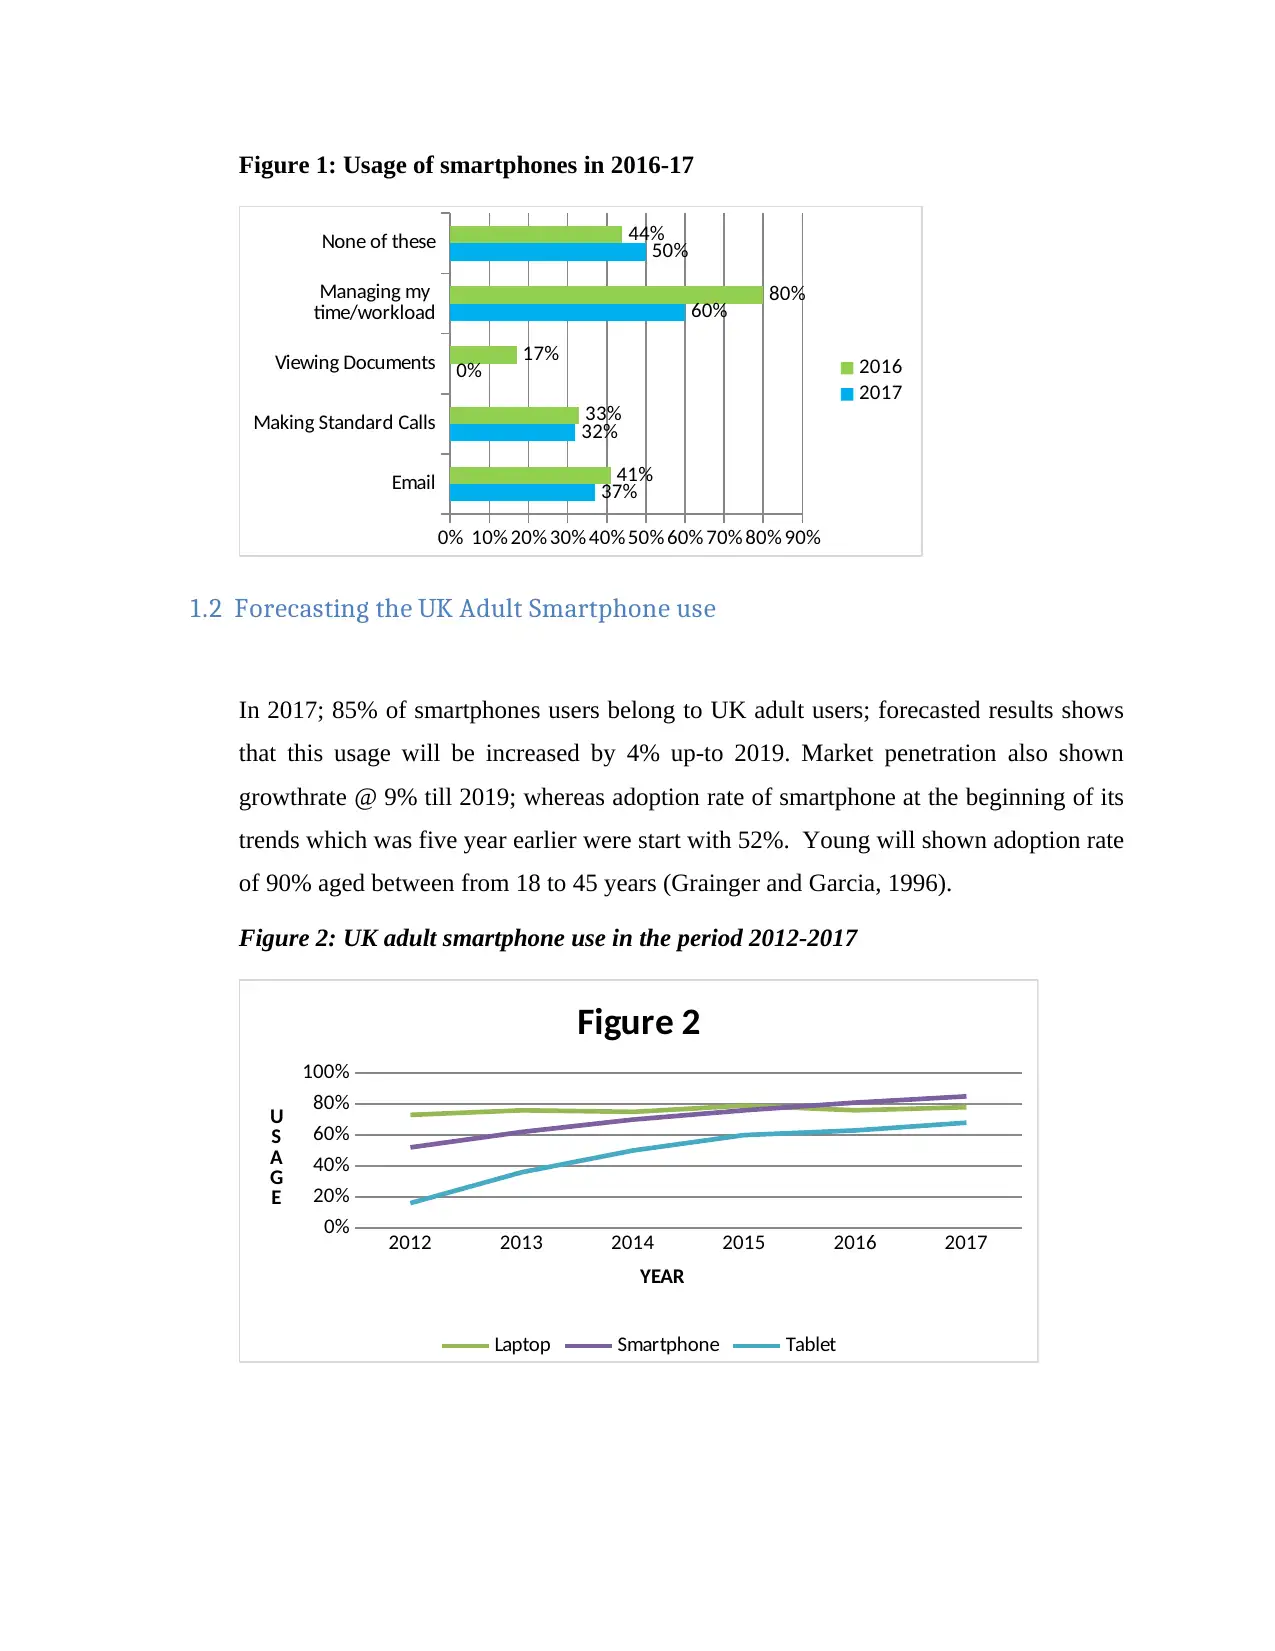
Figure 1: Usage of smartphones in 2016-17
Email
Making Standard Calls
Viewing Documents
Managing my
time/workload
None of these
0% 10% 20% 30% 40% 50% 60% 70% 80% 90%
37%
32%
0%
60%
50%
41%
33%
17%
80%
44%
2016
2017
1.2 Forecasting the UK Adult Smartphone use
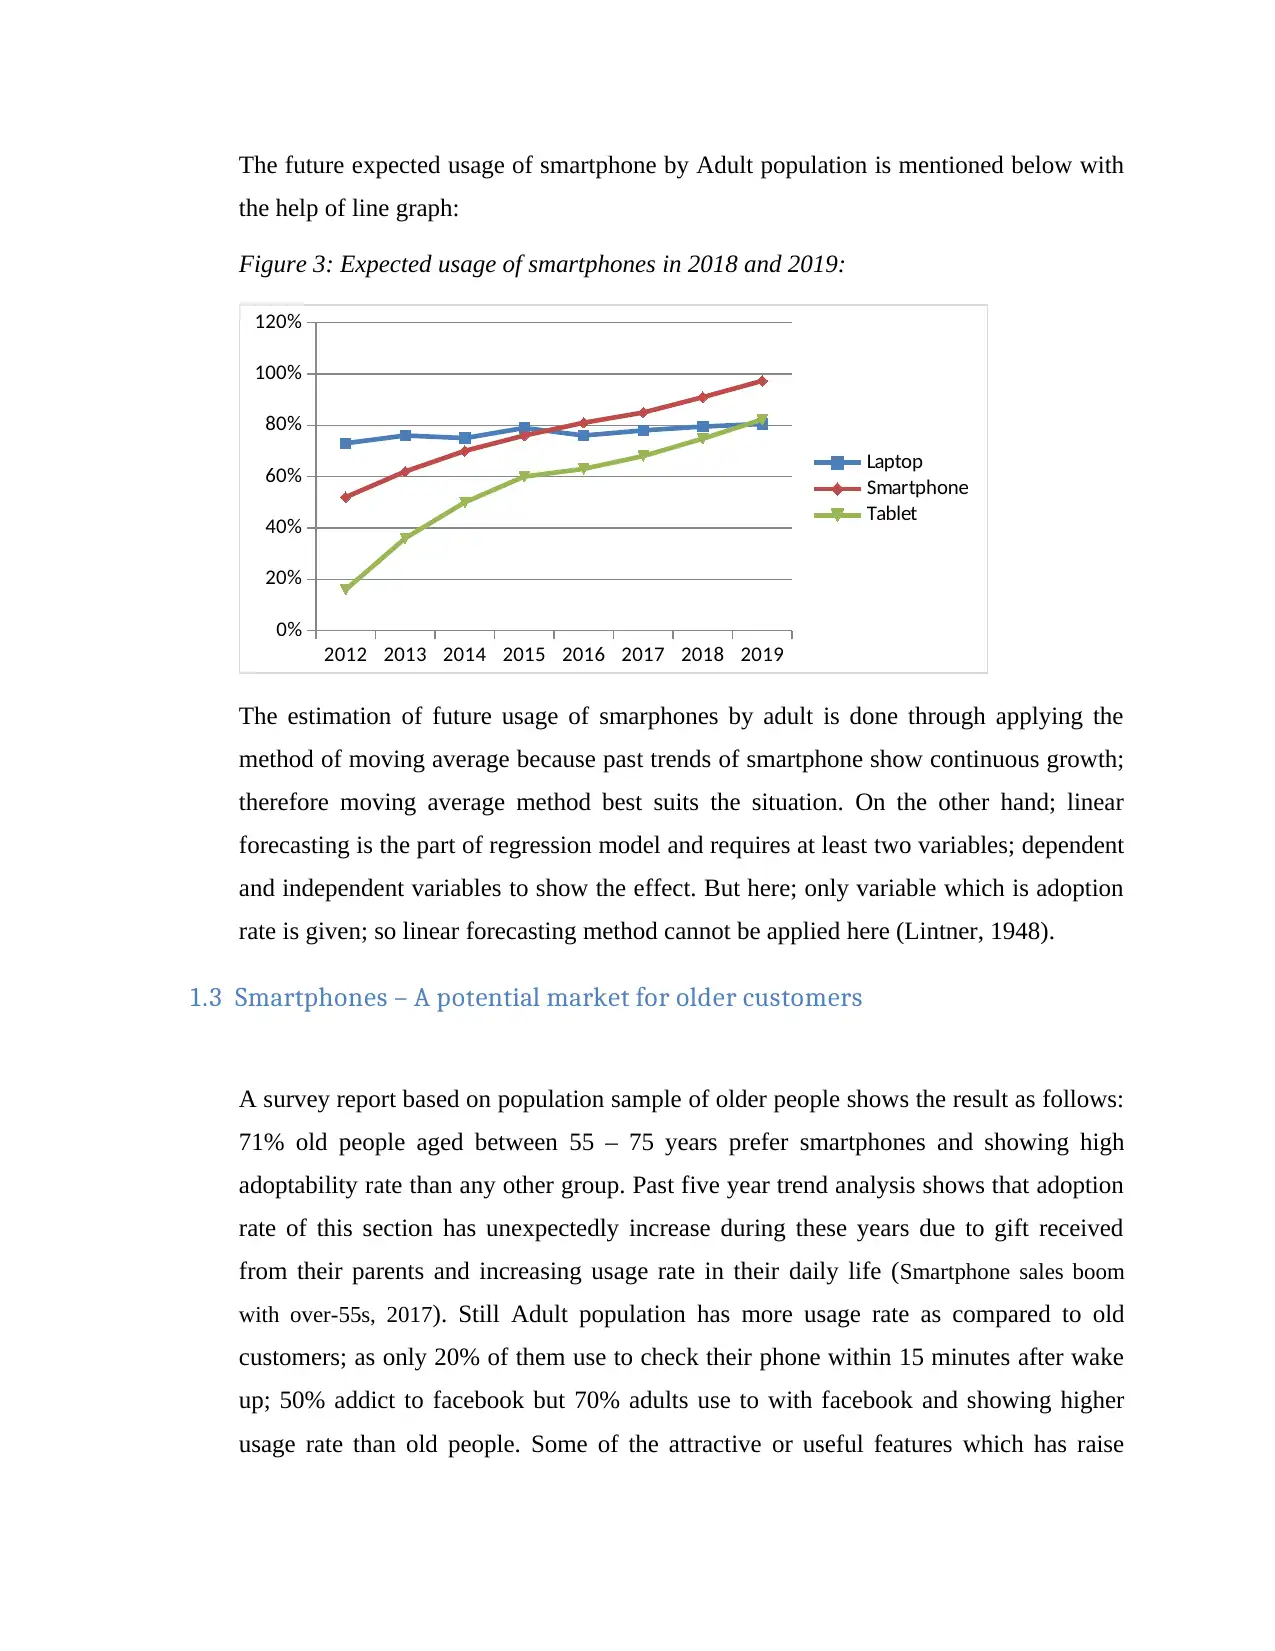
In 2017; 85% of smartphones users belong to UK adult users; forecasted results shows
that this usage will be increased by 4% up-to 2019. Market penetration also shown
growthrate @ 9% till 2019; whereas adoption rate of smartphone at the beginning of its
trends which was five year earlier were start with 52%. Young will shown adoption rate
of 90% aged between from 18 to 45 years (Grainger and Garcia, 1996).
Figure 2: UK adult smartphone use in the period 2012-2017
2012 2013 2014 2015 2016 2017
0%
20%
40%
60%
80%
100%
Figure 2
Laptop Smartphone Tablet
YEAR
U
S
A
G
E
Making Standard Calls
Viewing Documents
Managing my
time/workload
None of these
0% 10% 20% 30% 40% 50% 60% 70% 80% 90%
37%
32%
0%
60%
50%
41%
33%
17%
80%
44%
2016
2017
1.2 Forecasting the UK Adult Smartphone use
In 2017; 85% of smartphones users belong to UK adult users; forecasted results shows
that this usage will be increased by 4% up-to 2019. Market penetration also shown
growthrate @ 9% till 2019; whereas adoption rate of smartphone at the beginning of its
trends which was five year earlier were start with 52%. Young will shown adoption rate
of 90% aged between from 18 to 45 years (Grainger and Garcia, 1996).
Figure 2: UK adult smartphone use in the period 2012-2017
2012 2013 2014 2015 2016 2017
0%
20%
40%
60%
80%
100%
Figure 2
Laptop Smartphone Tablet
YEAR
U
S
A
G
E
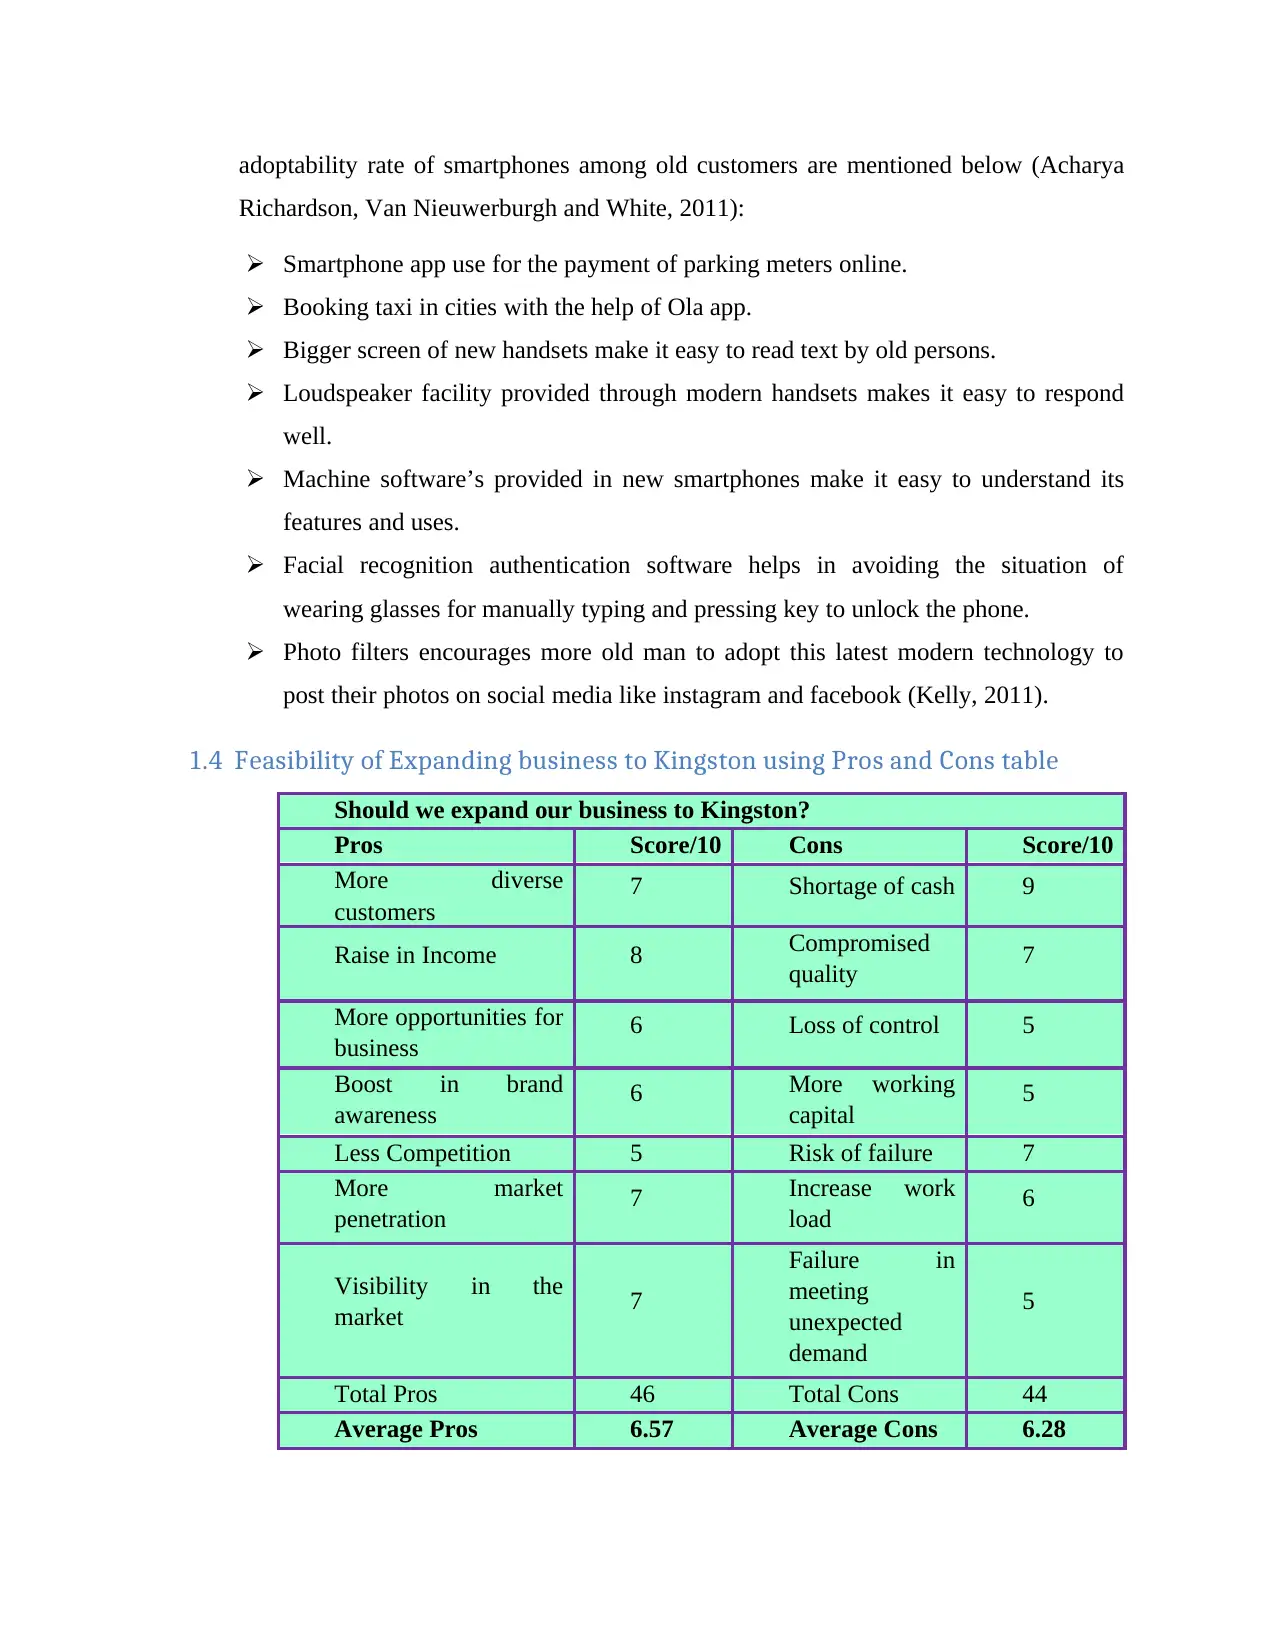
The future expected usage of smartphone by Adult population is mentioned below with
the help of line graph:
Figure 3: Expected usage of smartphones in 2018 and 2019:
2012 2013 2014 2015 2016 2017 2018 2019
0%
20%
40%
60%
80%
100%
120%
Laptop
Smartphone
Tablet
The estimation of future usage of smarphones by adult is done through applying the
method of moving average because past trends of smartphone show continuous growth;
therefore moving average method best suits the situation. On the other hand; linear
forecasting is the part of regression model and requires at least two variables; dependent
and independent variables to show the effect. But here; only variable which is adoption
rate is given; so linear forecasting method cannot be applied here (Lintner, 1948).
1.3 Smartphones – A potential market for older customers
A survey report based on population sample of older people shows the result as follows:
71% old people aged between 55 – 75 years prefer smartphones and showing high
adoptability rate than any other group. Past five year trend analysis shows that adoption
rate of this section has unexpectedly increase during these years due to gift received
from their parents and increasing usage rate in their daily life (Smartphone sales boom
with over-55s, 2017). Still Adult population has more usage rate as compared to old
customers; as only 20% of them use to check their phone within 15 minutes after wake
up; 50% addict to facebook but 70% adults use to with facebook and showing higher
usage rate than old people. Some of the attractive or useful features which has raise
⊘ This is a preview!⊘
Do you want full access?
Subscribe today to unlock all pages.
Trusted by 1+ million students worldwide
adoptability rate of smartphones among old customers are mentioned below (Acharya
Richardson, Van Nieuwerburgh and White, 2011):
Smartphone app use for the payment of parking meters online.
Booking taxi in cities with the help of Ola app.
Bigger screen of new handsets make it easy to read text by old persons.
Loudspeaker facility provided through modern handsets makes it easy to respond
well.
Machine software’s provided in new smartphones make it easy to understand its
features and uses.
Facial recognition authentication software helps in avoiding the situation of
wearing glasses for manually typing and pressing key to unlock the phone.
Photo filters encourages more old man to adopt this latest modern technology to
post their photos on social media like instagram and facebook (Kelly, 2011).
1.4 Feasibility of Expanding business to Kingston using Pros and Cons table
Should we expand our business to Kingston?
Pros Score/10 Cons Score/10
More diverse
customers
7 Shortage of cash 9
Raise in Income 8 Compromised
quality 7
More opportunities for
business 6 Loss of control 5
Boost in brand
awareness 6 More working
capital
requirement
5
Less Competition 5 Risk of failure 7
More market
penetration 7 Increase work
load 6
Visibility in the
market 7
Failure in
meeting
unexpected
demand
5
Total Pros 46 Total Cons 44
Average Pros 6.57 Average Cons 6.28
Paraphrase This Document
Need a fresh take? Get an instant paraphrase of this document with our AI Paraphraser
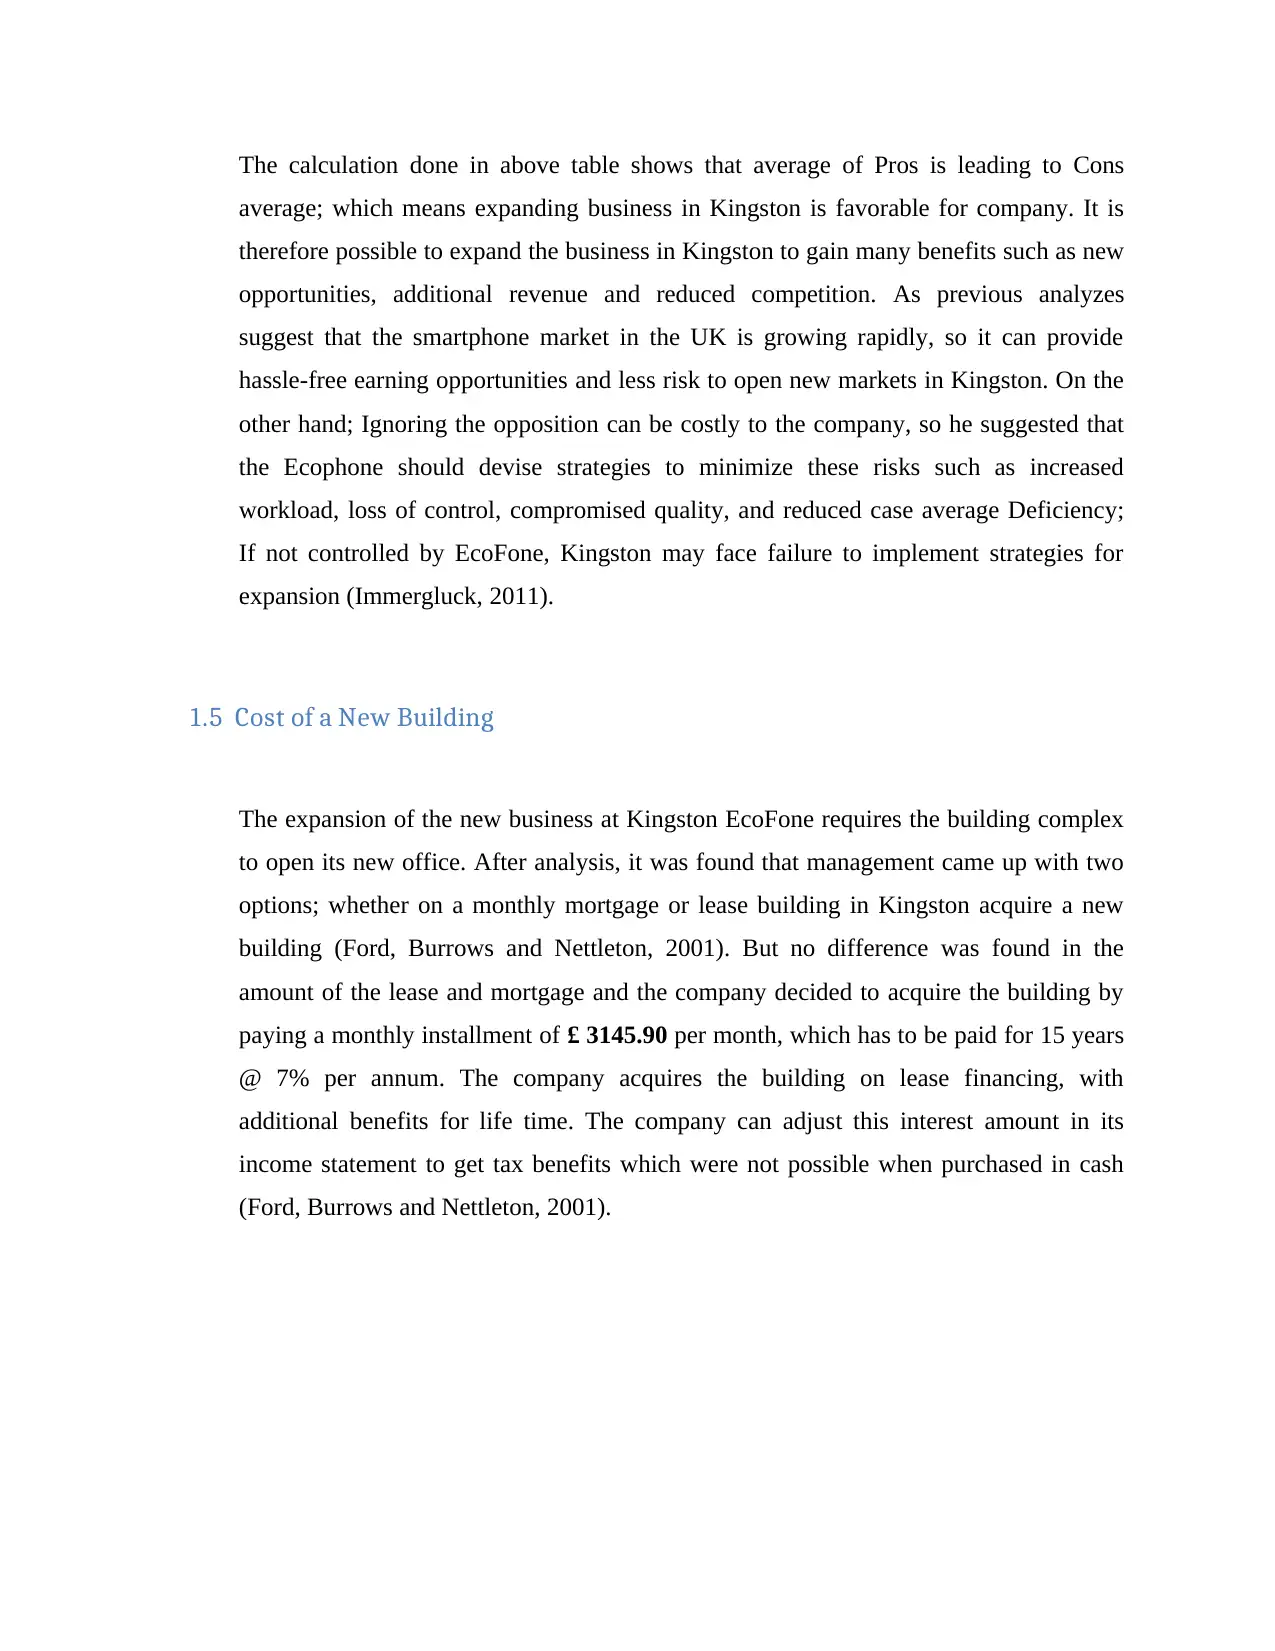
The calculation done in above table shows that average of Pros is leading to Cons
average; which means expanding business in Kingston is favorable for company. It is
therefore possible to expand the business in Kingston to gain many benefits such as new
opportunities, additional revenue and reduced competition. As previous analyzes
suggest that the smartphone market in the UK is growing rapidly, so it can provide
hassle-free earning opportunities and less risk to open new markets in Kingston. On the
other hand; Ignoring the opposition can be costly to the company, so he suggested that
the Ecophone should devise strategies to minimize these risks such as increased
workload, loss of control, compromised quality, and reduced case average Deficiency;
If not controlled by EcoFone, Kingston may face failure to implement strategies for
expansion (Immergluck, 2011).
1.5 Cost of a New Building
The expansion of the new business at Kingston EcoFone requires the building complex
to open its new office. After analysis, it was found that management came up with two
options; whether on a monthly mortgage or lease building in Kingston acquire a new
building (Ford, Burrows and Nettleton, 2001). But no difference was found in the
amount of the lease and mortgage and the company decided to acquire the building by
paying a monthly installment of £ 3145.90 per month, which has to be paid for 15 years
@ 7% per annum. The company acquires the building on lease financing, with
additional benefits for life time. The company can adjust this interest amount in its
income statement to get tax benefits which were not possible when purchased in cash
(Ford, Burrows and Nettleton, 2001).
Popular mortgage brands of UK
(Small business prices, 2020)
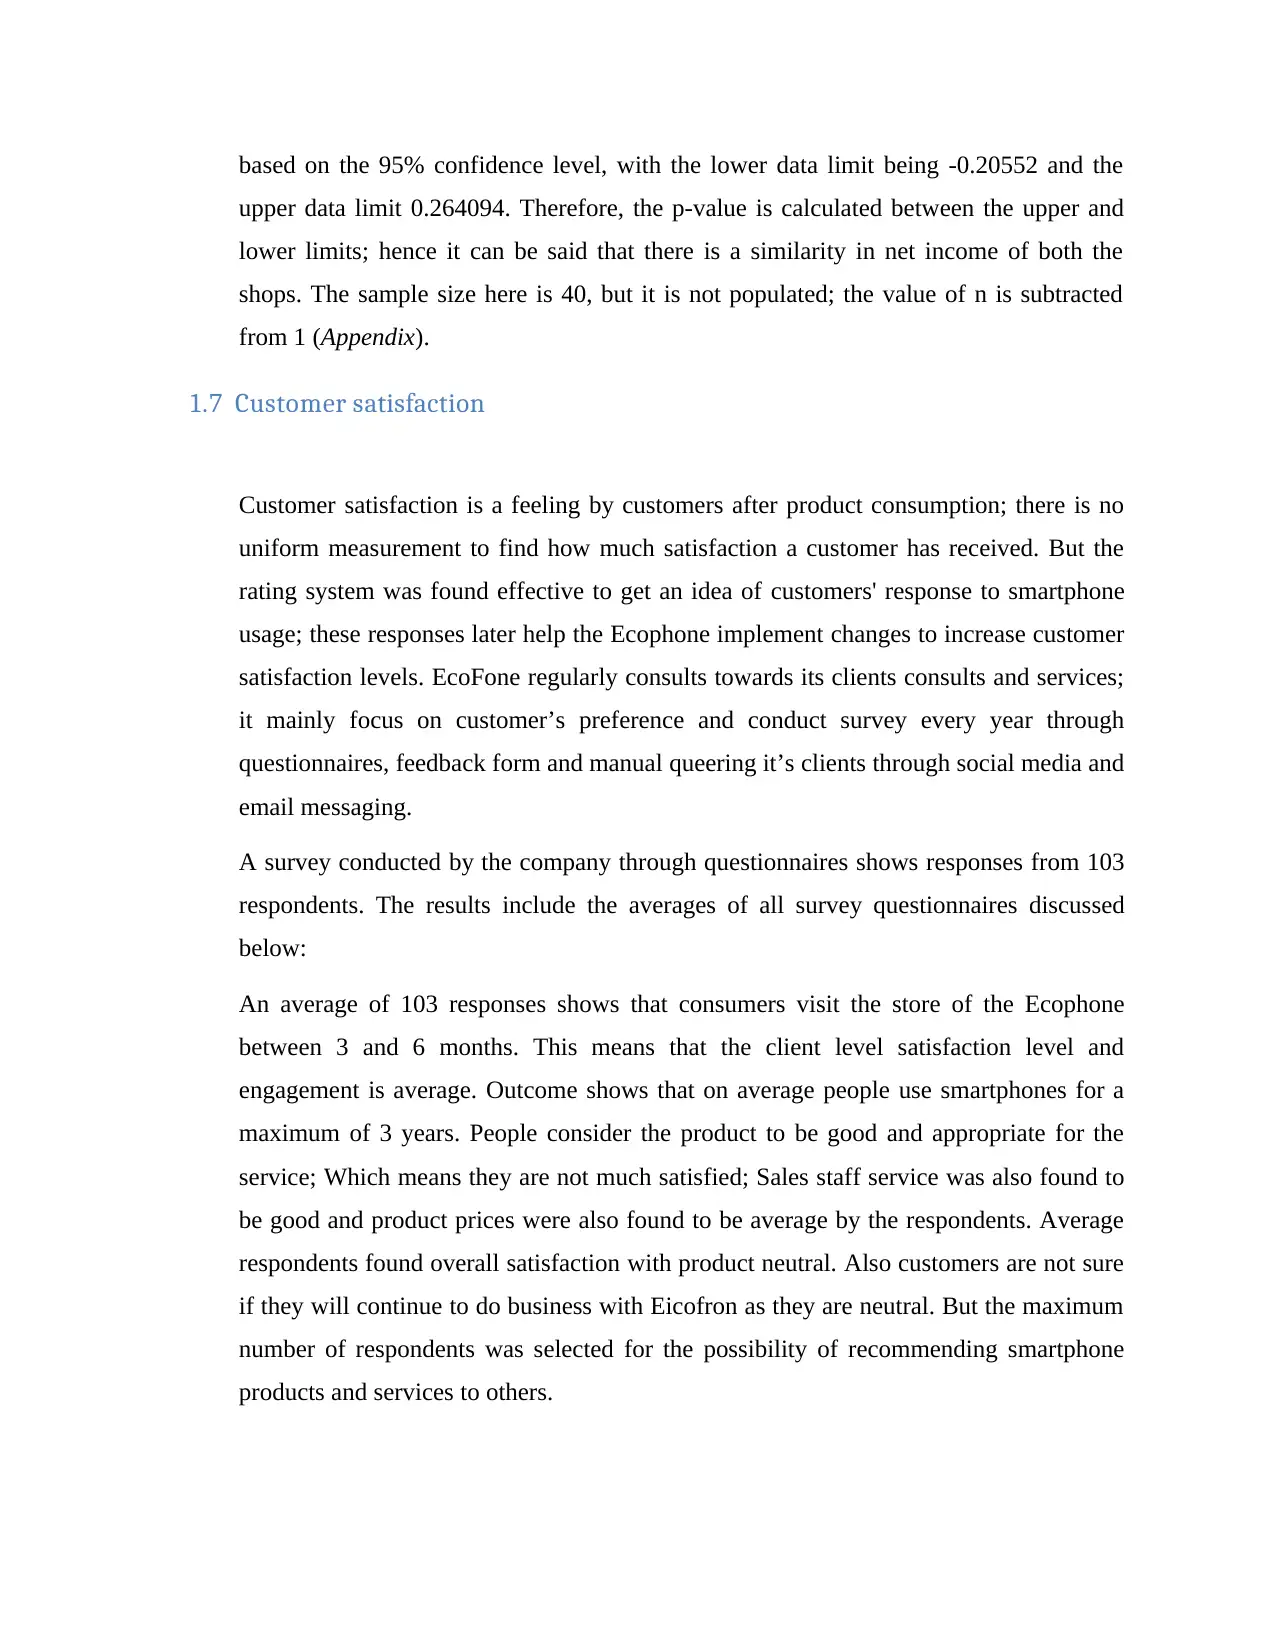
1.6 Testing the possible difference in Net Takings in the two shops
To identify difference test conducted on two retail outlets of Eco-Fone to ascertain
whether there was any segregation or similarity in the net being received by the two
shops. For this test; 40 daily net takings were sampled by both stores; and the mean of
the first shop was calculated as the standard deviation of £ 100 and £ 20; whereas the
calculation for shop two is £ 90 and a standard deviation of £ 40. Analyzing the data
from both the stores, it was found that the second branch has more variety in net taking
as compared to the first shop. The method applied to find the relationship between the
two is the "coefficient of variation" because no other information is provided other than
providing the mean, standard deviation, and sample size (Correlation in excel, 2013). The
excess from this p value is calculated to make adjustments with a 5% significance level.
The test result shows that the p-value is 0.099017 and the data range has been calculated
(Small business prices, 2020)
1.6 Testing the possible difference in Net Takings in the two shops
To identify difference test conducted on two retail outlets of Eco-Fone to ascertain
whether there was any segregation or similarity in the net being received by the two
shops. For this test; 40 daily net takings were sampled by both stores; and the mean of
the first shop was calculated as the standard deviation of £ 100 and £ 20; whereas the
calculation for shop two is £ 90 and a standard deviation of £ 40. Analyzing the data
from both the stores, it was found that the second branch has more variety in net taking
as compared to the first shop. The method applied to find the relationship between the
two is the "coefficient of variation" because no other information is provided other than
providing the mean, standard deviation, and sample size (Correlation in excel, 2013). The
excess from this p value is calculated to make adjustments with a 5% significance level.
The test result shows that the p-value is 0.099017 and the data range has been calculated
⊘ This is a preview!⊘
Do you want full access?
Subscribe today to unlock all pages.
Trusted by 1+ million students worldwide
based on the 95% confidence level, with the lower data limit being -0.20552 and the
upper data limit 0.264094. Therefore, the p-value is calculated between the upper and
lower limits; hence it can be said that there is a similarity in net income of both the
shops. The sample size here is 40, but it is not populated; the value of n is subtracted
from 1 (Appendix).
1.7 Customer satisfaction
Customer satisfaction is a feeling by customers after product consumption; there is no
uniform measurement to find how much satisfaction a customer has received. But the
rating system was found effective to get an idea of customers' response to smartphone
usage; these responses later help the Ecophone implement changes to increase customer
satisfaction levels. EcoFone regularly consults towards its clients consults and services;
it mainly focus on customer’s preference and conduct survey every year through
questionnaires, feedback form and manual queering it’s clients through social media and
email messaging.
A survey conducted by the company through questionnaires shows responses from 103
respondents. The results include the averages of all survey questionnaires discussed
below:
An average of 103 responses shows that consumers visit the store of the Ecophone
between 3 and 6 months. This means that the client level satisfaction level and
engagement is average. Outcome shows that on average people use smartphones for a
maximum of 3 years. People consider the product to be good and appropriate for the
service; Which means they are not much satisfied; Sales staff service was also found to
be good and product prices were also found to be average by the respondents. Average
respondents found overall satisfaction with product neutral. Also customers are not sure
if they will continue to do business with Eicofron as they are neutral. But the maximum
number of respondents was selected for the possibility of recommending smartphone
products and services to others.
Paraphrase This Document
Need a fresh take? Get an instant paraphrase of this document with our AI Paraphraser
1.8 Quality Procedures
The accounting department received an average of two return invoices out of 10,000
invoices; the quality team has set a target of such error not exceeding 15% in a month.
Here the Poisson distribution method is applied because the data size is 10,000 with an
error percentage of 1% on average; The Poisson distribution method is the best
available case for testing such large samples. (Poison Distribution, 2020).
Therefore for above mentioned reasons Poisson distribution method found best fitted
with above case. Calculation of probability having more than 3 errors in invoices has
done below:
P(x ≤ 2, 2) = P(0;2) + P(1;2) + P(2;2)
= [(e-2)(20)/0!] + [(e-2)(21)/1!] + [(e-2)(22)/2!]
= 68%
There's 68% chance of error less than 2 in one month
Hence, probability of error more than 3 in one month will be:
= 100 -68 = 32%
The minimum percentage to meet quality was set not more
than 15% but actual data shows that probability of error
occurring more than 3 in one month is 32%; therefore it can
be declared that quality has not met
Hence, on the basis of above result it can be concluded that quality procedures have not
been met which was 15% and actual variations is 32%. EcoFone requires more steps to
improve its quality and reduce 30% chance to below 15%.
Conclusion
So, after analyses of whole report it can be concluded that relationship between the two stores
during various tests, checking customer satisfaction levels and quality assurance tests; It was
found that there is a positive correlation between net earnings by both EcoFone stores as their net
earnings are the same. The level of customer satisfaction of all 103 respondents indicates a
neutral response; which is an important issue for the company and the initiative should be taken
by the company to increase the level of customer satisfaction.
⊘ This is a preview!⊘
Do you want full access?
Subscribe today to unlock all pages.
Trusted by 1+ million students worldwide
1 out of 19
Related Documents


Your All-in-One AI-Powered Toolkit for Academic Success.
+13062052269
info@desklib.com
Available 24*7 on WhatsApp / Email
![[object Object]](/_next/static/media/star-bottom.7253800d.svg)
Unlock your academic potential
Copyright © 2020–2026 A2Z Services. All Rights Reserved. Developed and managed by ZUCOL.