ECO FONE: Market Analysis, Forecasting, and Feasibility Report
VerifiedAdded on 2021/02/20
|18
|2624
|48
Report
AI Summary
This report, focused on the Eco Fone company, offers a detailed analysis of the UK mobile phone market, including smartphone usage trends and forecasting for the adult population. The report investigates the potential market for smartphones among older customers, highlighting features that appeal to this demographic. A feasibility study is conducted to assess the expansion of the business to Kingston, evaluating pros and cons. The report includes financial analysis, such as calculating the cost of a new building and testing the differences in net takings between two shops. Furthermore, the report addresses customer satisfaction using Poisson distribution and concludes with key findings regarding the importance of smartphones in daily life and the company's efforts to improve customer satisfaction through quality products. The report provides market analysis, forecasting, feasibility studies, and statistical approaches.

ECO FONE Report
Paraphrase This Document
Need a fresh take? Get an instant paraphrase of this document with our AI Paraphraser
TABLE OF CONTENTS
INTRODUCTION...........................................................................................................................1
TASK 1............................................................................................................................................1
a. Overview of market relating to mobile phone in UK..............................................................1
b. graph........................................................................................................................................1
TASK 2............................................................................................................................................2
2. Forecasting the use of the adult smartphone in UK................................................................2
Line chart....................................................................................................................................2
Task 3...............................................................................................................................................4
3. Smartphones as the potential market for the older customers.................................................4
TASK 4............................................................................................................................................4
4. Feasibility study in relation to expansion of the business to the Kingston by using the table4
TASK 5............................................................................................................................................5
a. Computing the cost of the New building................................................................................5
b. Logos of eight companies.......................................................................................................7
TASK 6............................................................................................................................................7
6. Testing the difference in the Net taking of two shops............................................................7
TASK 7............................................................................................................................................9
7. Customer Satisfaction.............................................................................................................9
TASK 8..........................................................................................................................................10
8. Quality procedures & poisson distribution...........................................................................10
TASK 10........................................................................................................................................10
10. Conclusion and the findings................................................................................................10
TASK 9..........................................................................................................................................12
REFERENCES..............................................................................................................................12
APPENDIX....................................................................................................................................14
APPENDIX....................................................................................................................................14
Q.1 (b).......................................................................................................................................14
Q.2.............................................................................................................................................14

Q.5.............................................................................................................................................14
⊘ This is a preview!⊘
Do you want full access?
Subscribe today to unlock all pages.
Trusted by 1+ million students worldwide
INTRODUCTION
Mobile phones are referred as the wireless device which allows the users in making and
receiving the calls and for other purposes like messaging, accessing internet etc (Jacobs and et.
al., 2017). It means the cellular phones having an integrated computer attached to the telephones
like operating system, software applications and web browsing. The present study is based on
Eco-fone company, dealing in the production of the smartphones (Lumber and et. al., 2017).
Furthermore, the report includes detailed research regarding the market of mobile phone in the
UK and its uses among the older customer. Moreover, it also includes various statistical
approaches fro analysing the position and the performance of the company.
TASK 1
a. Overview of market relating to mobile phone in UK.
In accordance with research made it has been assessed that from the total population in
the UK that is around 33.5 million, most of the people are at the work that is 32 million
(Cardano, 2018). As per the information researched it is been identified that the major persons
who are presently in the employment were using their smartphones in relation to at least one of
the business activity. Specifically, smartphones are commonly used by the workers for the
purpose of making e-mails (44%), calendar management (23%) and the voice calls (34%).
However, those application in the smartphones that are been difficult as using like reporting
systems and the legacy information are having very low usage (Harter and Easter, 2018). It has
also been viewed that there are many of the unofficial application in smartphones which are been
used within the enterprise like mobile browsers, messaging, photo applications and navigation. It
has been reviewed that 43% of workers makes use of the WhatsApp application at least one time
in a day. On the other state, it has been reported that only 5% of the workers make use of their
smartphones in order to submit the time sheet, 4% for submitting the expense and 6% does this
for accessing the intranet.
b. graph
Usage of smartphones 2016 2017
Emails 41.00% 37.00%
Making standard calls 33.00% 32.00%
Managing workload 8.00% 6.00%
1
Paraphrase This Document
Need a fresh take? Get an instant paraphrase of this document with our AI Paraphraser
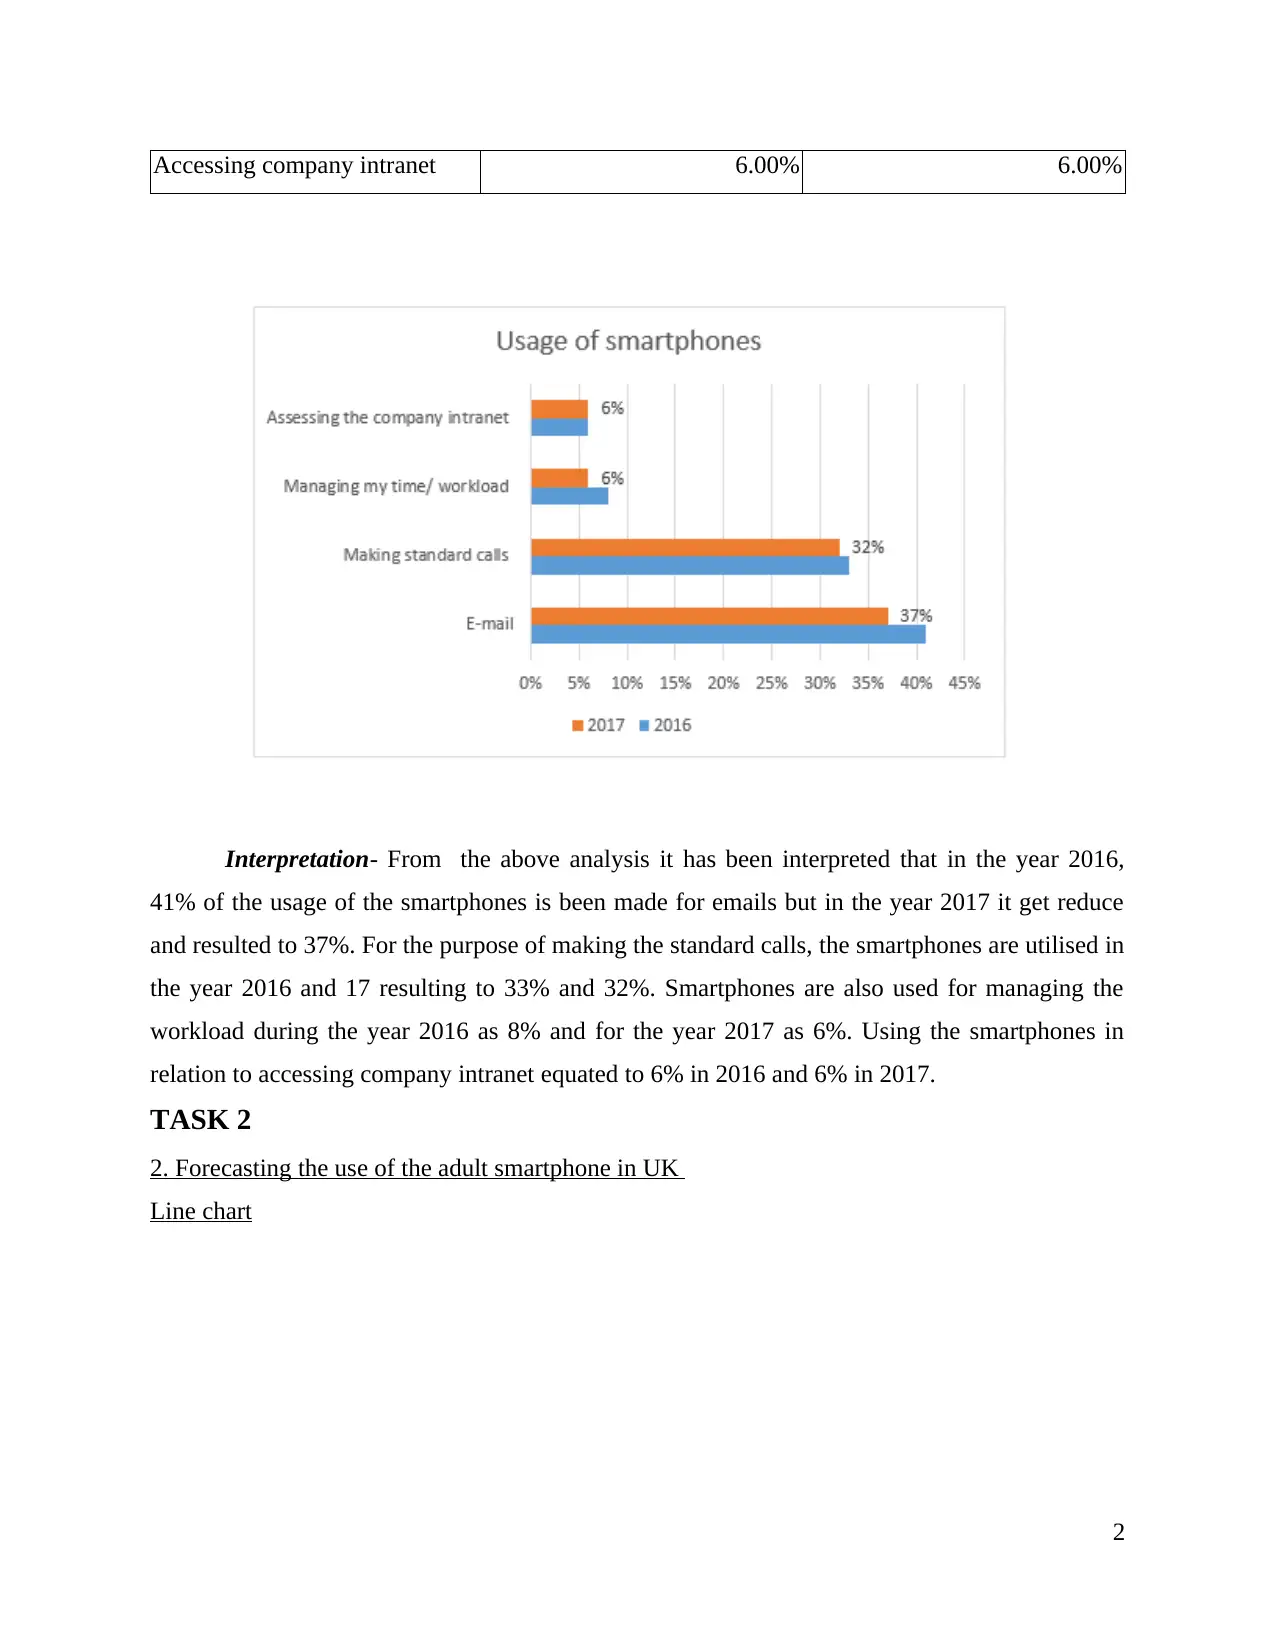
Accessing company intranet 6.00% 6.00%
Interpretation- From the above analysis it has been interpreted that in the year 2016,
41% of the usage of the smartphones is been made for emails but in the year 2017 it get reduce
and resulted to 37%. For the purpose of making the standard calls, the smartphones are utilised in
the year 2016 and 17 resulting to 33% and 32%. Smartphones are also used for managing the
workload during the year 2016 as 8% and for the year 2017 as 6%. Using the smartphones in
relation to accessing company intranet equated to 6% in 2016 and 6% in 2017.
TASK 2
2. Forecasting the use of the adult smartphone in UK
Line chart
2
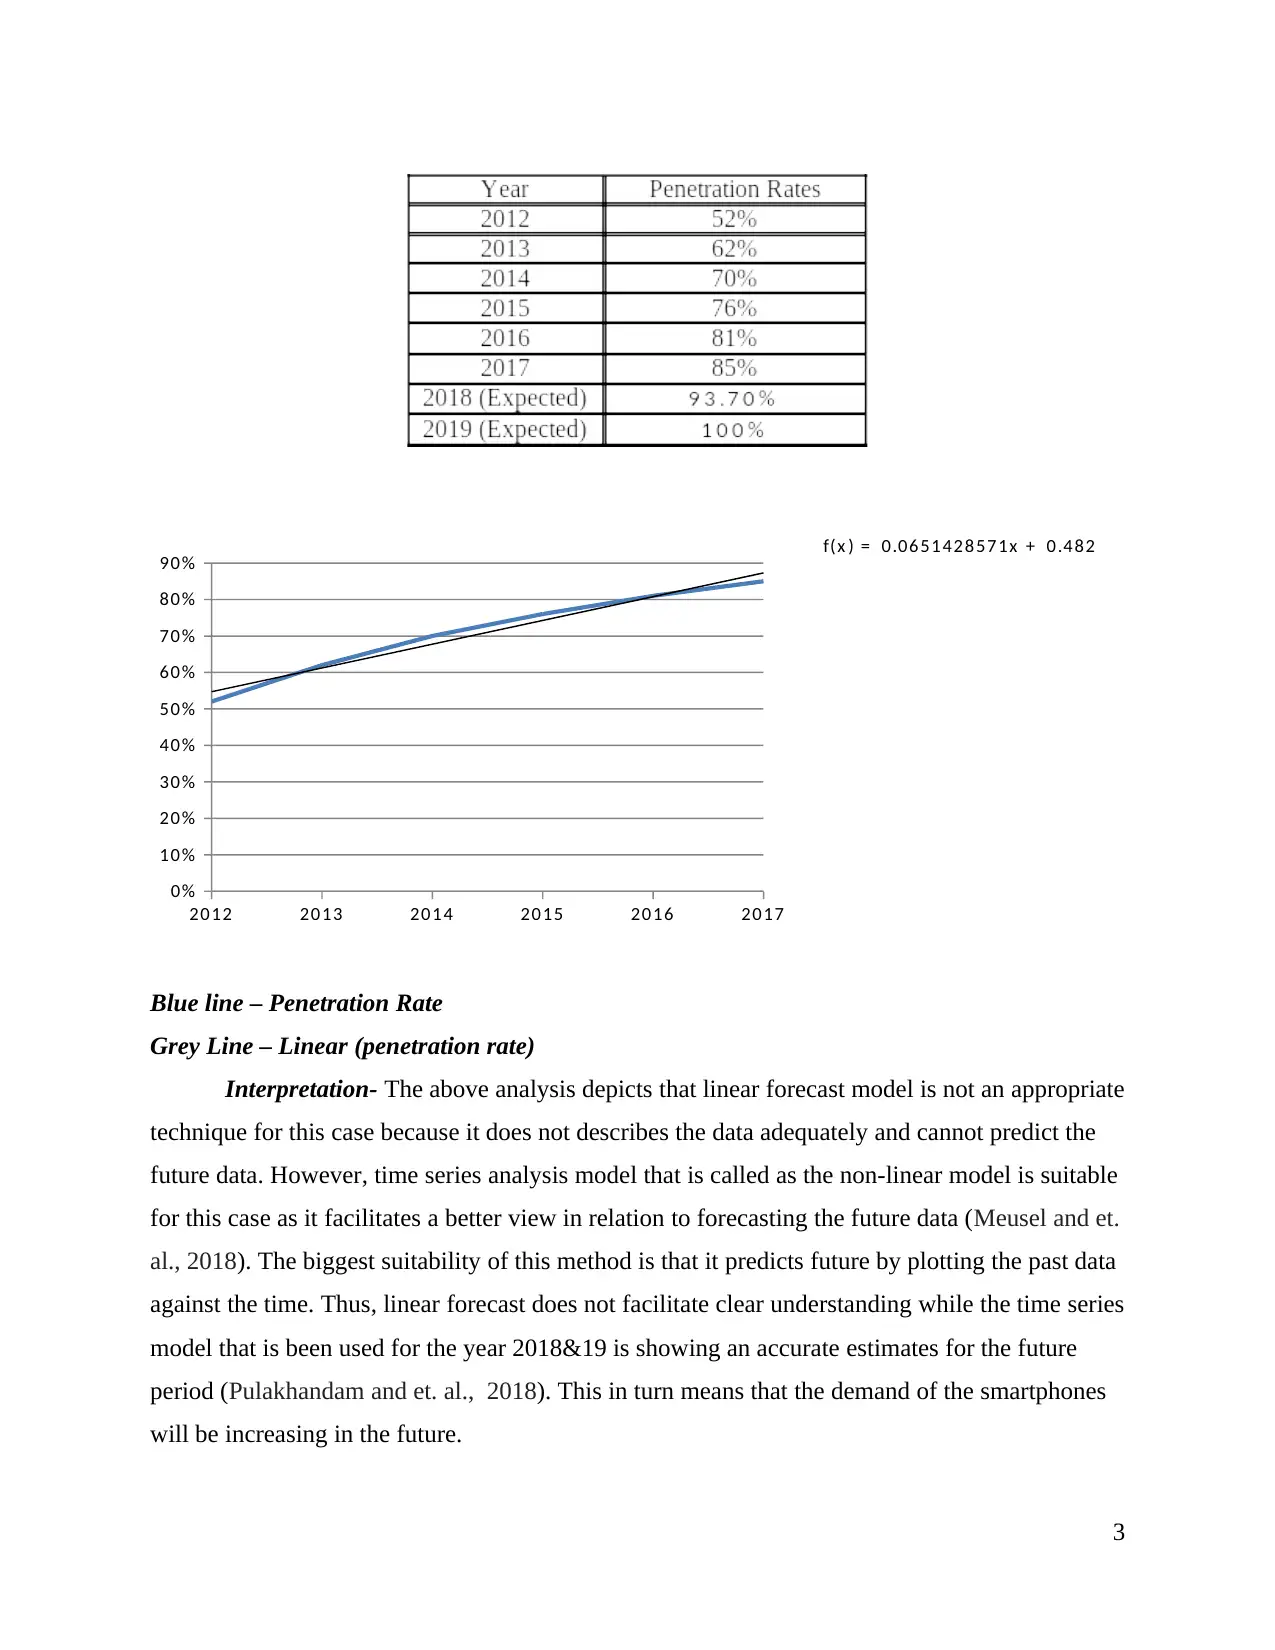
Blue line – Penetration Rate
Grey Line – Linear (penetration rate)
Interpretation- The above analysis depicts that linear forecast model is not an appropriate
technique for this case because it does not describes the data adequately and cannot predict the
future data. However, time series analysis model that is called as the non-linear model is suitable
for this case as it facilitates a better view in relation to forecasting the future data (Meusel and et.
al., 2018). The biggest suitability of this method is that it predicts future by plotting the past data
against the time. Thus, linear forecast does not facilitate clear understanding while the time series
model that is been used for the year 2018&19 is showing an accurate estimates for the future
period (Pulakhandam and et. al., 2018). This in turn means that the demand of the smartphones
will be increasing in the future.
3
2012 2013 2014 2015 2016 2017
0%
10%
20%
30%
40%
50%
60%
70%
80%
90% f(x ) = 0.0651428571x + 0.482
⊘ This is a preview!⊘
Do you want full access?
Subscribe today to unlock all pages.
Trusted by 1+ million students worldwide
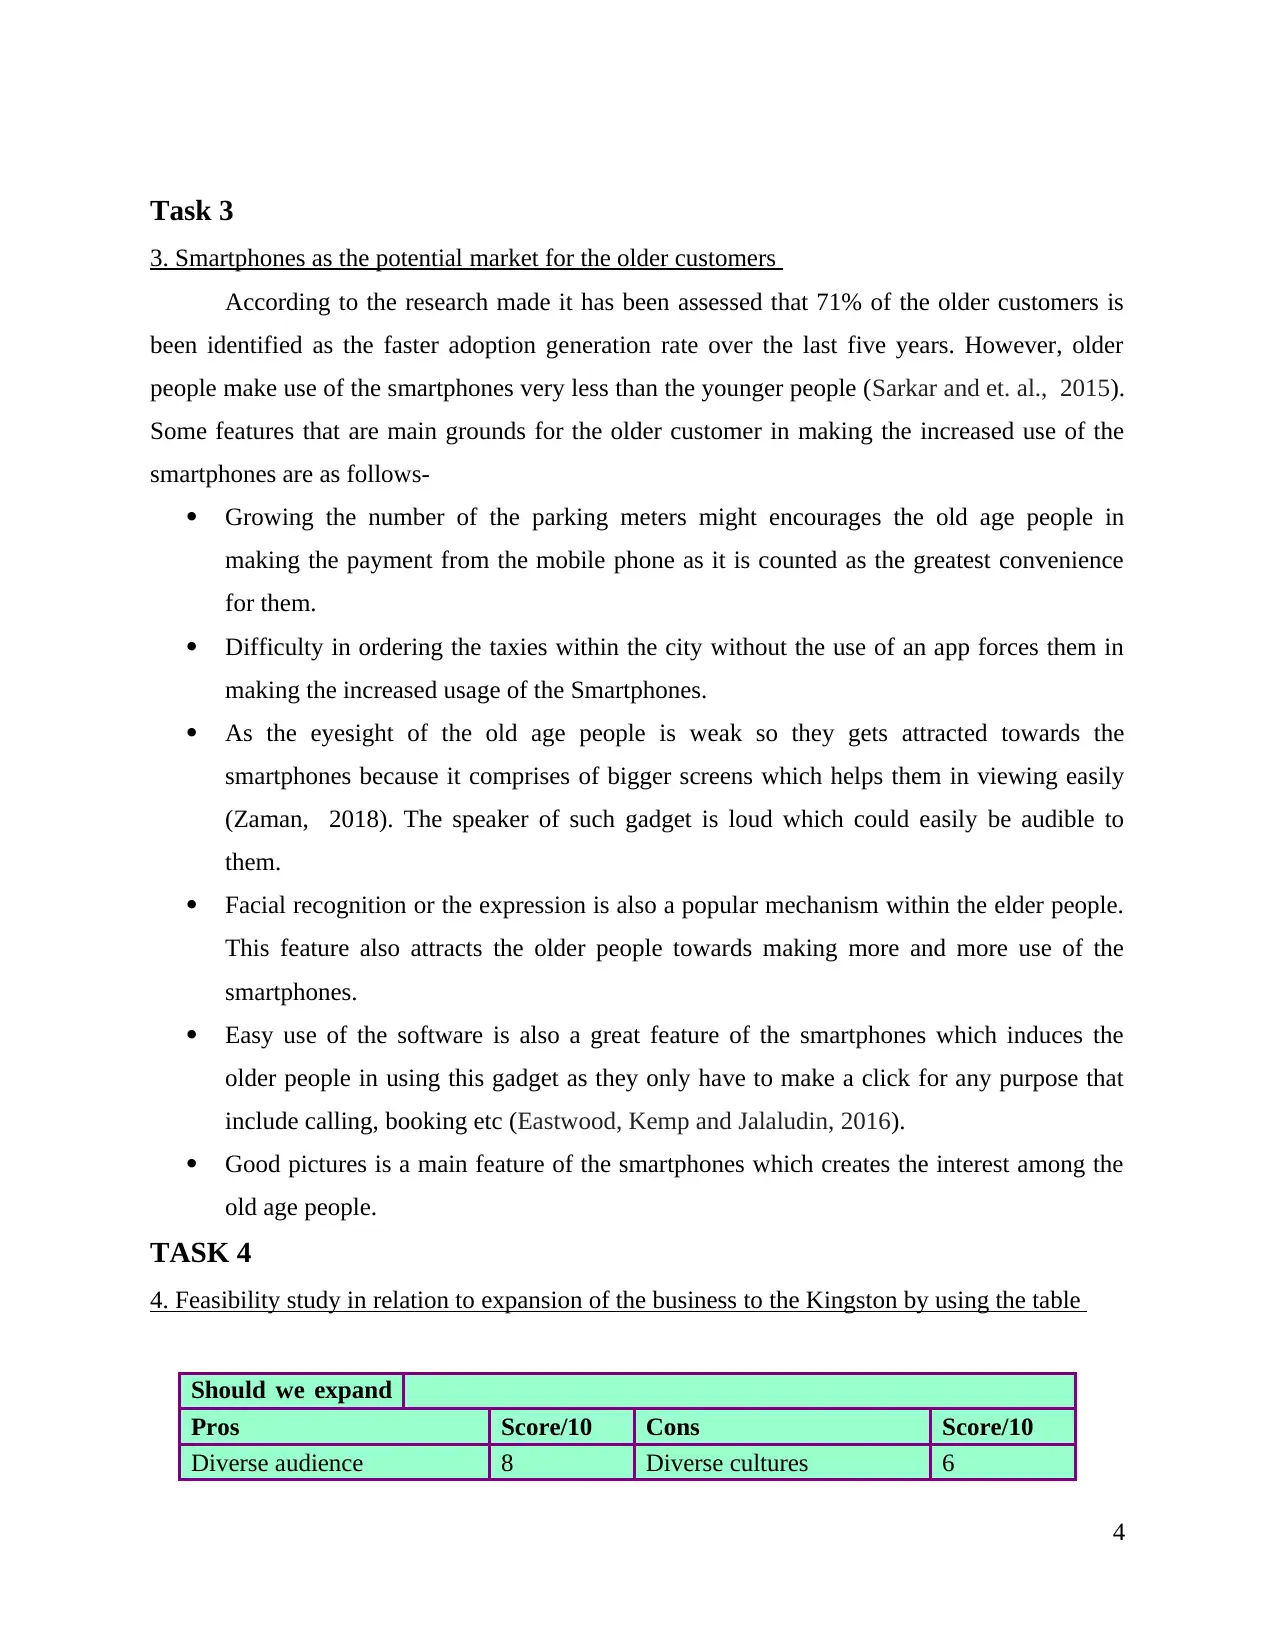
Task 3
3. Smartphones as the potential market for the older customers
According to the research made it has been assessed that 71% of the older customers is
been identified as the faster adoption generation rate over the last five years. However, older
people make use of the smartphones very less than the younger people (Sarkar and et. al., 2015).
Some features that are main grounds for the older customer in making the increased use of the
smartphones are as follows-
Growing the number of the parking meters might encourages the old age people in
making the payment from the mobile phone as it is counted as the greatest convenience
for them.
Difficulty in ordering the taxies within the city without the use of an app forces them in
making the increased usage of the Smartphones.
As the eyesight of the old age people is weak so they gets attracted towards the
smartphones because it comprises of bigger screens which helps them in viewing easily
(Zaman, 2018). The speaker of such gadget is loud which could easily be audible to
them.
Facial recognition or the expression is also a popular mechanism within the elder people.
This feature also attracts the older people towards making more and more use of the
smartphones.
Easy use of the software is also a great feature of the smartphones which induces the
older people in using this gadget as they only have to make a click for any purpose that
include calling, booking etc (Eastwood, Kemp and Jalaludin, 2016).
Good pictures is a main feature of the smartphones which creates the interest among the
old age people.
TASK 4
4. Feasibility study in relation to expansion of the business to the Kingston by using the table
Should we expand
our business toPros Score/10 Cons Score/10
Diverse audience 8 Diverse cultures 6
4
Paraphrase This Document
Need a fresh take? Get an instant paraphrase of this document with our AI Paraphraser
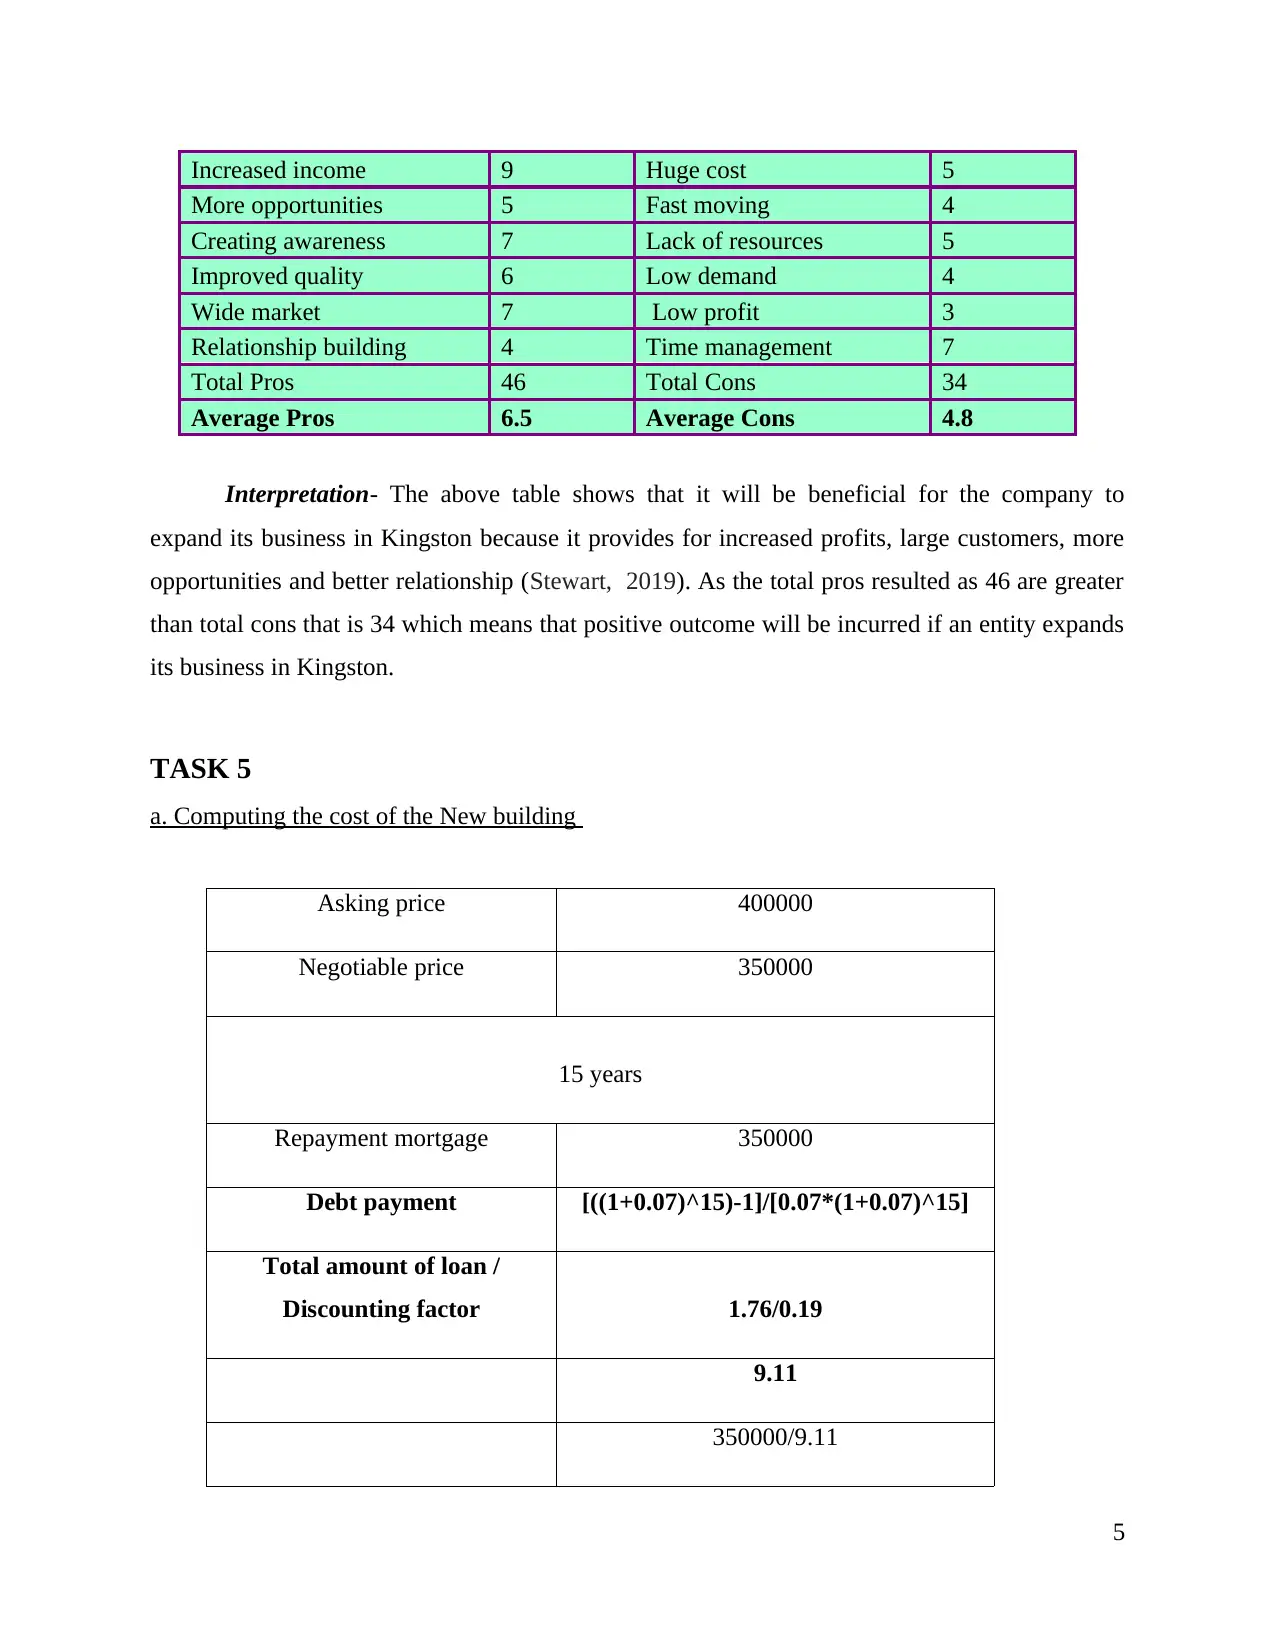
Increased income 9 Huge cost 5
More opportunities 5 Fast moving 4
Creating awareness 7 Lack of resources 5
Improved quality 6 Low demand 4
Wide market 7 Low profit 3
Relationship building 4 Time management 7
Total Pros 46 Total Cons 34
Average Pros 6.5 Average Cons 4.8
Interpretation- The above table shows that it will be beneficial for the company to
expand its business in Kingston because it provides for increased profits, large customers, more
opportunities and better relationship (Stewart, 2019). As the total pros resulted as 46 are greater
than total cons that is 34 which means that positive outcome will be incurred if an entity expands
its business in Kingston.
TASK 5
a. Computing the cost of the New building
Asking price 400000
Negotiable price 350000
15 years
Repayment mortgage 350000
Debt payment [((1+0.07)^15)-1]/[0.07*(1+0.07)^15]
Total amount of loan /
Discounting factor 1.76/0.19
9.11
350000/9.11
5
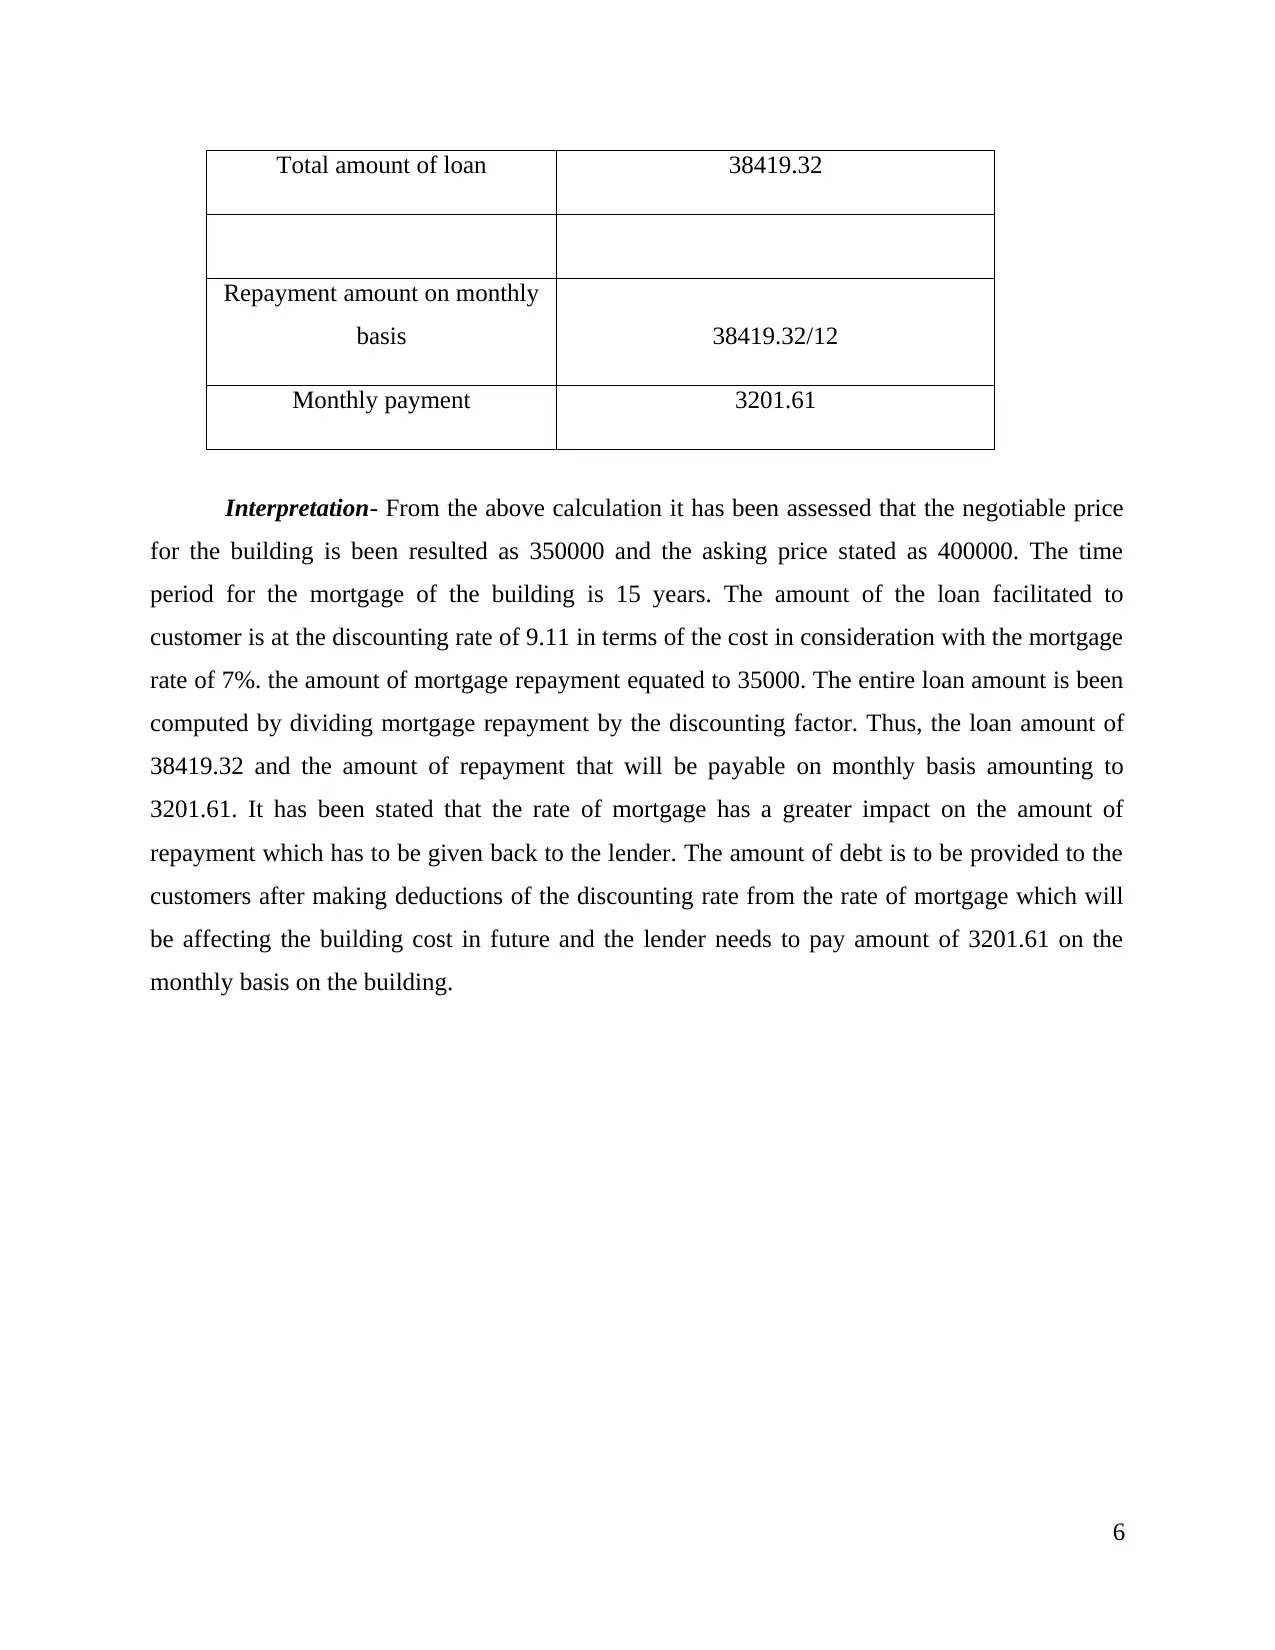
Total amount of loan 38419.32
Repayment amount on monthly
basis 38419.32/12
Monthly payment 3201.61
Interpretation- From the above calculation it has been assessed that the negotiable price
for the building is been resulted as 350000 and the asking price stated as 400000. The time
period for the mortgage of the building is 15 years. The amount of the loan facilitated to
customer is at the discounting rate of 9.11 in terms of the cost in consideration with the mortgage
rate of 7%. the amount of mortgage repayment equated to 35000. The entire loan amount is been
computed by dividing mortgage repayment by the discounting factor. Thus, the loan amount of
38419.32 and the amount of repayment that will be payable on monthly basis amounting to
3201.61. It has been stated that the rate of mortgage has a greater impact on the amount of
repayment which has to be given back to the lender. The amount of debt is to be provided to the
customers after making deductions of the discounting rate from the rate of mortgage which will
be affecting the building cost in future and the lender needs to pay amount of 3201.61 on the
monthly basis on the building.
6
⊘ This is a preview!⊘
Do you want full access?
Subscribe today to unlock all pages.
Trusted by 1+ million students worldwide
b. Logos of eight companies
TASK 6
6. Testing the difference in the Net taking of two shops
Particulars Figure
Sample 40
Average 100s
Standard deviation 20
Second shop
7
TASK 6
6. Testing the difference in the Net taking of two shops
Particulars Figure
Sample 40
Average 100s
Standard deviation 20
Second shop
7
Paraphrase This Document
Need a fresh take? Get an instant paraphrase of this document with our AI Paraphraser
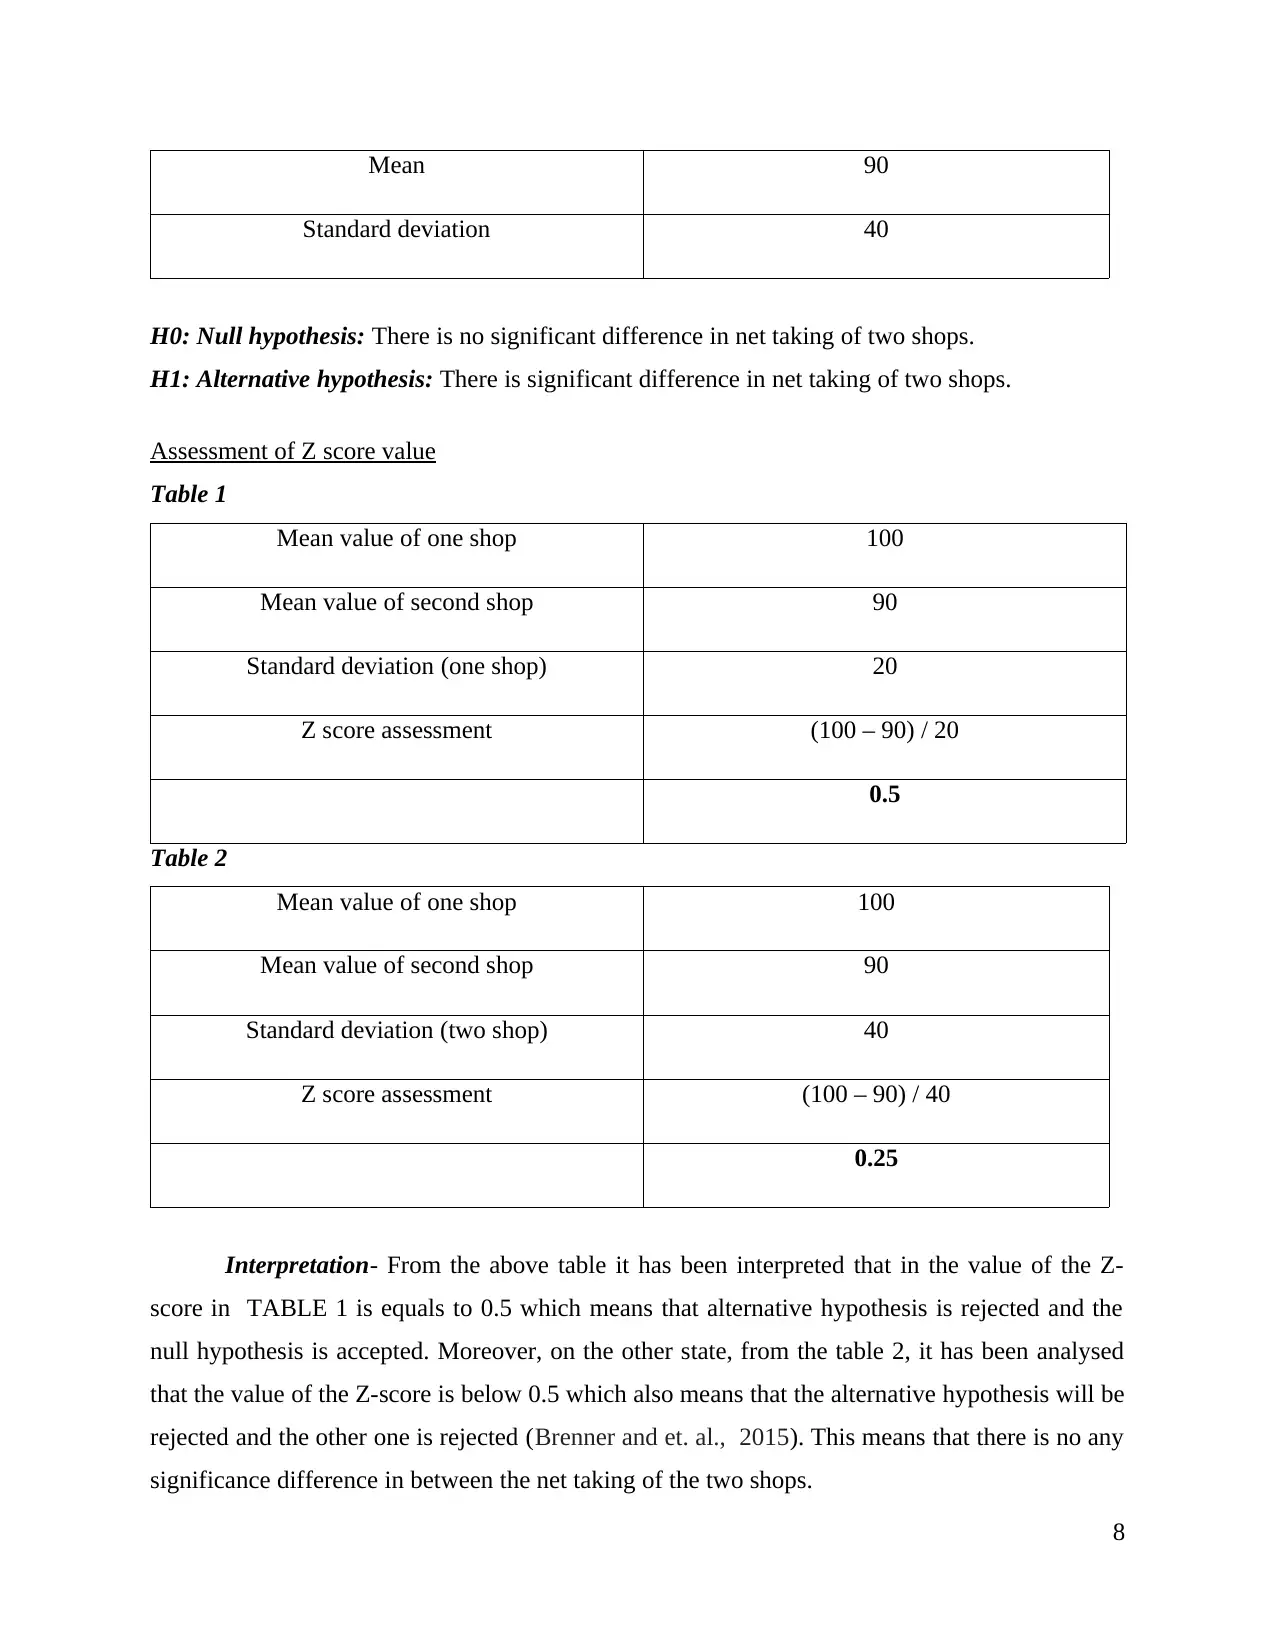
Mean 90
Standard deviation 40
H0: Null hypothesis: There is no significant difference in net taking of two shops.
H1: Alternative hypothesis: There is significant difference in net taking of two shops.
Assessment of Z score value
Table 1
Mean value of one shop 100
Mean value of second shop 90
Standard deviation (one shop) 20
Z score assessment (100 – 90) / 20
0.5
Table 2
Mean value of one shop 100
Mean value of second shop 90
Standard deviation (two shop) 40
Z score assessment (100 – 90) / 40
0.25
Interpretation- From the above table it has been interpreted that in the value of the Z-
score in TABLE 1 is equals to 0.5 which means that alternative hypothesis is rejected and the
null hypothesis is accepted. Moreover, on the other state, from the table 2, it has been analysed
that the value of the Z-score is below 0.5 which also means that the alternative hypothesis will be
rejected and the other one is rejected (Brenner and et. al., 2015). This means that there is no any
significance difference in between the net taking of the two shops.
8
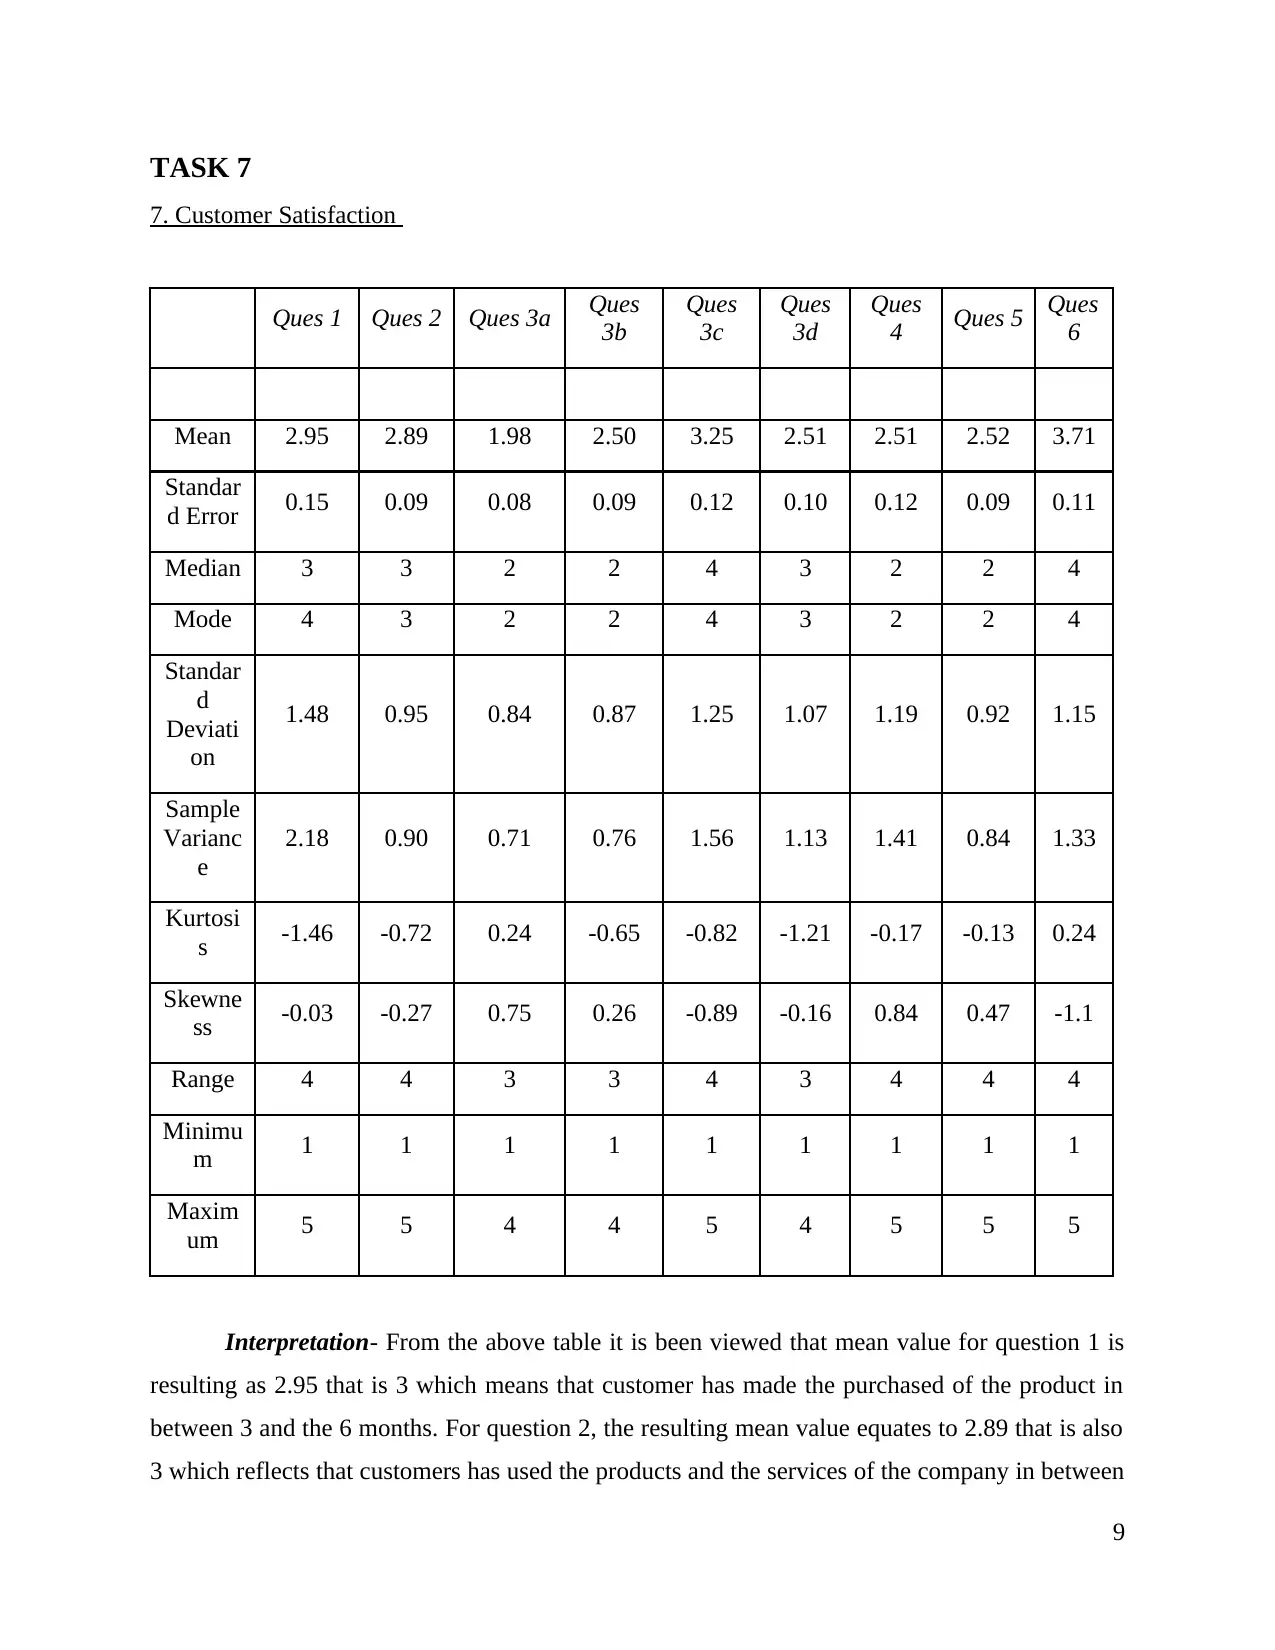
TASK 7
7. Customer Satisfaction
Ques 1 Ques 2 Ques 3a Ques
3b
Ques
3c
Ques
3d
Ques
4 Ques 5 Ques
6
Mean 2.95 2.89 1.98 2.50 3.25 2.51 2.51 2.52 3.71
Standar
d Error 0.15 0.09 0.08 0.09 0.12 0.10 0.12 0.09 0.11
Median 3 3 2 2 4 3 2 2 4
Mode 4 3 2 2 4 3 2 2 4
Standar
d
Deviati
on
1.48 0.95 0.84 0.87 1.25 1.07 1.19 0.92 1.15
Sample
Varianc
e
2.18 0.90 0.71 0.76 1.56 1.13 1.41 0.84 1.33
Kurtosi
s -1.46 -0.72 0.24 -0.65 -0.82 -1.21 -0.17 -0.13 0.24
Skewne
ss -0.03 -0.27 0.75 0.26 -0.89 -0.16 0.84 0.47 -1.1
Range 4 4 3 3 4 3 4 4 4
Minimu
m 1 1 1 1 1 1 1 1 1
Maxim
um 5 5 4 4 5 4 5 5 5
Interpretation- From the above table it is been viewed that mean value for question 1 is
resulting as 2.95 that is 3 which means that customer has made the purchased of the product in
between 3 and the 6 months. For question 2, the resulting mean value equates to 2.89 that is also
3 which reflects that customers has used the products and the services of the company in between
9
⊘ This is a preview!⊘
Do you want full access?
Subscribe today to unlock all pages.
Trusted by 1+ million students worldwide
1 out of 18
Related Documents


Your All-in-One AI-Powered Toolkit for Academic Success.
+13062052269
info@desklib.com
Available 24*7 on WhatsApp / Email
![[object Object]](/_next/static/media/star-bottom.7253800d.svg)
Unlock your academic potential
Copyright © 2020–2026 A2Z Services. All Rights Reserved. Developed and managed by ZUCOL.