Eco-Fone Case Study: Smartphone Market Analysis and Business Expansion
VerifiedAdded on 2021/02/20
|15
|2276
|42
Case Study
AI Summary
This case study examines Eco-Fone, a smartphone company, analyzing the UK mobile phone market, including usage trends and market penetration. It forecasts future smartphone usage using time series analysis and explores the increasing adoption among older customers, highlighting features attracting them. A feasibility study assesses business expansion into Kingston, weighing pros and cons. The study calculates costs for a new building, analyzes Z-scores to compare shop performance, and evaluates customer satisfaction through descriptive statistics and Poisson distribution for quality control. The findings indicate market opportunities, expansion potential, and customer perceptions, offering insights for Eco-Fone's strategic decision-making and future growth.

ECO FONE-CASE STUDY
Paraphrase This Document
Need a fresh take? Get an instant paraphrase of this document with our AI Paraphraser
INTRODUCTION
Mobile phone referred as the devices which is been used by the people for the purpose of
making calls, messaging and accessing the internet. Smartphones are counted as the device along
with the integrated computer attached with the telephones like operating system, software
applications and the browsing of the internet (Zaman, 2018). The present report is based on Eco-
fone, a company that deals in production of the smartphones. Furthermore, the study includes the
overview of the mobile market and assessment of the increased demand of the smartphones.
Moreover, various statistical methods are applied in order to make detailed and accurate analysis
of the company.
TASK 1
a. Profile of the mobile phone market in the UK.
Presently the workforce within the UK, resulted as 33.5 million from the approx 32
million are been working (Cardano, 2018). As per the research made, it has been analysed that
majority of the respondents that are in the employment or working are making the use of the
smartphones at least in relation to one activity that relates with the business. Particularly,
smartphones are been commonly used by the workers mainly for making voice calls resulting to
34%, for calendar management resulted as 23% and for emails 44%. According to the research it
has also been highlighted that unofficial application within the smartphones are widely been used
in an enterprise like mobile browsers, photo, navigation and messaging (Harter and Easter,
2018). Around 43% of the workers makes use of the application called as Whatsapp at least one
time in the entire day. On the other hand, usage of the smartphones for work relating activities is
modest, specifically emphasizing on the work flow, instead of the communications. Around 55%
of the workers uses their smartphones in order to submit the time sheet, 6% for making access of
an intranet and 4% for submitting the expenses (Deloitte. Co, 2019). The paucity involved in the
usage of the smartphones relating to work purposes is not been because of the lack of the need.
The workforce of the UK involves millions people for which the smartphones might be an ideal
device of information.
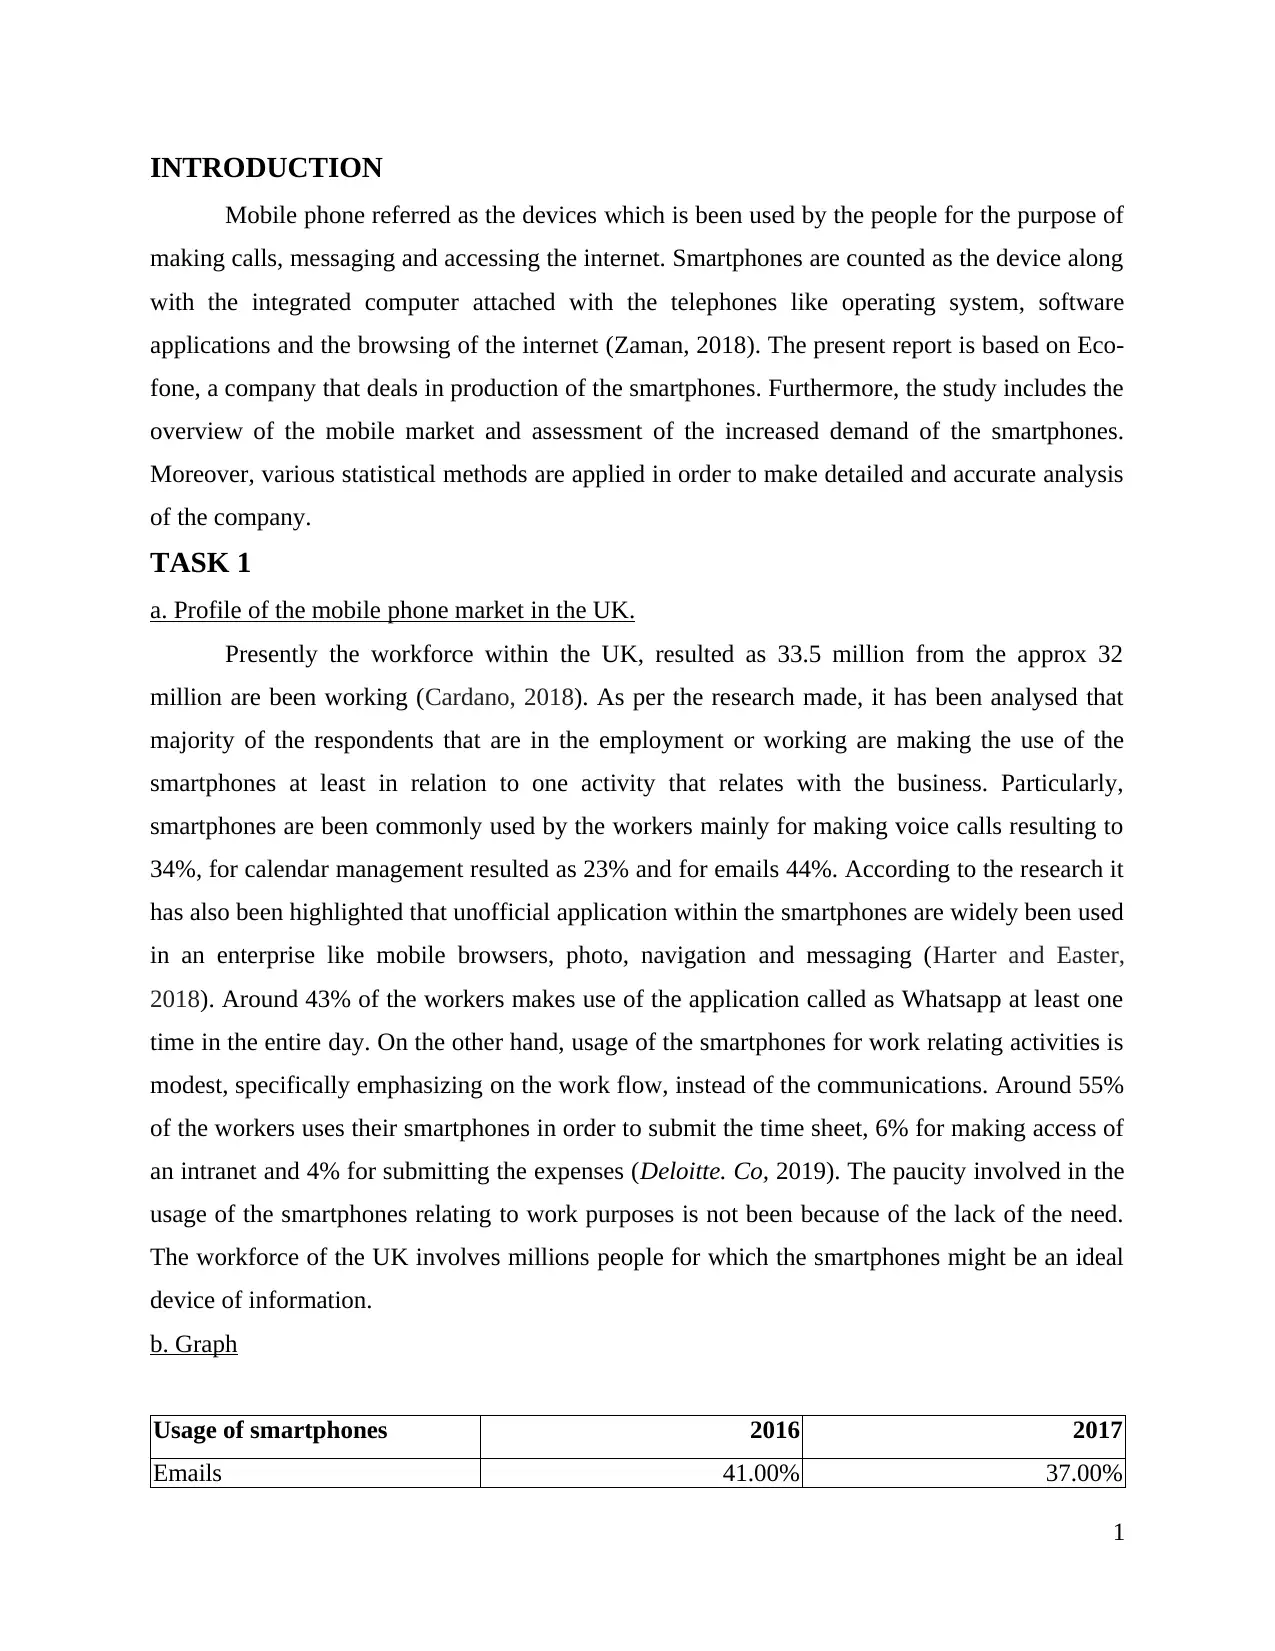
b. Graph
Usage of smartphones 2016 2017
Emails 41.00% 37.00%
1
Mobile phone referred as the devices which is been used by the people for the purpose of
making calls, messaging and accessing the internet. Smartphones are counted as the device along
with the integrated computer attached with the telephones like operating system, software
applications and the browsing of the internet (Zaman, 2018). The present report is based on Eco-
fone, a company that deals in production of the smartphones. Furthermore, the study includes the
overview of the mobile market and assessment of the increased demand of the smartphones.
Moreover, various statistical methods are applied in order to make detailed and accurate analysis
of the company.
TASK 1
a. Profile of the mobile phone market in the UK.
Presently the workforce within the UK, resulted as 33.5 million from the approx 32
million are been working (Cardano, 2018). As per the research made, it has been analysed that
majority of the respondents that are in the employment or working are making the use of the
smartphones at least in relation to one activity that relates with the business. Particularly,
smartphones are been commonly used by the workers mainly for making voice calls resulting to
34%, for calendar management resulted as 23% and for emails 44%. According to the research it
has also been highlighted that unofficial application within the smartphones are widely been used
in an enterprise like mobile browsers, photo, navigation and messaging (Harter and Easter,
2018). Around 43% of the workers makes use of the application called as Whatsapp at least one
time in the entire day. On the other hand, usage of the smartphones for work relating activities is
modest, specifically emphasizing on the work flow, instead of the communications. Around 55%
of the workers uses their smartphones in order to submit the time sheet, 6% for making access of
an intranet and 4% for submitting the expenses (Deloitte. Co, 2019). The paucity involved in the
usage of the smartphones relating to work purposes is not been because of the lack of the need.
The workforce of the UK involves millions people for which the smartphones might be an ideal
device of information.
b. Graph
Usage of smartphones 2016 2017
Emails 41.00% 37.00%
1
⊘ This is a preview!⊘
Do you want full access?
Subscribe today to unlock all pages.
Trusted by 1+ million students worldwide
Making standard calls 33.00% 32.00%
Managing Time or workload 8.00% 6.00%
Using company intranet 6.00% 6.00%
Interpretation- The above graph and the table interpreting that smartphones are mainly
used for making the standard calls as 33% in the year 2016 and 32% in the year 2017.
Smartphones are also been used for making the emails resulting as 41% and 37% in the year
2016 and 2017. In order to manage the time, the usage of the smartphones is been seen as 8% in
2016 and 6% in 2017. Accessing the intranet of the company 6% of use has been made of the
smartphones in both the years.
TASK 2
Forecasting the use of the smartphones by the adult in the UK.
2
Paraphrase This Document
Need a fresh take? Get an instant paraphrase of this document with our AI Paraphraser
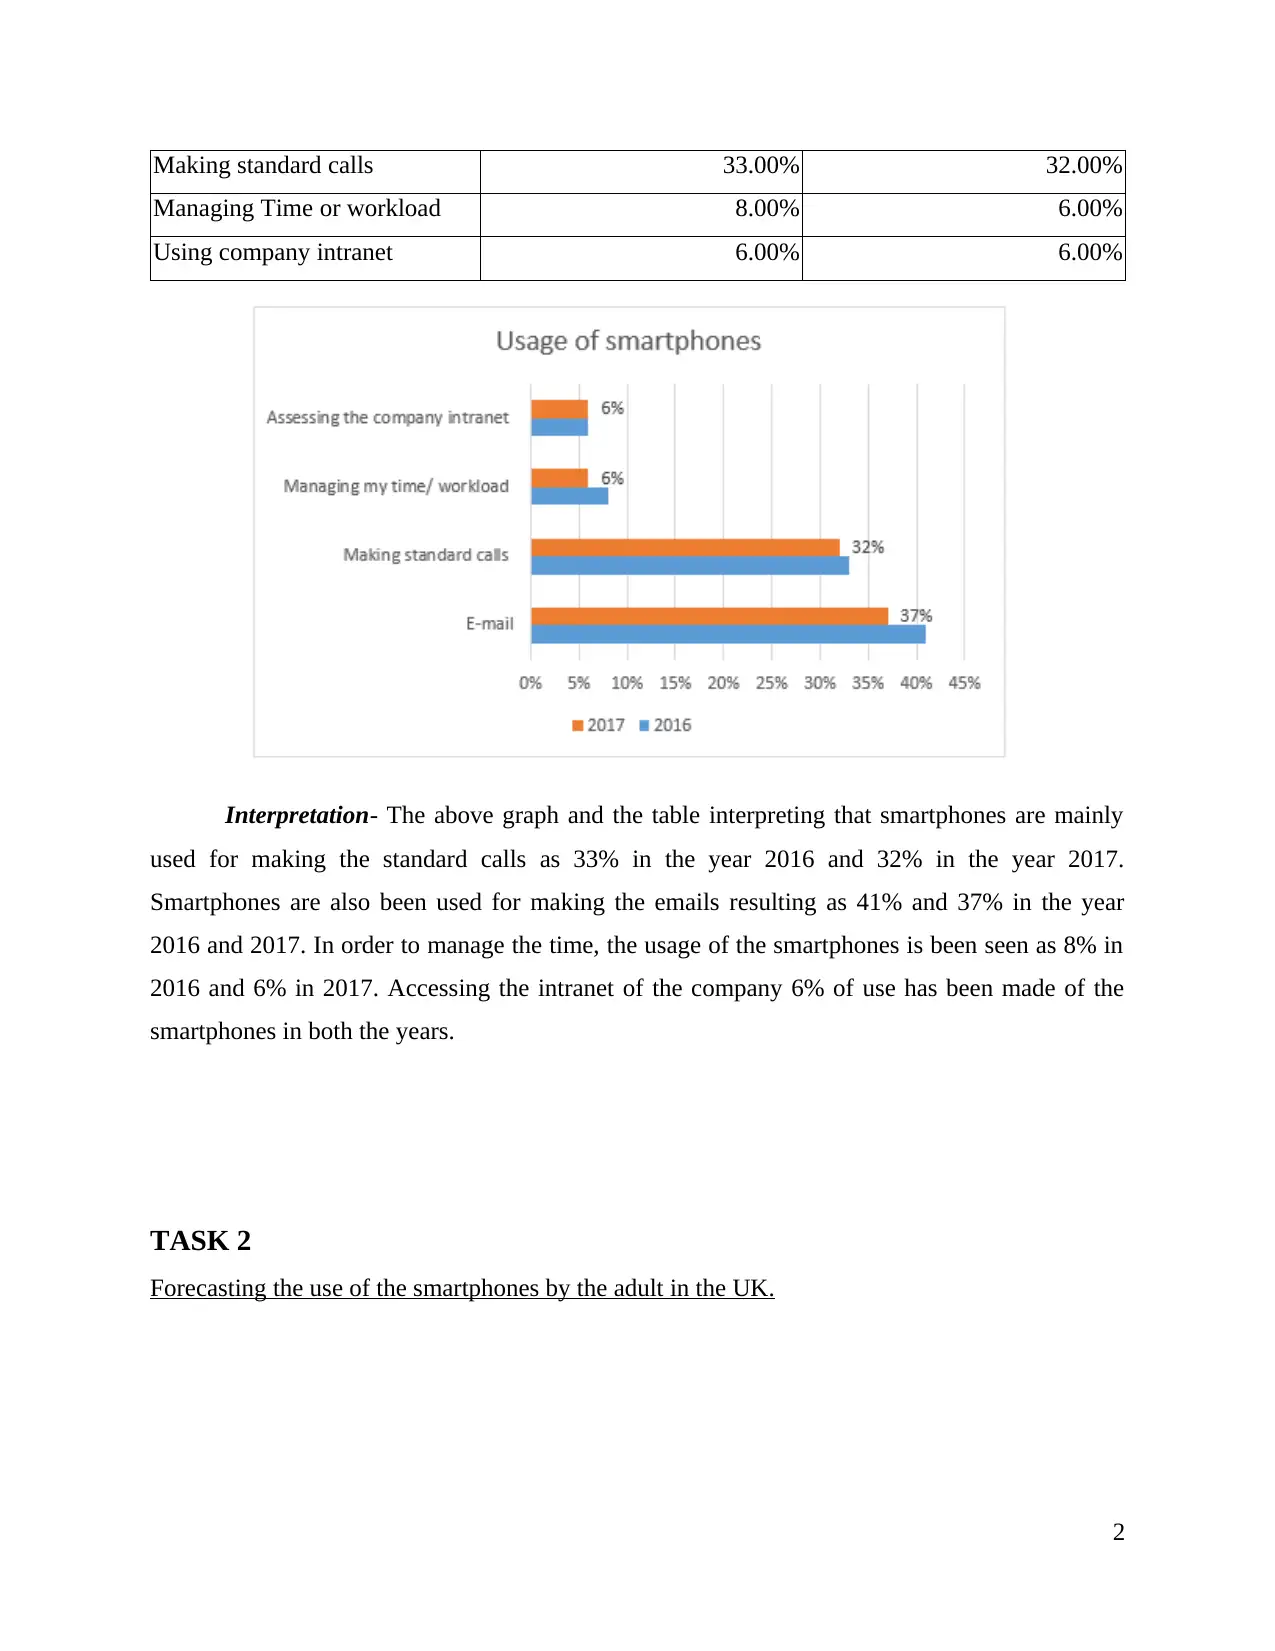
Blue line – Penetration Rate
Grey Line – Linear (penetration rate)
Interpretation- From the above graph it has been stated that linear forecasting model
refers to the model that describes relationship in between the dependent and more than one
independent variable (Lumber and et. al., 2017). This model is not suitable for applying in this
case because it is not an effective model for making the future estimates or it does facilitates
estimation regarding future data. However, by making the use of the time series analysis under
this case, researcher can make accurate estimations in relation to the future. It is the best method
that helps in understanding past and the future as it uses the historical data for conducting the
assessment and aims for forecasting correct rates for the particular future period (Pulakhandam
3
2012 2013 2014 2015 2016 2017
0%
10%
20%
30%
40%
50%
60%
70%
80%
90% f(x ) = 0.0651428571x + 0.482
and et. al., 2018). Moreover as per the resulted penetration rates it has been interpreted that the
usage of the smartphones will be increase over the years.
TASK 3
Increased use of the smartphones by the older customers
Smartphone usage and its sales is resulted as booming with the old age customers in UK
as per the study. It has been stated that around 71% of the old age people are been owing an
capable app handset. In accordance with the research made it has also been assessed that this age
group is been counted as the faster rate of adoption in relation to smartphones in comparison to
other group in the previous five years (Stewart, 2019). However, it has also been highlighted
that the people of demographics seeking for the use of their smartphones lower than the younger
people. For example- around 20% of the people told that they are been checking their mobiles in
15 minutes in comparison to the national average around 56% (Eastwood, Kemp and Jalaludin,
2016). Increased number of the parking meters encourages the older customers in making the
payments through mobile phones as it is considered as the convenience mode of the payment by
them as founded in the recent reports (Jacobs and et. al., 2017). As the old age people faces
difficulty in ordering taxies in the cities so they make use of the app in the smartphones. Bigger
screens and loud speakers are the attractive features due to which the older customers uses the
smartphones in order to makeover from their eyesight problems and listening problems (Meusel
and et. al., 2018). Easy use of the software is a major feature that induces the old age people to
opt for the smartphones as they need to make a click. Facial recognition, a popular feature that
attracts older generations which is been used as a mechanism of authentication. Camera is also
one of the important feature of the smartphones that attracts the older generation for buying it.
Thus the use of the smartphones is been immensely increasing even by the older customers.
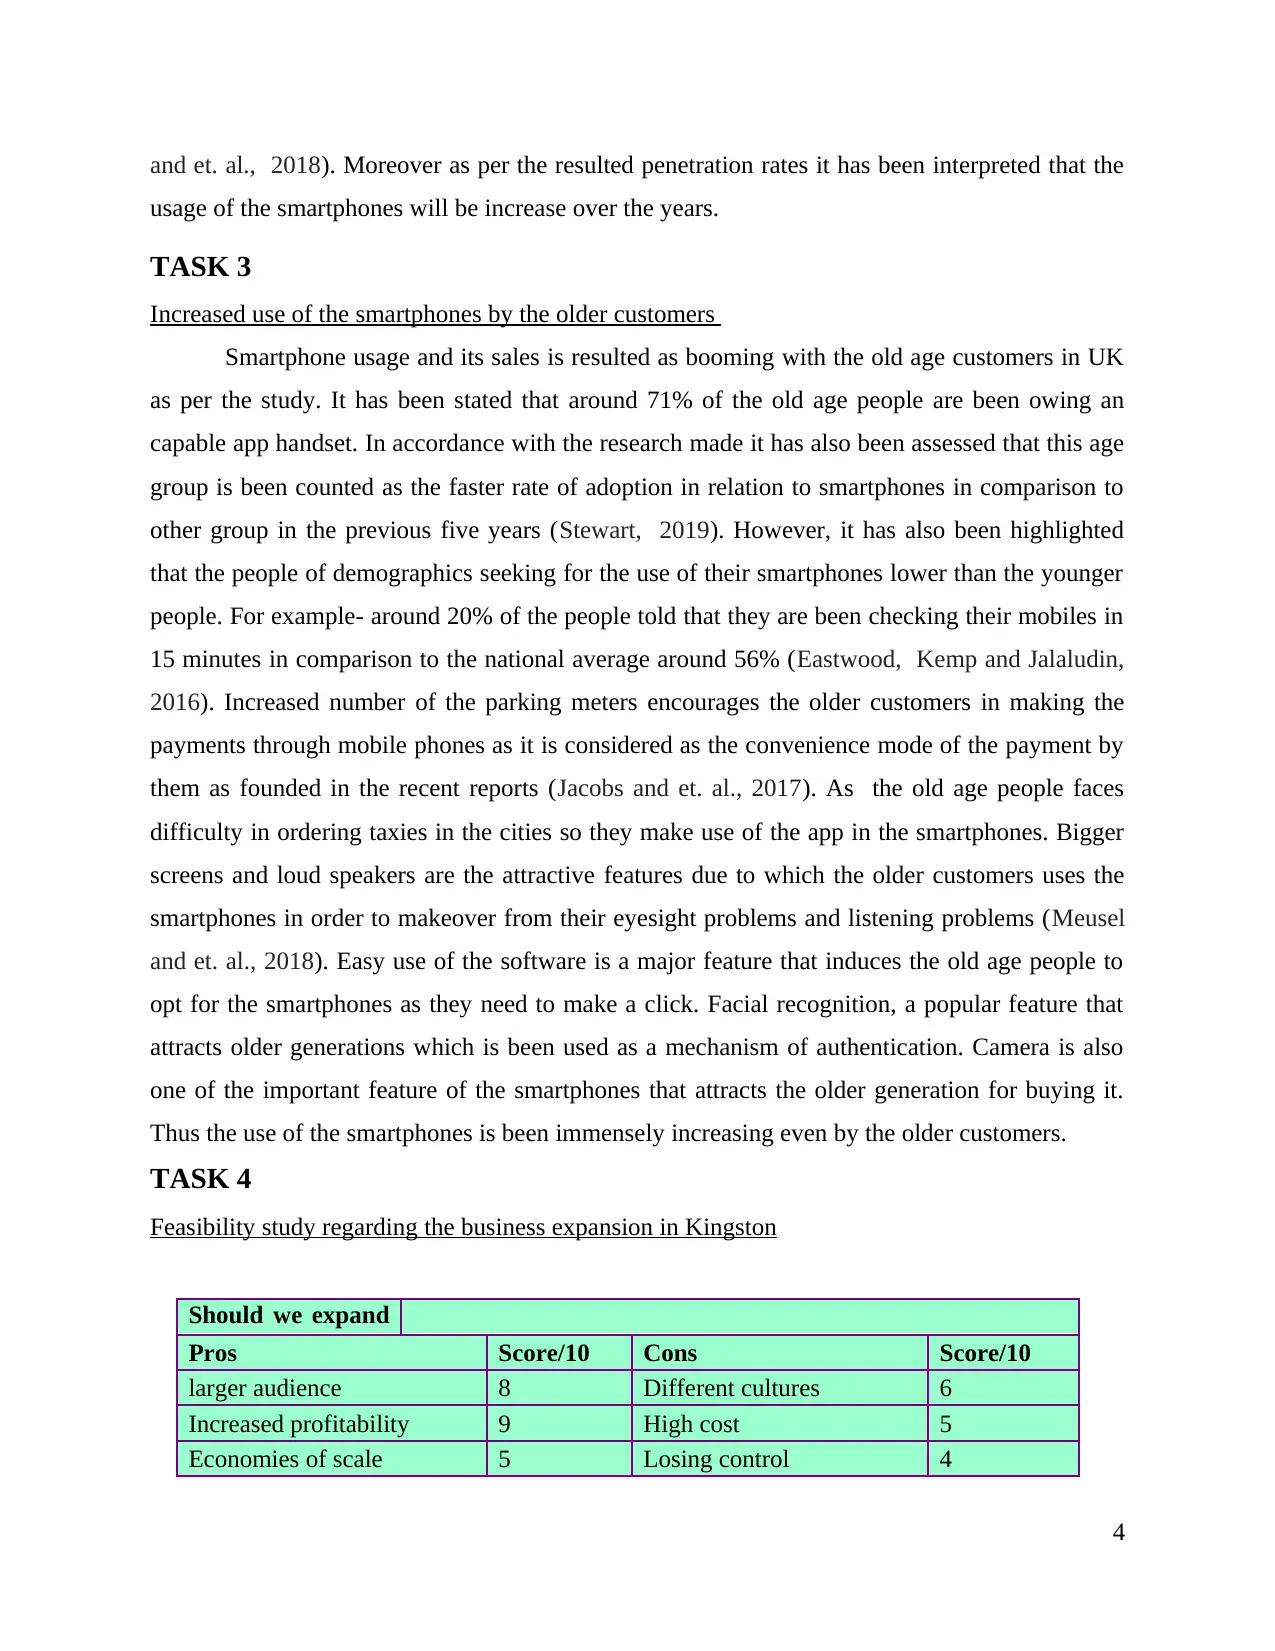
TASK 4
Feasibility study regarding the business expansion in Kingston
Should we expand
our business toPros Score/10 Cons Score/10
larger audience 8 Different cultures 6
Increased profitability 9 High cost 5
Economies of scale 5 Losing control 4
4
usage of the smartphones will be increase over the years.
TASK 3
Increased use of the smartphones by the older customers
Smartphone usage and its sales is resulted as booming with the old age customers in UK
as per the study. It has been stated that around 71% of the old age people are been owing an
capable app handset. In accordance with the research made it has also been assessed that this age
group is been counted as the faster rate of adoption in relation to smartphones in comparison to
other group in the previous five years (Stewart, 2019). However, it has also been highlighted
that the people of demographics seeking for the use of their smartphones lower than the younger
people. For example- around 20% of the people told that they are been checking their mobiles in
15 minutes in comparison to the national average around 56% (Eastwood, Kemp and Jalaludin,
2016). Increased number of the parking meters encourages the older customers in making the
payments through mobile phones as it is considered as the convenience mode of the payment by
them as founded in the recent reports (Jacobs and et. al., 2017). As the old age people faces
difficulty in ordering taxies in the cities so they make use of the app in the smartphones. Bigger
screens and loud speakers are the attractive features due to which the older customers uses the
smartphones in order to makeover from their eyesight problems and listening problems (Meusel
and et. al., 2018). Easy use of the software is a major feature that induces the old age people to
opt for the smartphones as they need to make a click. Facial recognition, a popular feature that
attracts older generations which is been used as a mechanism of authentication. Camera is also
one of the important feature of the smartphones that attracts the older generation for buying it.
Thus the use of the smartphones is been immensely increasing even by the older customers.
TASK 4
Feasibility study regarding the business expansion in Kingston
Should we expand
our business toPros Score/10 Cons Score/10
larger audience 8 Different cultures 6
Increased profitability 9 High cost 5
Economies of scale 5 Losing control 4
4
⊘ This is a preview!⊘
Do you want full access?
Subscribe today to unlock all pages.
Trusted by 1+ million students worldwide
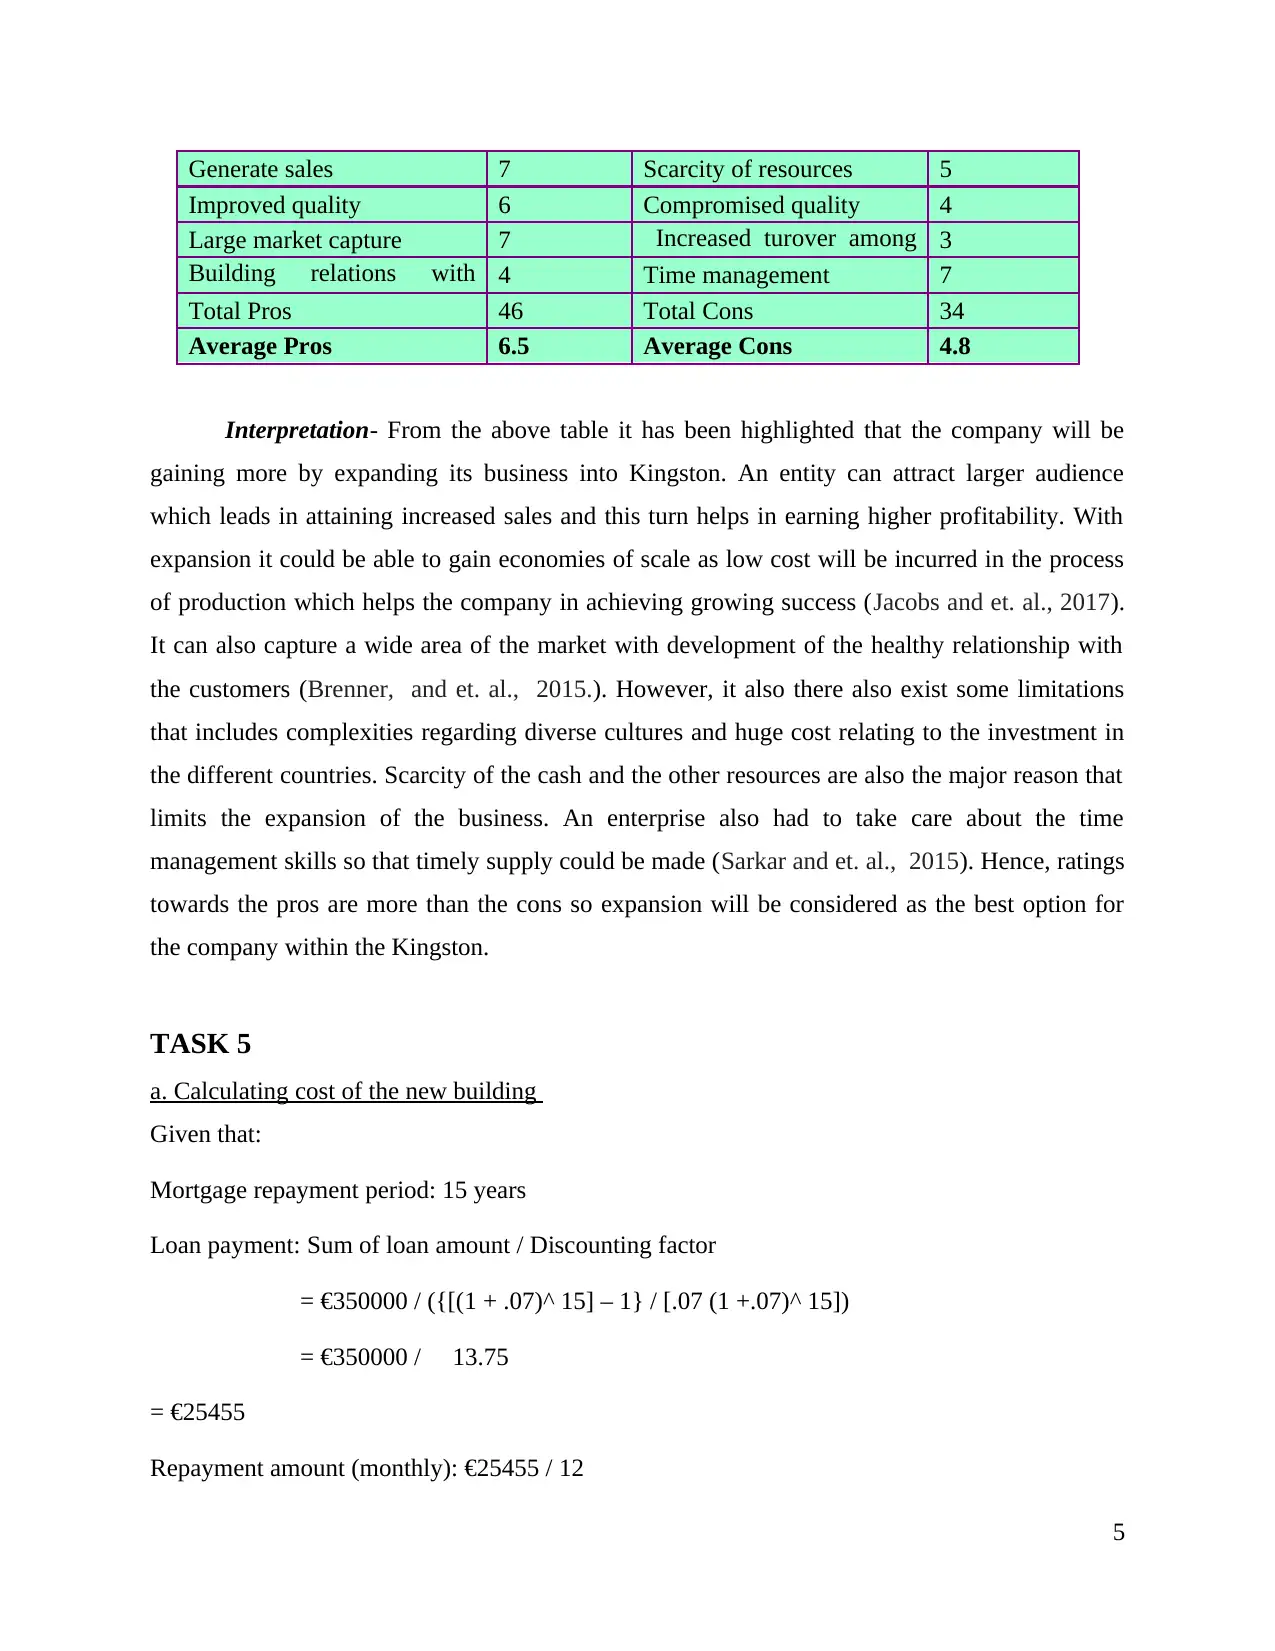
Generate sales 7 Scarcity of resources 5
Improved quality 6 Compromised quality 4
Large market capture 7 Increased turover among
staff
3
Building relations with
customers
4 Time management 7
Total Pros 46 Total Cons 34
Average Pros 6.5 Average Cons 4.8
Interpretation- From the above table it has been highlighted that the company will be
gaining more by expanding its business into Kingston. An entity can attract larger audience
which leads in attaining increased sales and this turn helps in earning higher profitability. With
expansion it could be able to gain economies of scale as low cost will be incurred in the process
of production which helps the company in achieving growing success (Jacobs and et. al., 2017).
It can also capture a wide area of the market with development of the healthy relationship with
the customers (Brenner, and et. al., 2015.). However, it also there also exist some limitations
that includes complexities regarding diverse cultures and huge cost relating to the investment in
the different countries. Scarcity of the cash and the other resources are also the major reason that
limits the expansion of the business. An enterprise also had to take care about the time
management skills so that timely supply could be made (Sarkar and et. al., 2015). Hence, ratings
towards the pros are more than the cons so expansion will be considered as the best option for
the company within the Kingston.
TASK 5
a. Calculating cost of the new building
Given that:
Mortgage repayment period: 15 years
Loan payment: Sum of loan amount / Discounting factor
= €350000 / ({[(1 + .07)^ 15] – 1} / [.07 (1 +.07)^ 15])
= €350000 / 13.75
= €25455
Repayment amount (monthly): €25455 / 12
5
Paraphrase This Document
Need a fresh take? Get an instant paraphrase of this document with our AI Paraphraser
= €2121
Interpretation- The above table depicts that the asking prices amounting to 400000 and
the negotiable prices is amounted to 350000 for the time period of 15 years is been contracted
towards the mortgage of the building. The amount of repaying the mortgage is been stated as
350000 and the sum of loan amount is 13.75 along with the discounting factor of 0.7. The total
amount of the loan evaluated as 25455 and the amount of repayment on monthly basis amounted
to 2121. This value reflects the cost incurred for the mortgaging the new building.
b. logos
6
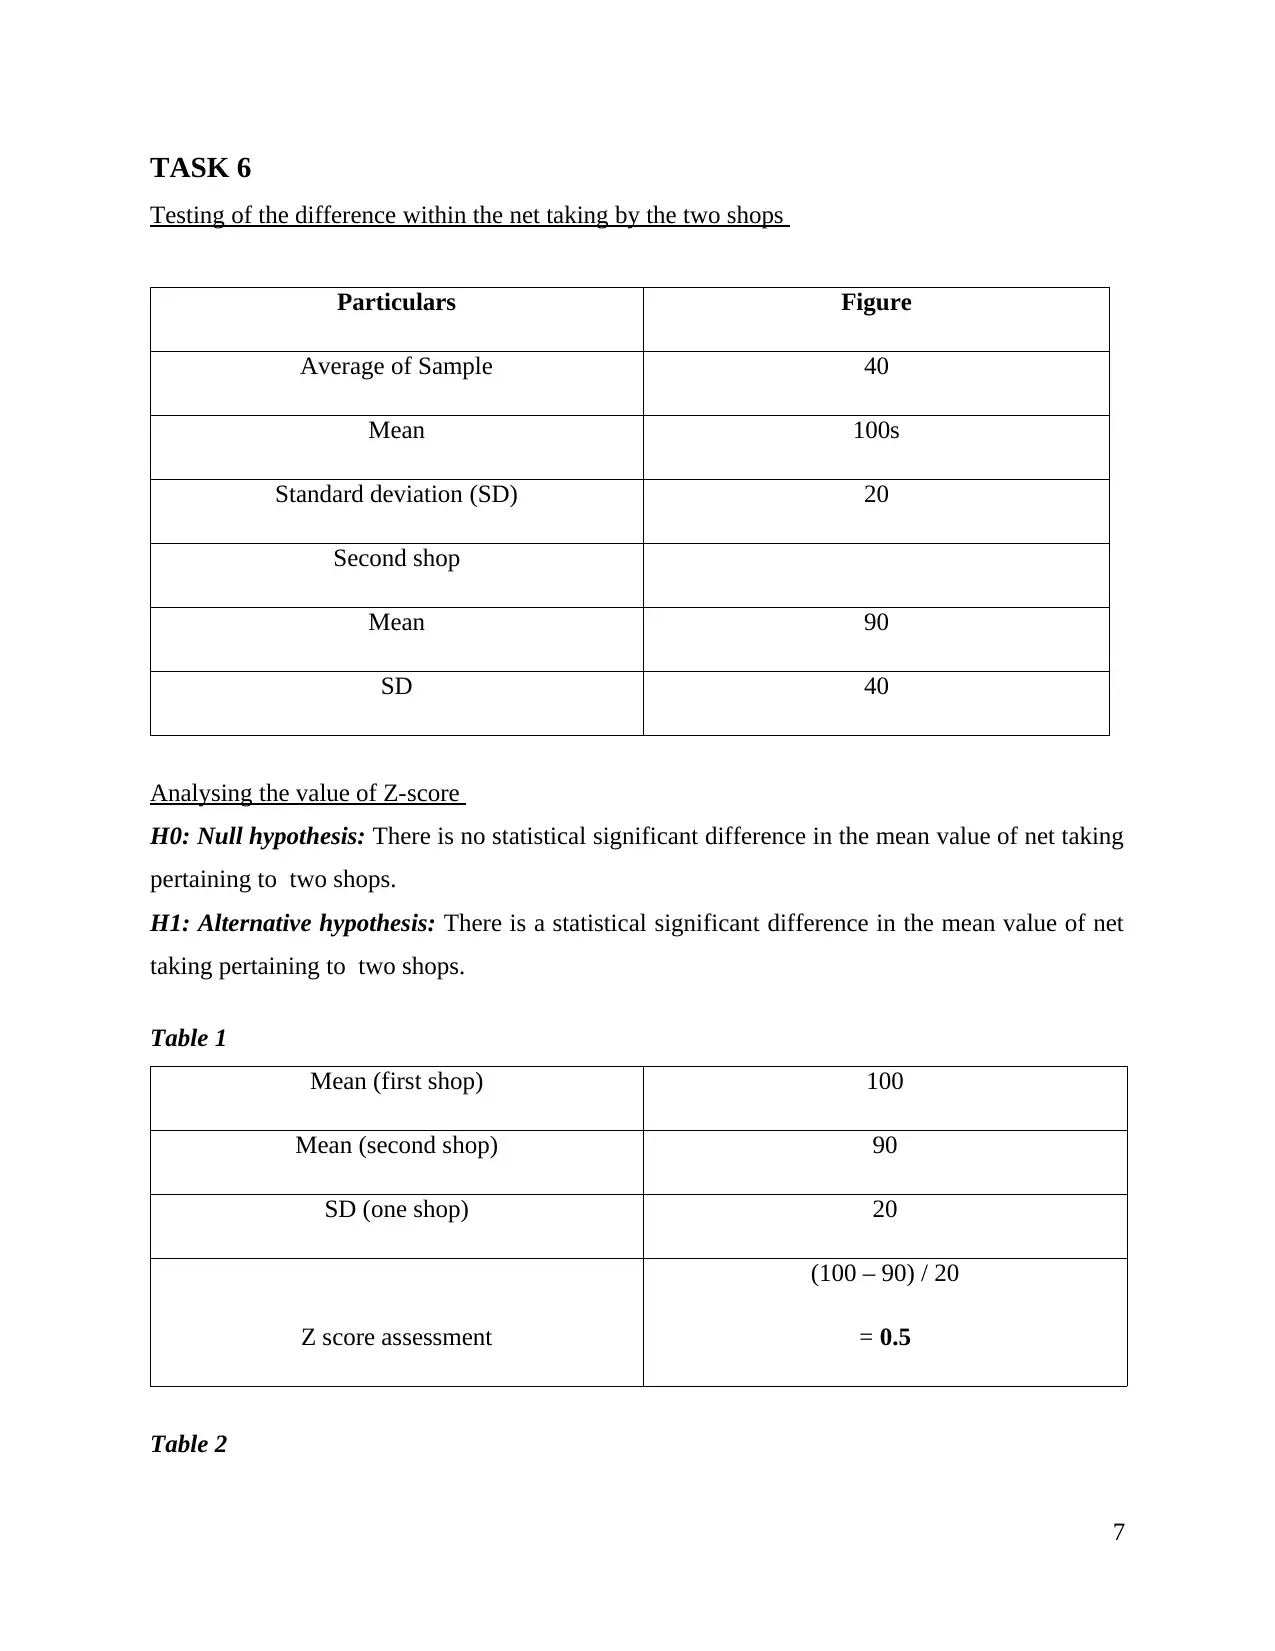
TASK 6
Testing of the difference within the net taking by the two shops
Particulars Figure
Average of Sample 40
Mean 100s
Standard deviation (SD) 20
Second shop
Mean 90
SD 40
Analysing the value of Z-score
H0: Null hypothesis: There is no statistical significant difference in the mean value of net taking
pertaining to two shops.
H1: Alternative hypothesis: There is a statistical significant difference in the mean value of net
taking pertaining to two shops.
Table 1
Mean (first shop) 100
Mean (second shop) 90
SD (one shop) 20
Z score assessment
(100 – 90) / 20
= 0.5
Table 2
7
⊘ This is a preview!⊘
Do you want full access?
Subscribe today to unlock all pages.
Trusted by 1+ million students worldwide
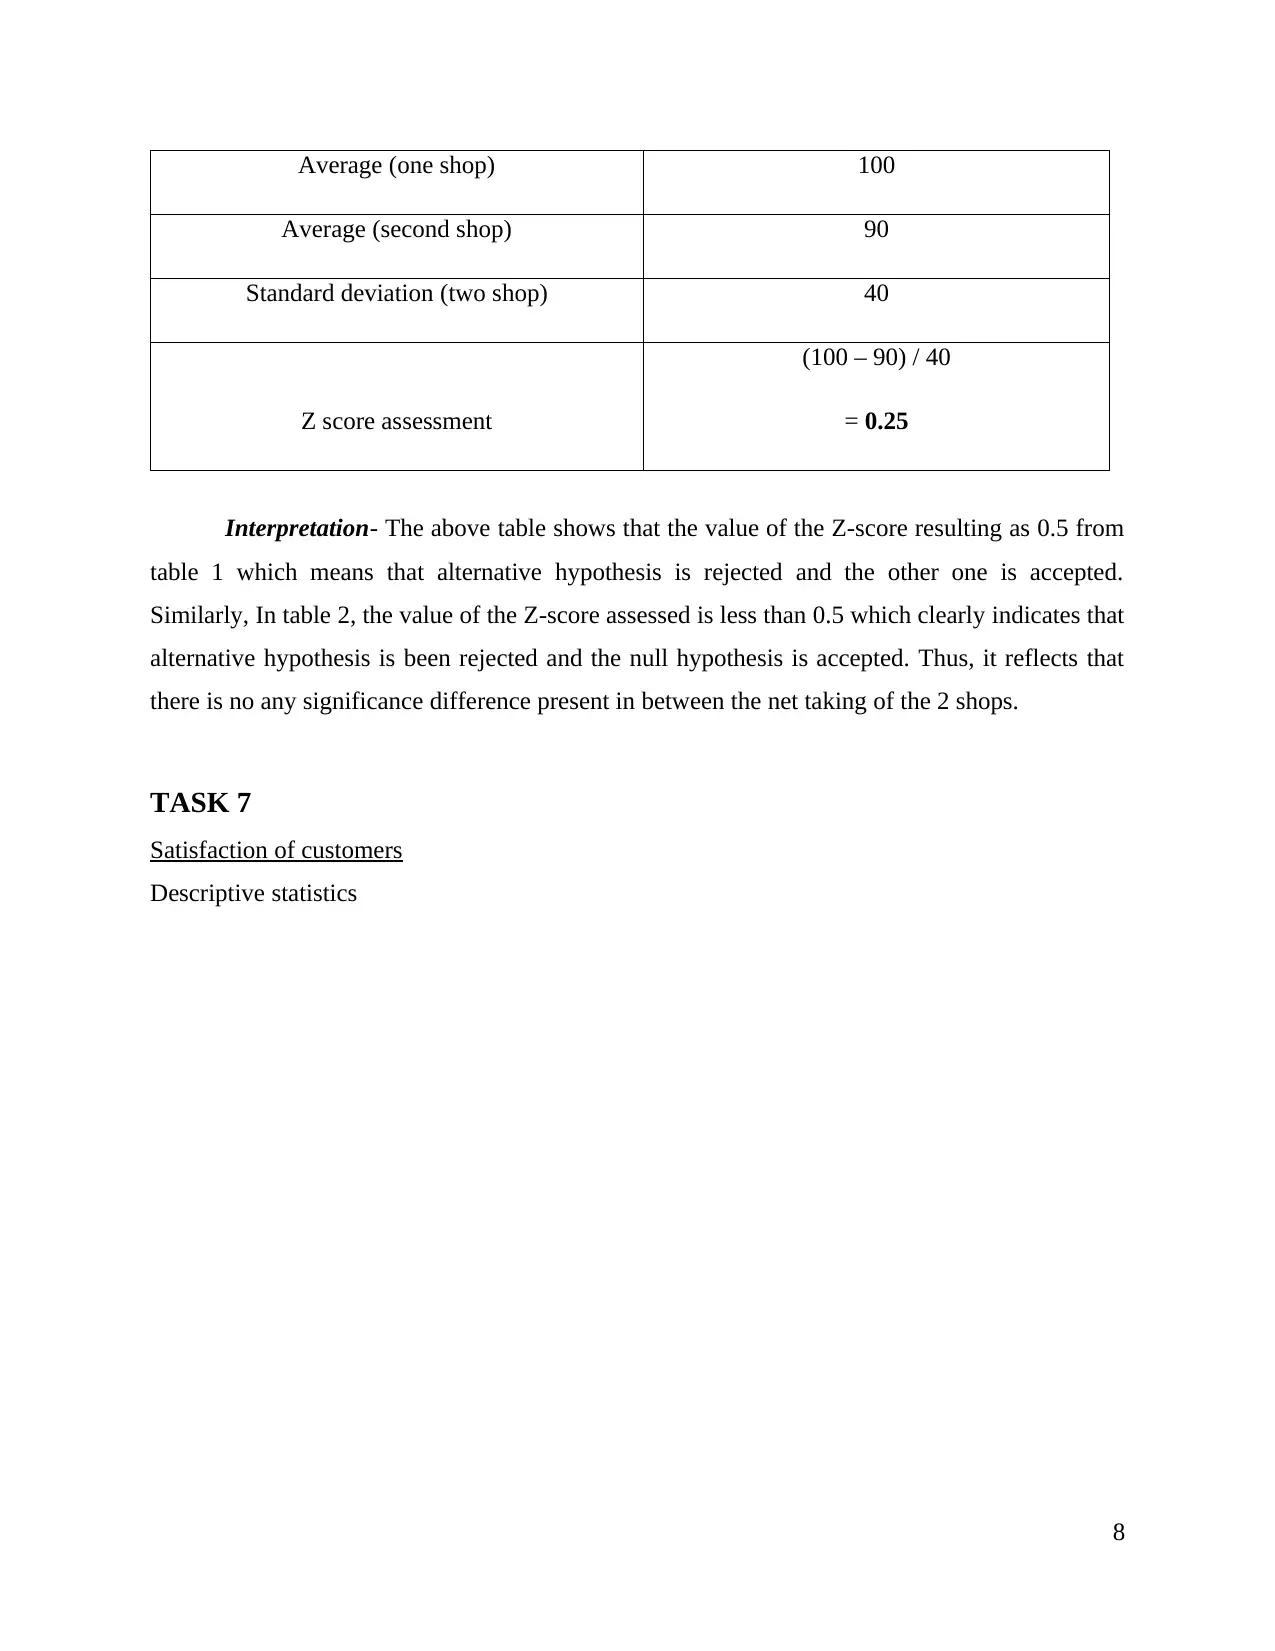
Average (one shop) 100
Average (second shop) 90
Standard deviation (two shop) 40
Z score assessment
(100 – 90) / 40
= 0.25
Interpretation- The above table shows that the value of the Z-score resulting as 0.5 from
table 1 which means that alternative hypothesis is rejected and the other one is accepted.
Similarly, In table 2, the value of the Z-score assessed is less than 0.5 which clearly indicates that
alternative hypothesis is been rejected and the null hypothesis is accepted. Thus, it reflects that
there is no any significance difference present in between the net taking of the 2 shops.
TASK 7
Satisfaction of customers
Descriptive statistics
8
Paraphrase This Document
Need a fresh take? Get an instant paraphrase of this document with our AI Paraphraser
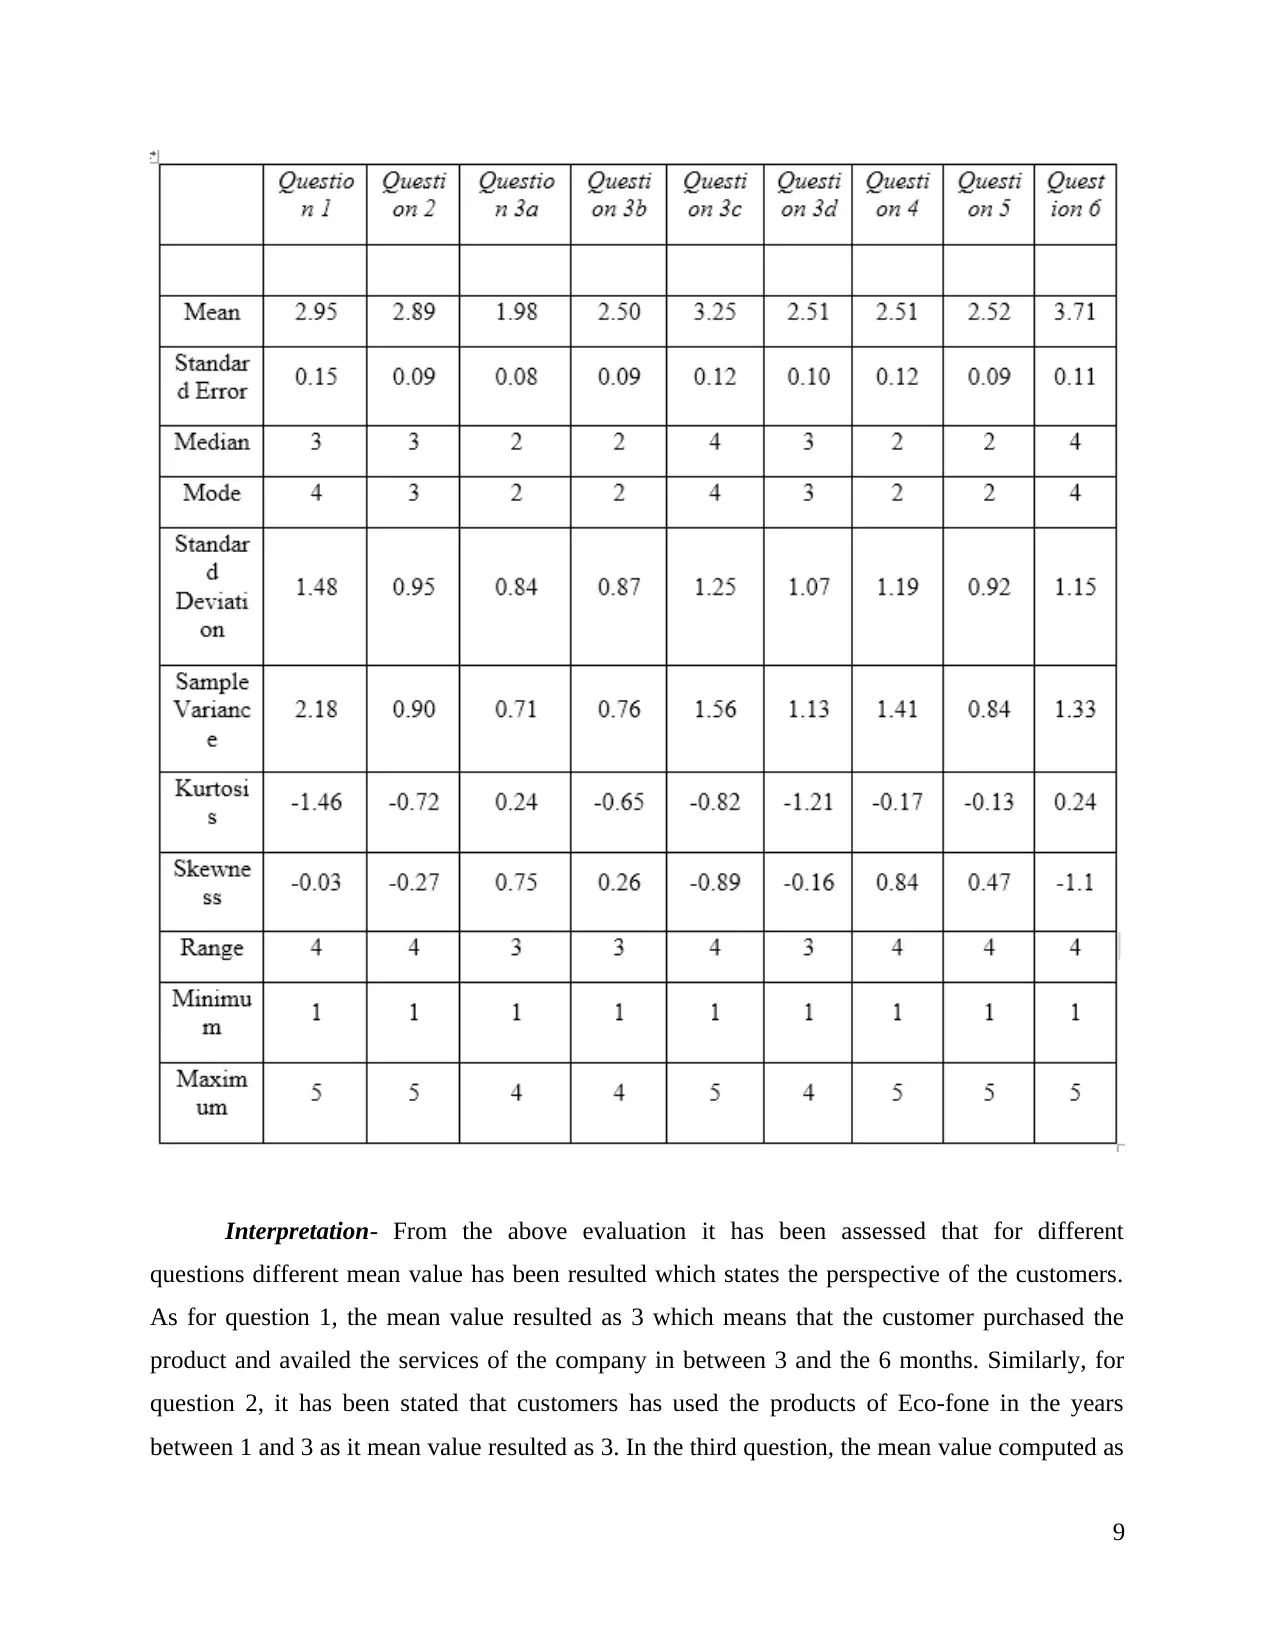
Interpretation- From the above evaluation it has been assessed that for different
questions different mean value has been resulted which states the perspective of the customers.
As for question 1, the mean value resulted as 3 which means that the customer purchased the
product and availed the services of the company in between 3 and the 6 months. Similarly, for
question 2, it has been stated that customers has used the products of Eco-fone in the years
between 1 and 3 as it mean value resulted as 3. In the third question, the mean value computed as
9
2 for the customer support, product quality and the value of prices, this in turn means that fair
rating is been given towards these characteristics. However, for sales staff, good rating is been
given as the mean value resulted as 3. This reflects that the customers are satisfied with the sales
staff of the enterprise. For the fourth question, the mean value attained as 2 which means that
overall the customer is dissatisfied. In question 5, as the mean value resulted to 2 which depicts
that the customers are unlikely to do the business with this company. Lastly, for question 6, the
means value is 3 which states that the consumers are likely to recommend their products to other
people.
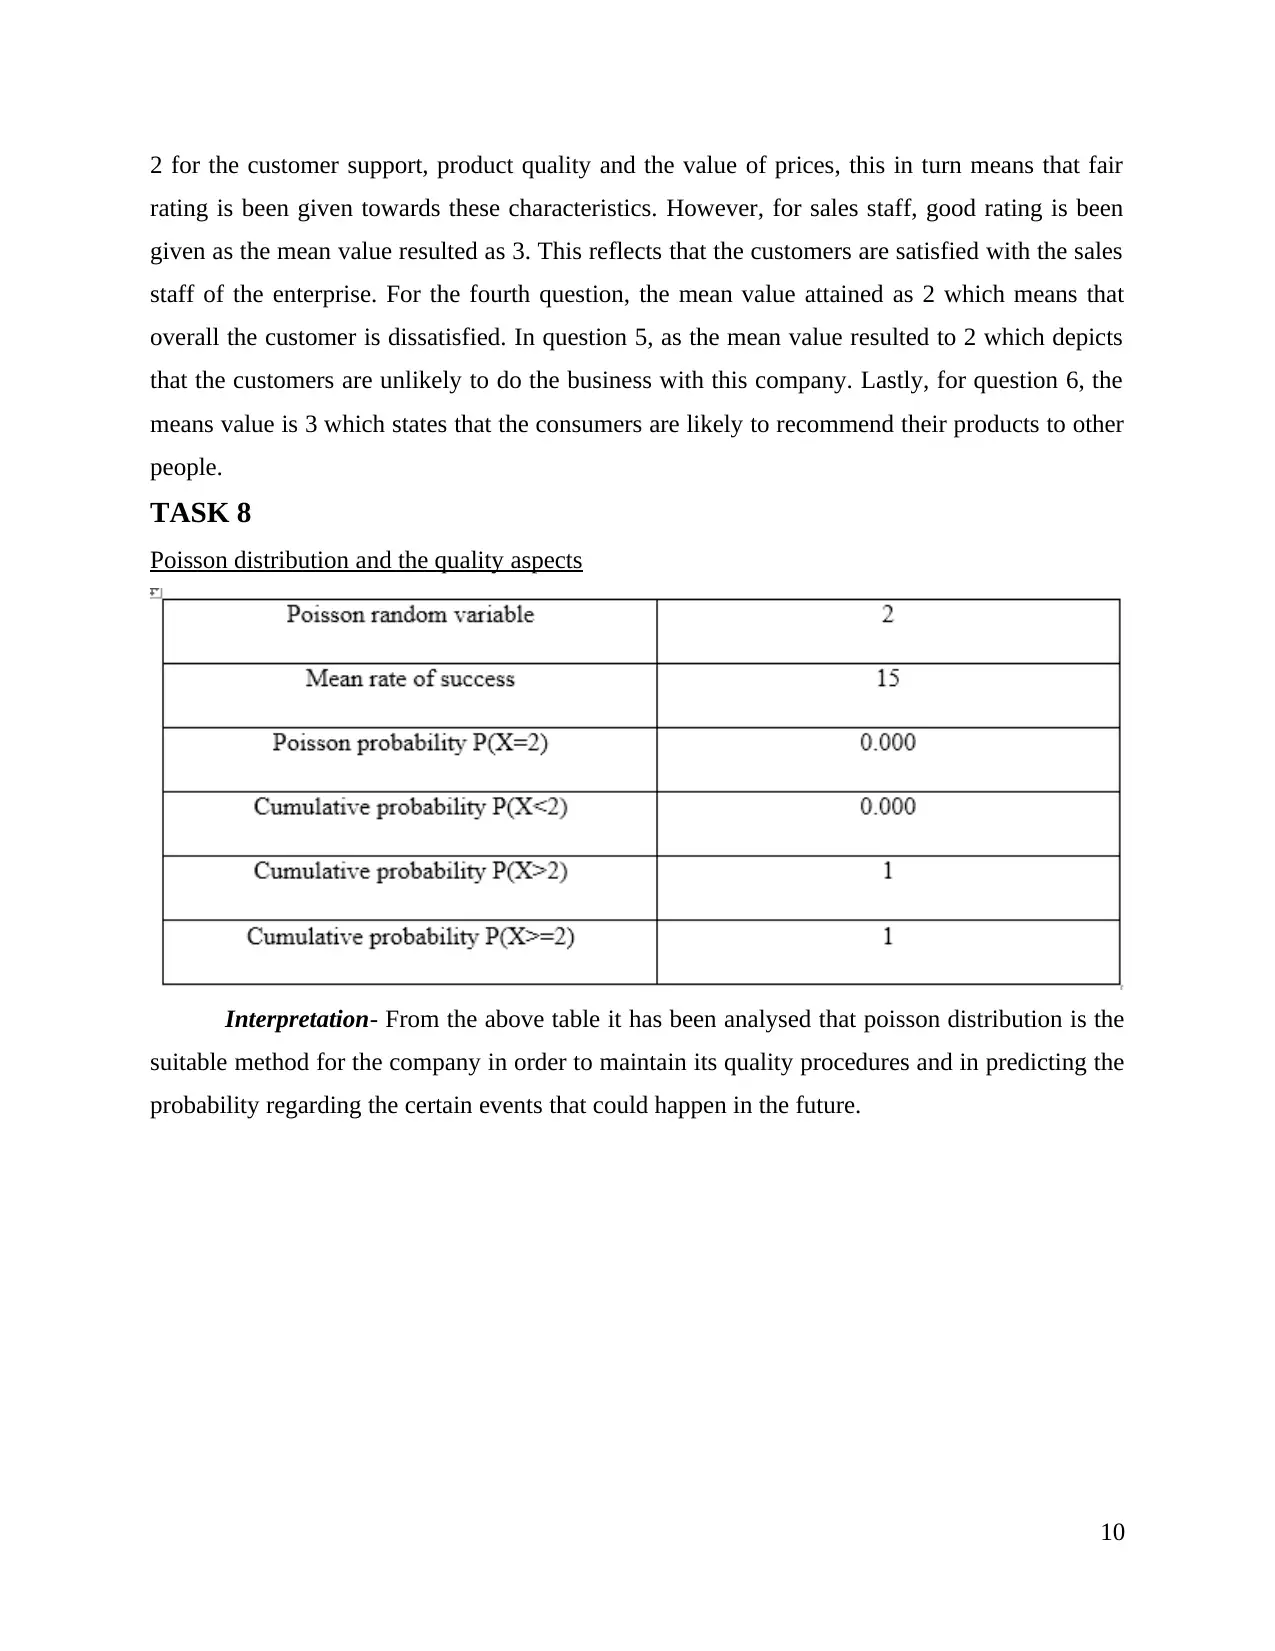
TASK 8
Poisson distribution and the quality aspects
Interpretation- From the above table it has been analysed that poisson distribution is the
suitable method for the company in order to maintain its quality procedures and in predicting the
probability regarding the certain events that could happen in the future.
10
rating is been given towards these characteristics. However, for sales staff, good rating is been
given as the mean value resulted as 3. This reflects that the customers are satisfied with the sales
staff of the enterprise. For the fourth question, the mean value attained as 2 which means that
overall the customer is dissatisfied. In question 5, as the mean value resulted to 2 which depicts
that the customers are unlikely to do the business with this company. Lastly, for question 6, the
means value is 3 which states that the consumers are likely to recommend their products to other
people.
TASK 8
Poisson distribution and the quality aspects
Interpretation- From the above table it has been analysed that poisson distribution is the
suitable method for the company in order to maintain its quality procedures and in predicting the
probability regarding the certain events that could happen in the future.
10
⊘ This is a preview!⊘
Do you want full access?
Subscribe today to unlock all pages.
Trusted by 1+ million students worldwide
1 out of 15
Related Documents


Your All-in-One AI-Powered Toolkit for Academic Success.
+13062052269
info@desklib.com
Available 24*7 on WhatsApp / Email
![[object Object]](/_next/static/media/star-bottom.7253800d.svg)
Unlock your academic potential
Copyright © 2020–2026 A2Z Services. All Rights Reserved. Developed and managed by ZUCOL.