Detailed 5-Year Financial Plan for an Eco-friendly Straw Business

Verified

Added on  2023/01/19

|14
|799
|67
Project
AI Summary
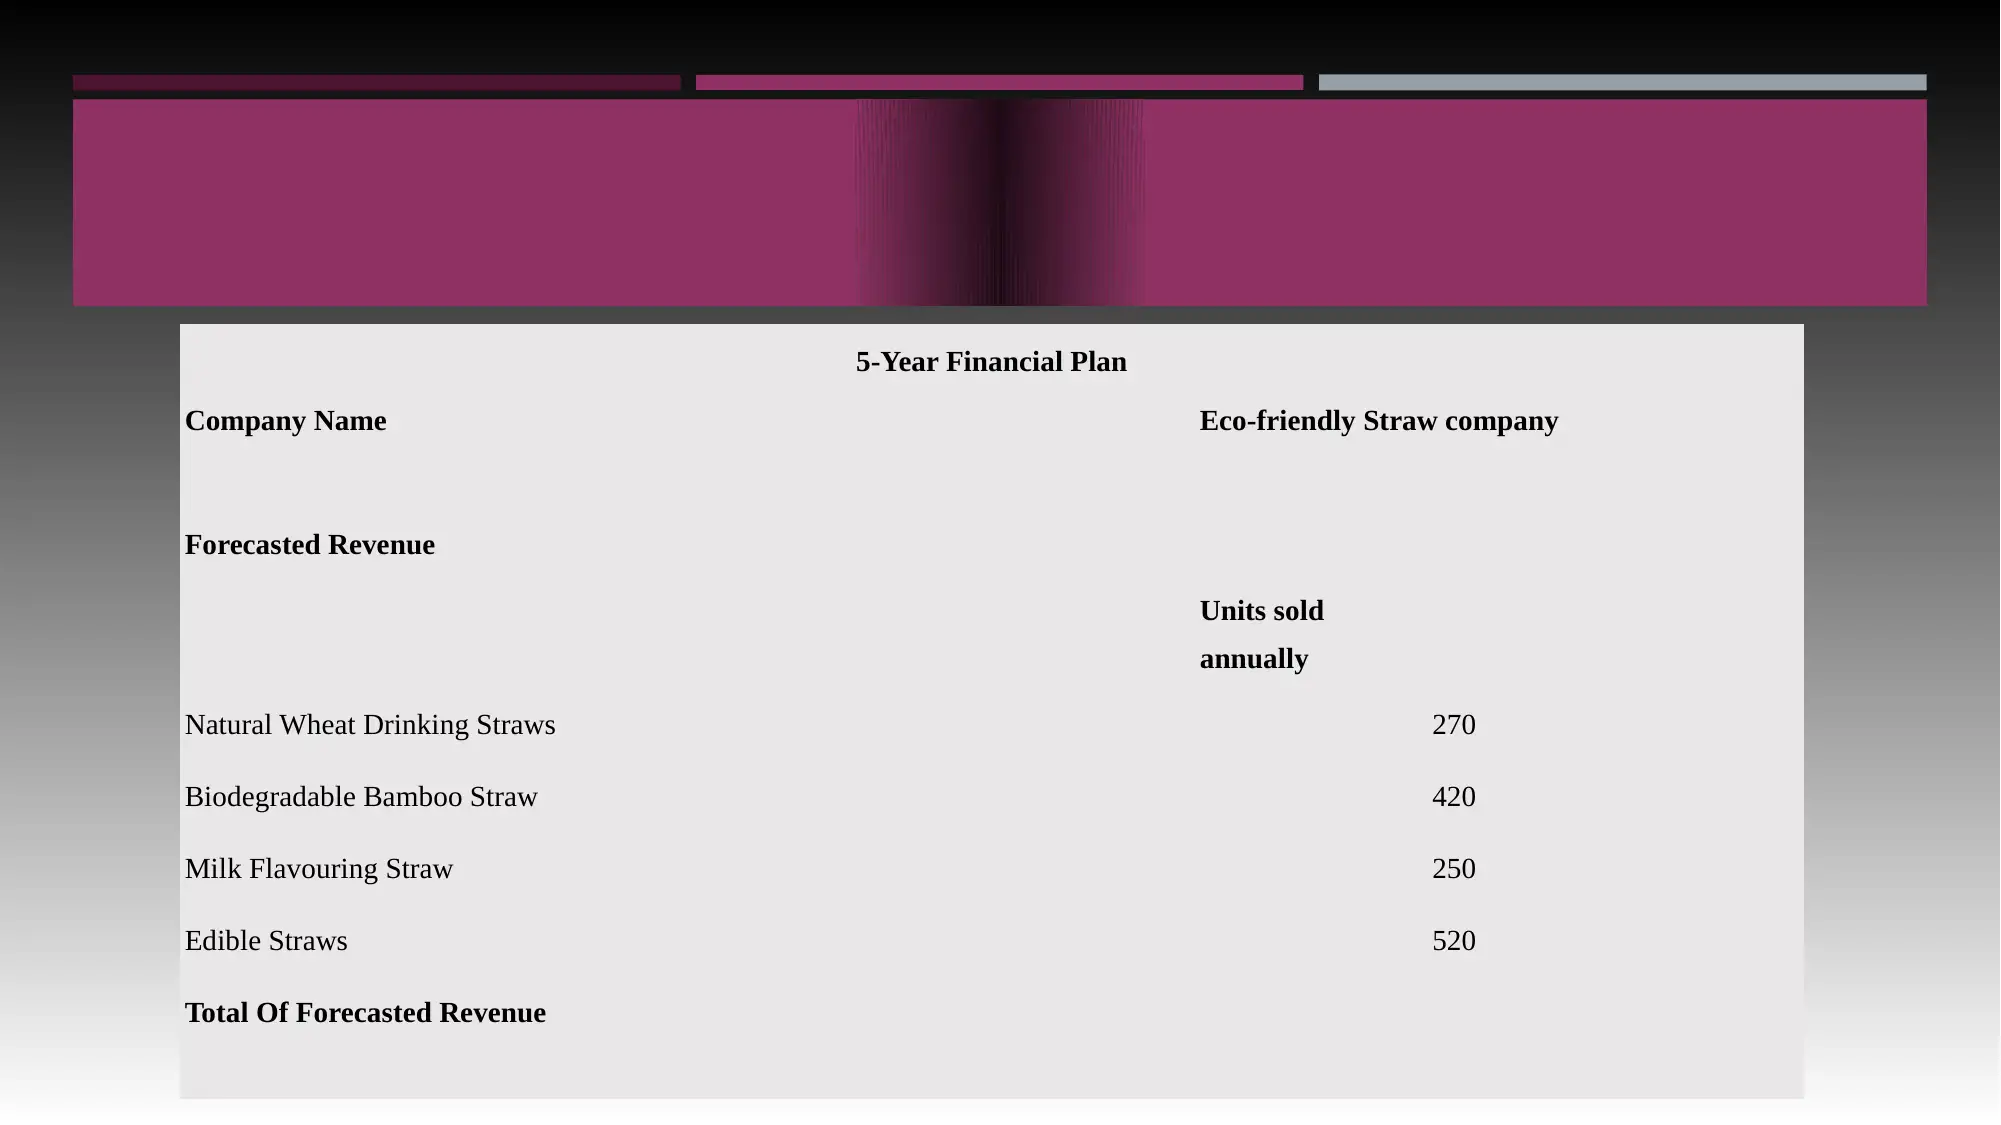
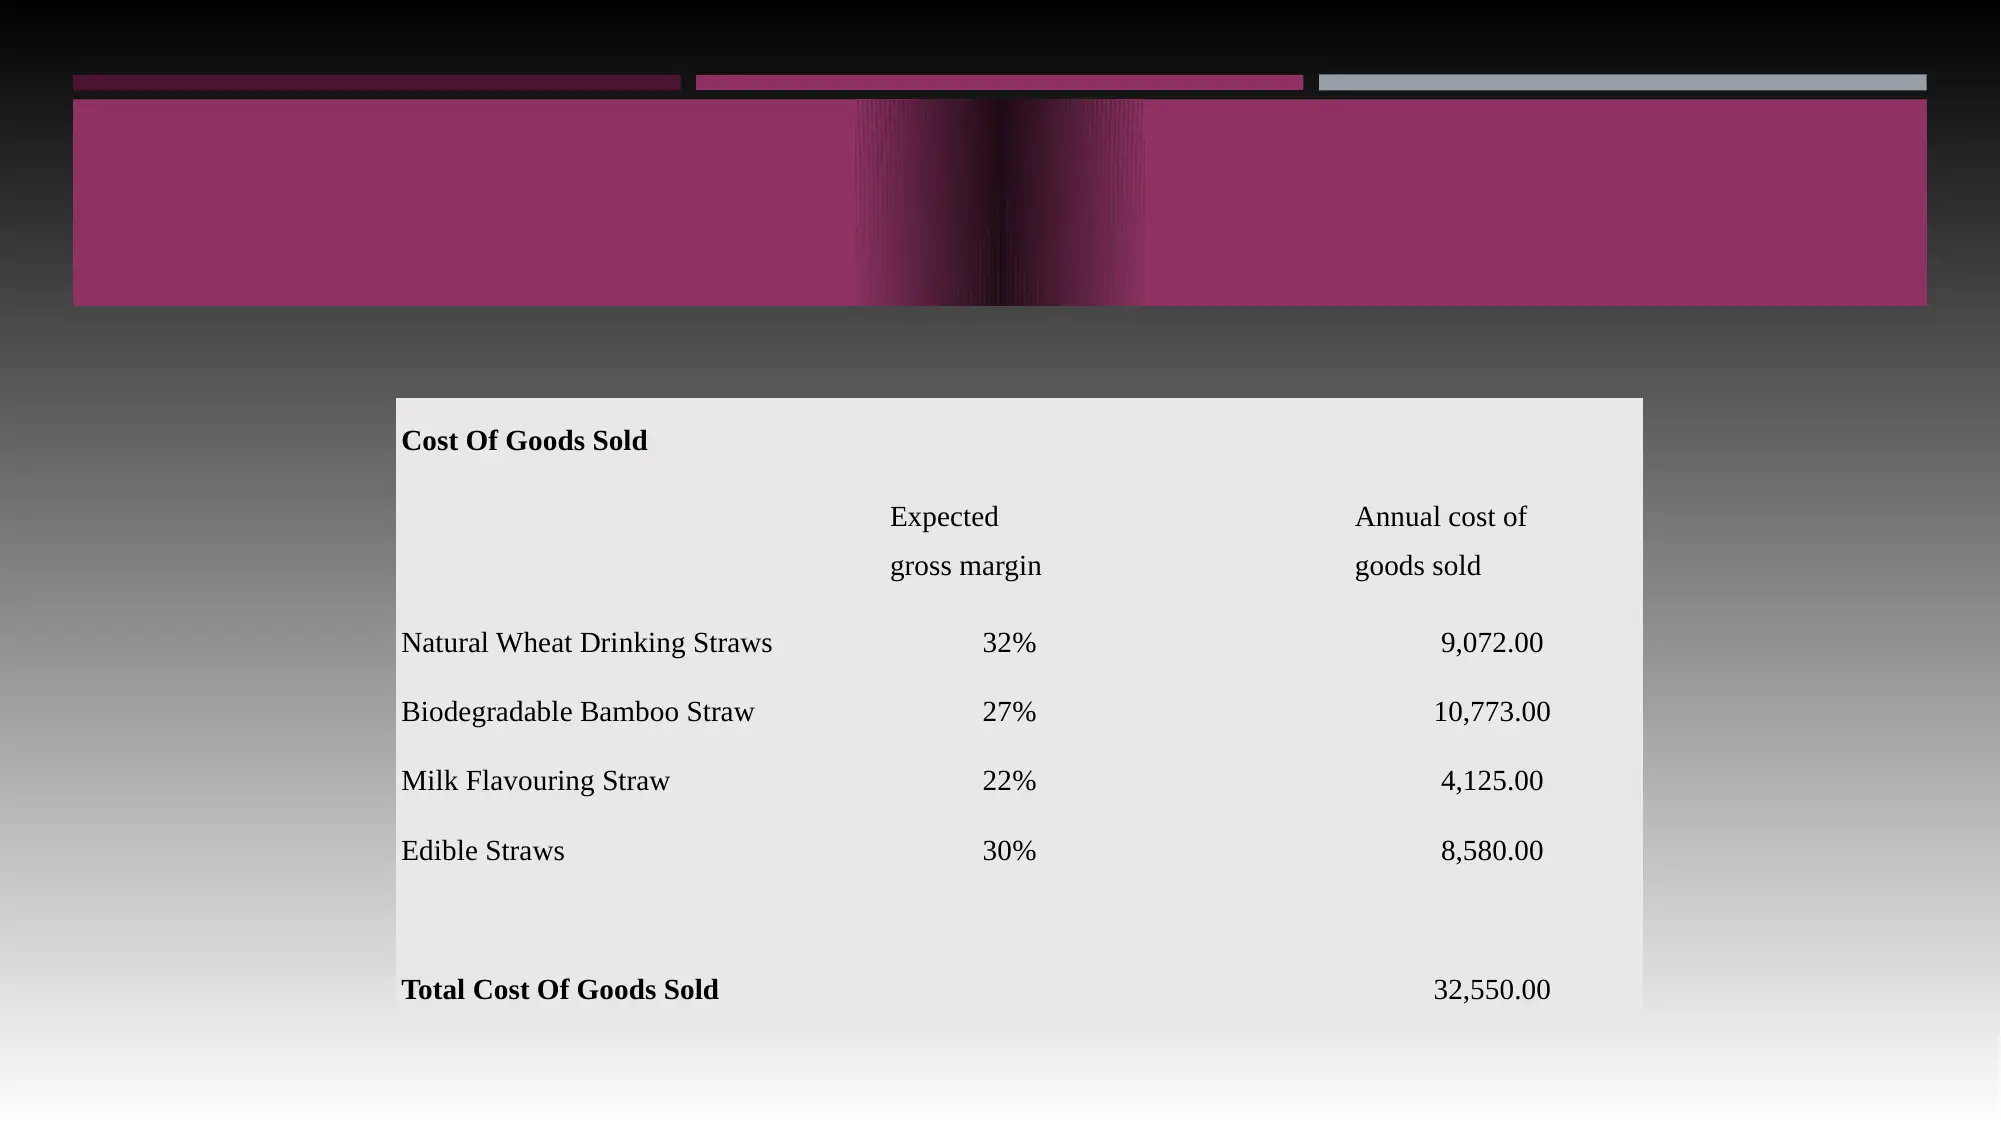
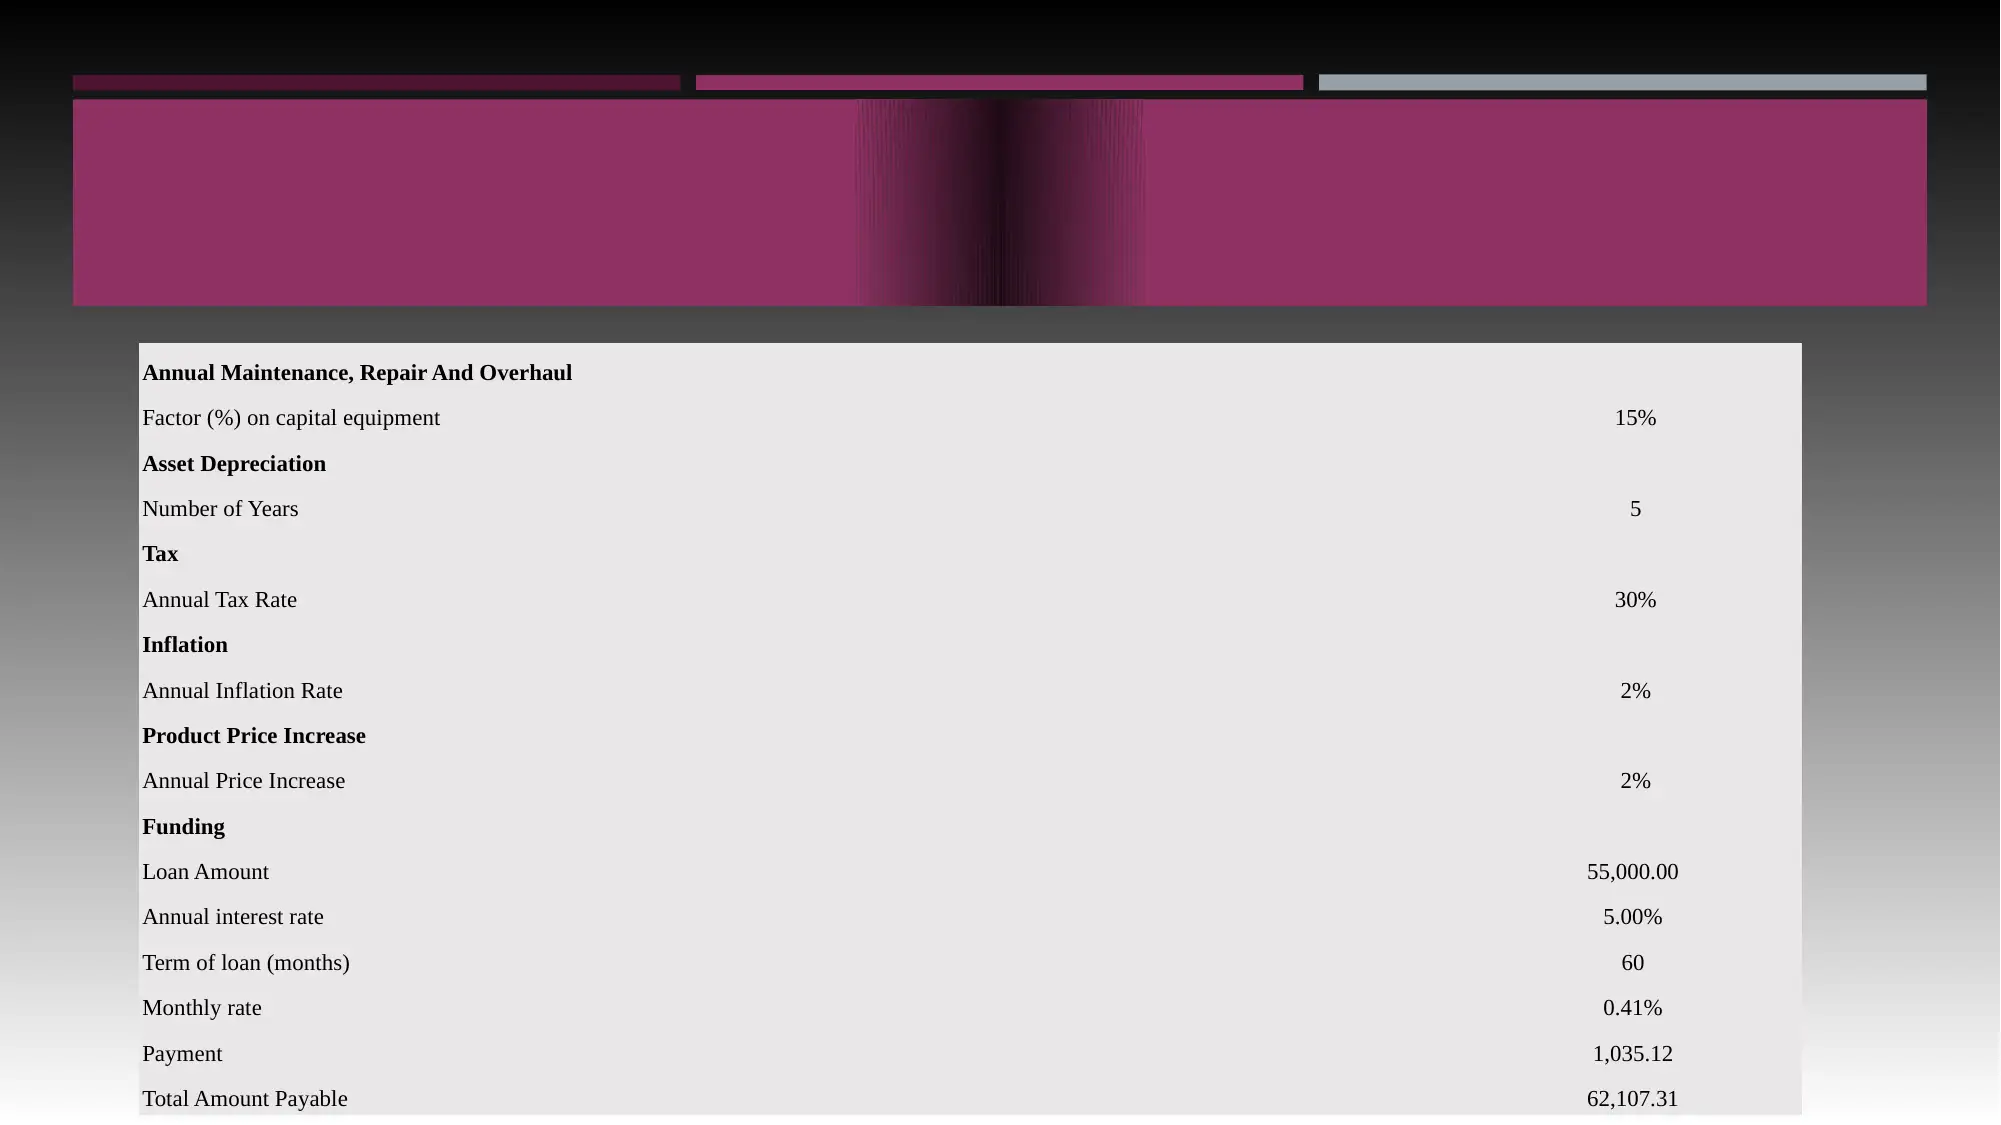
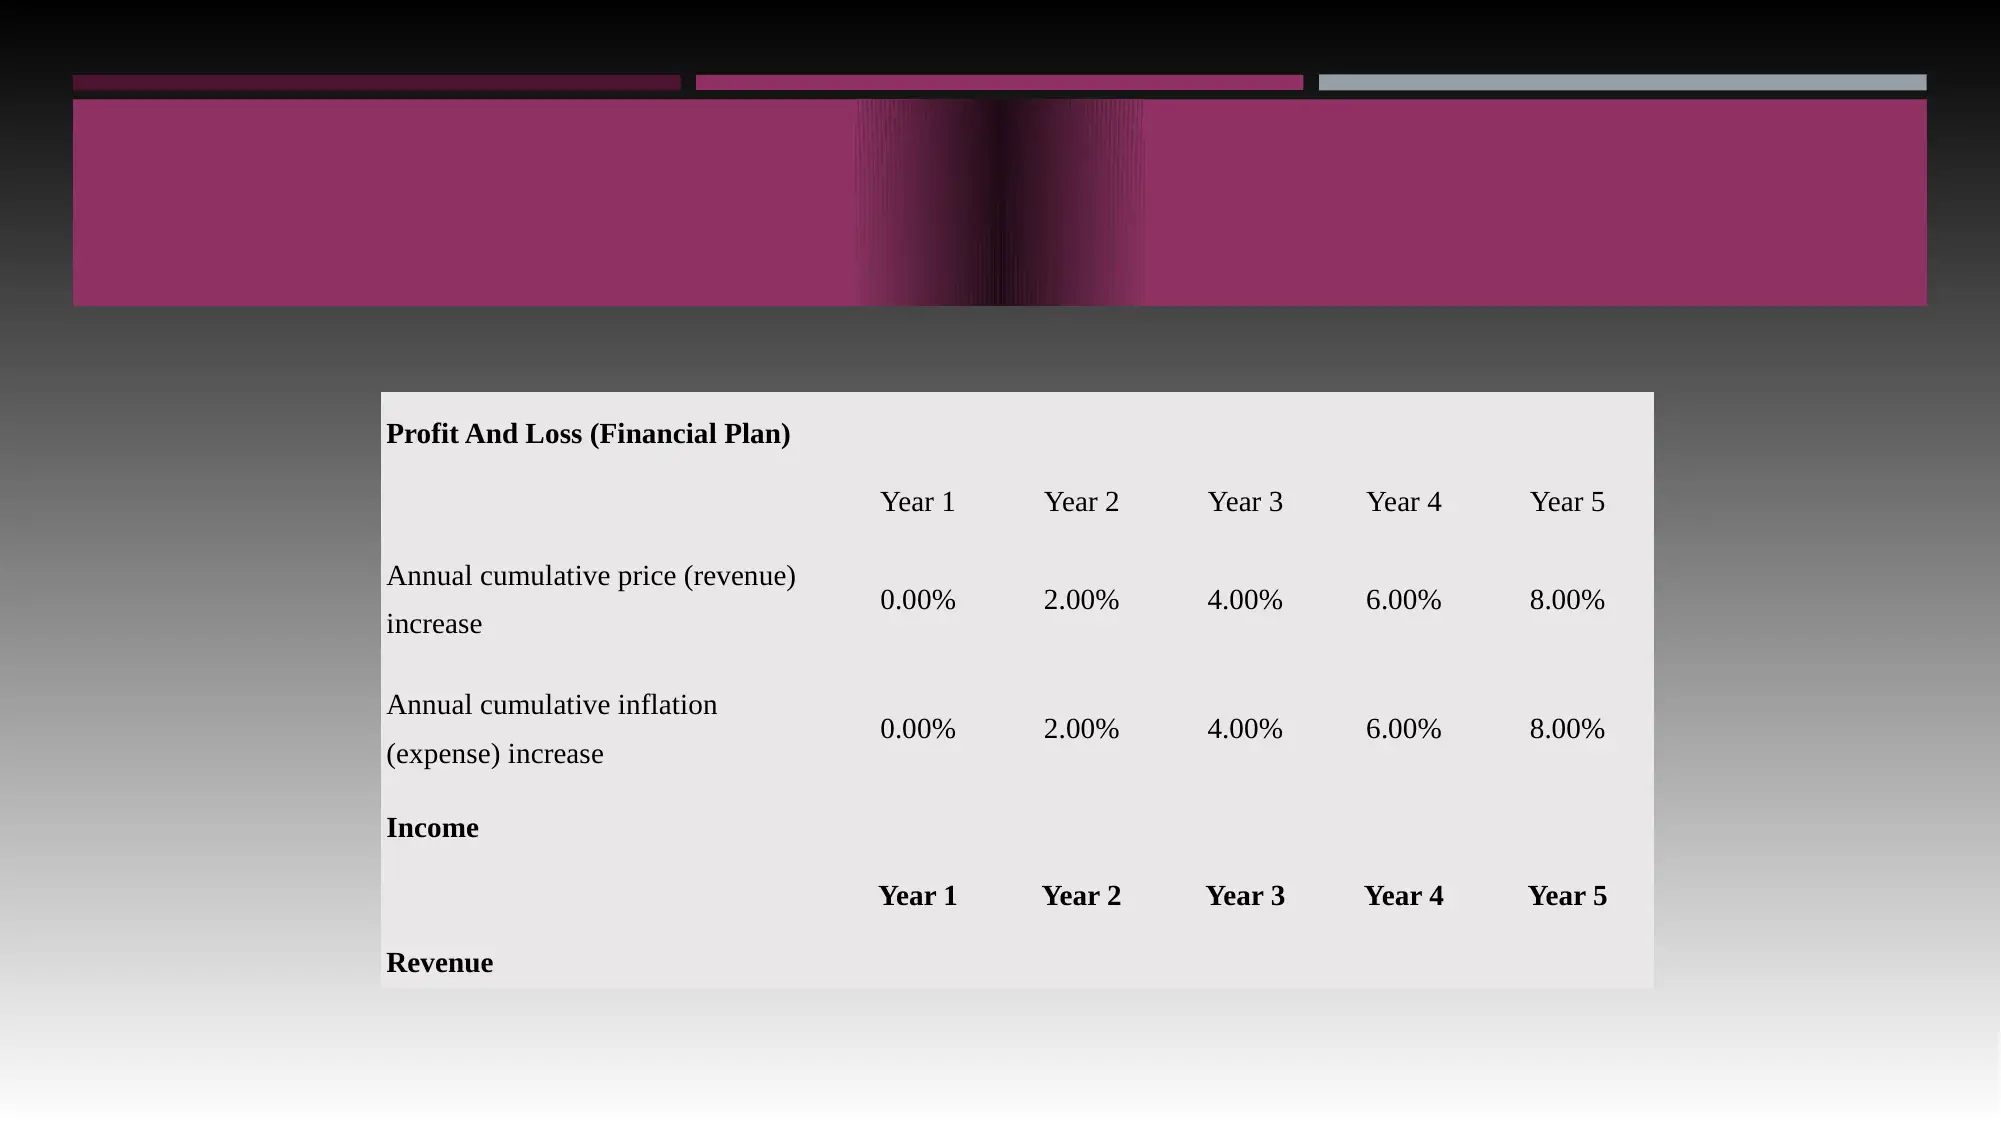
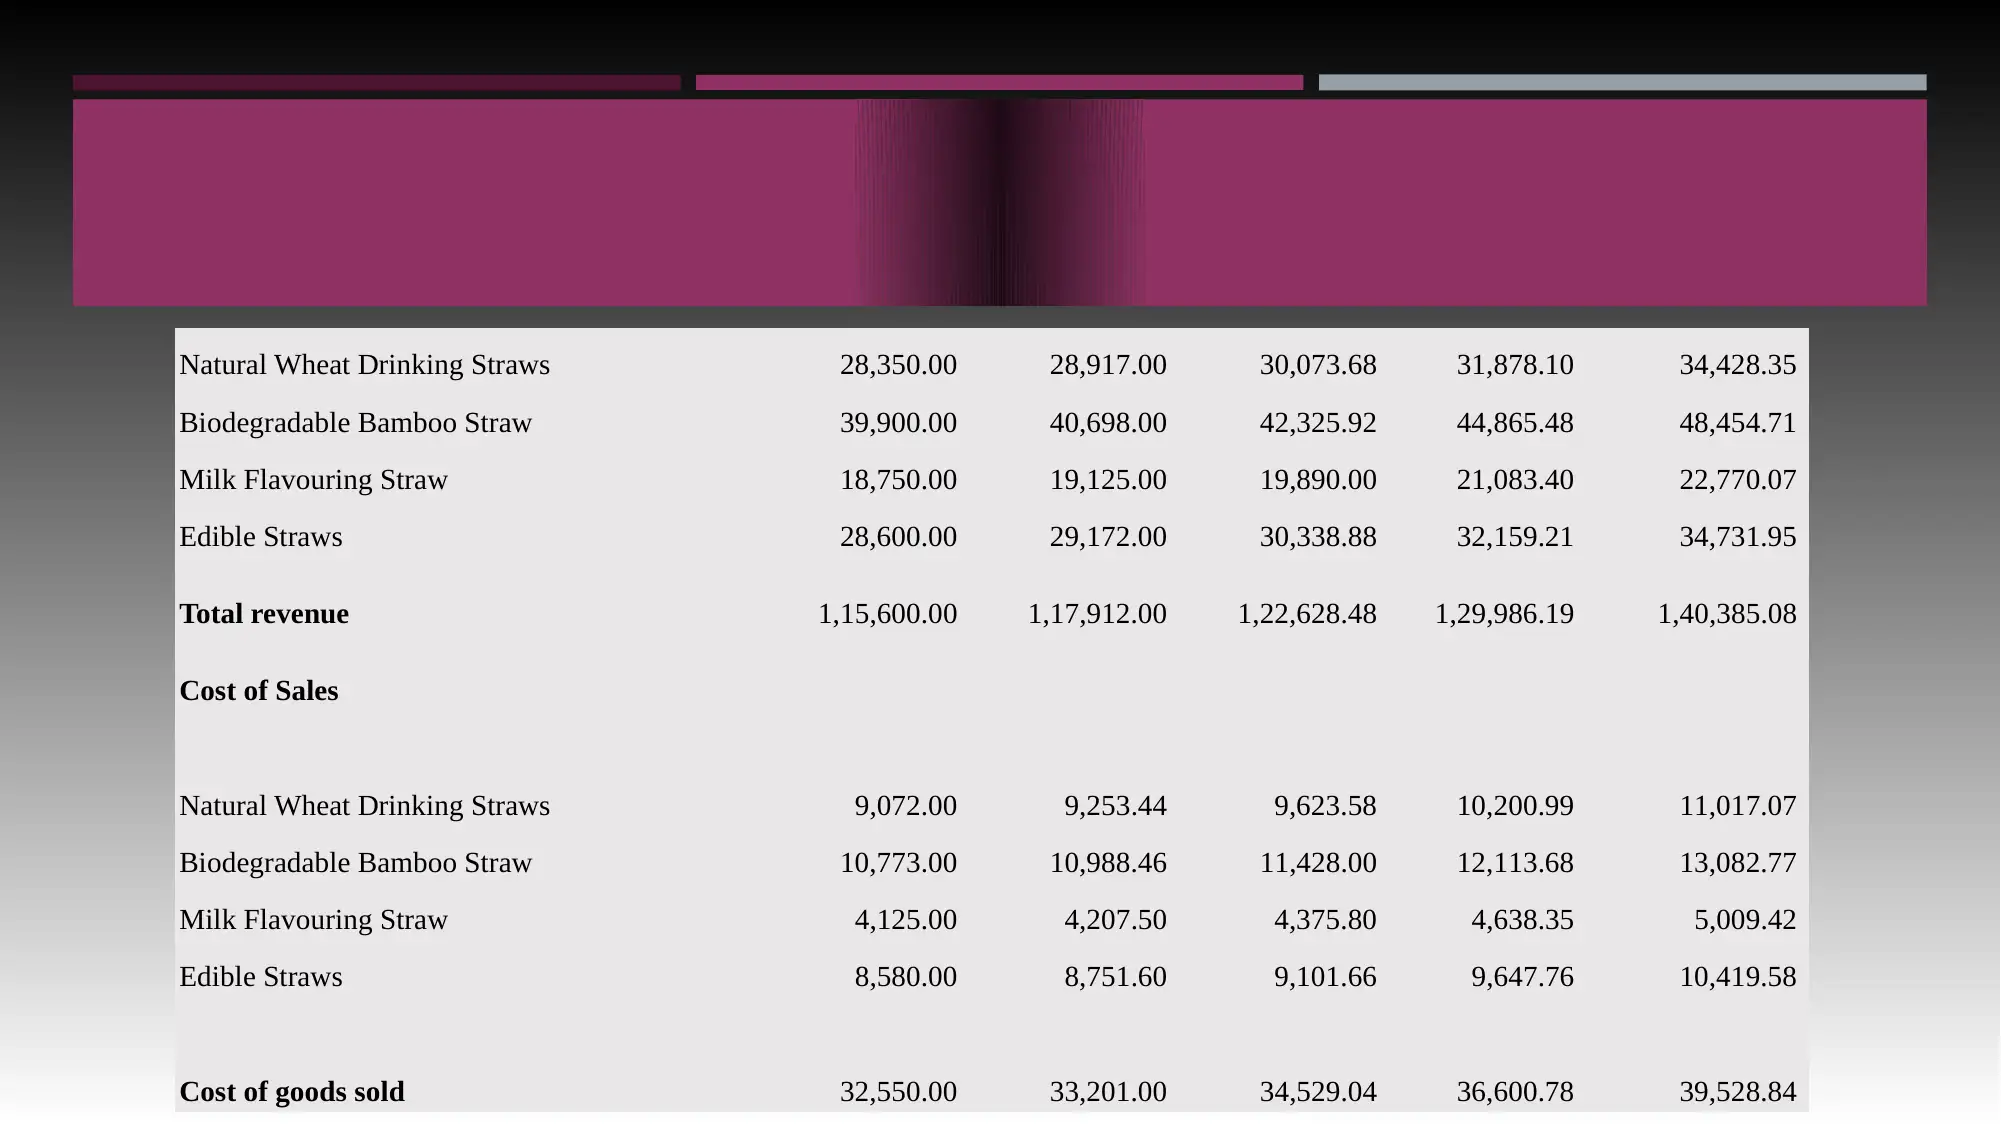
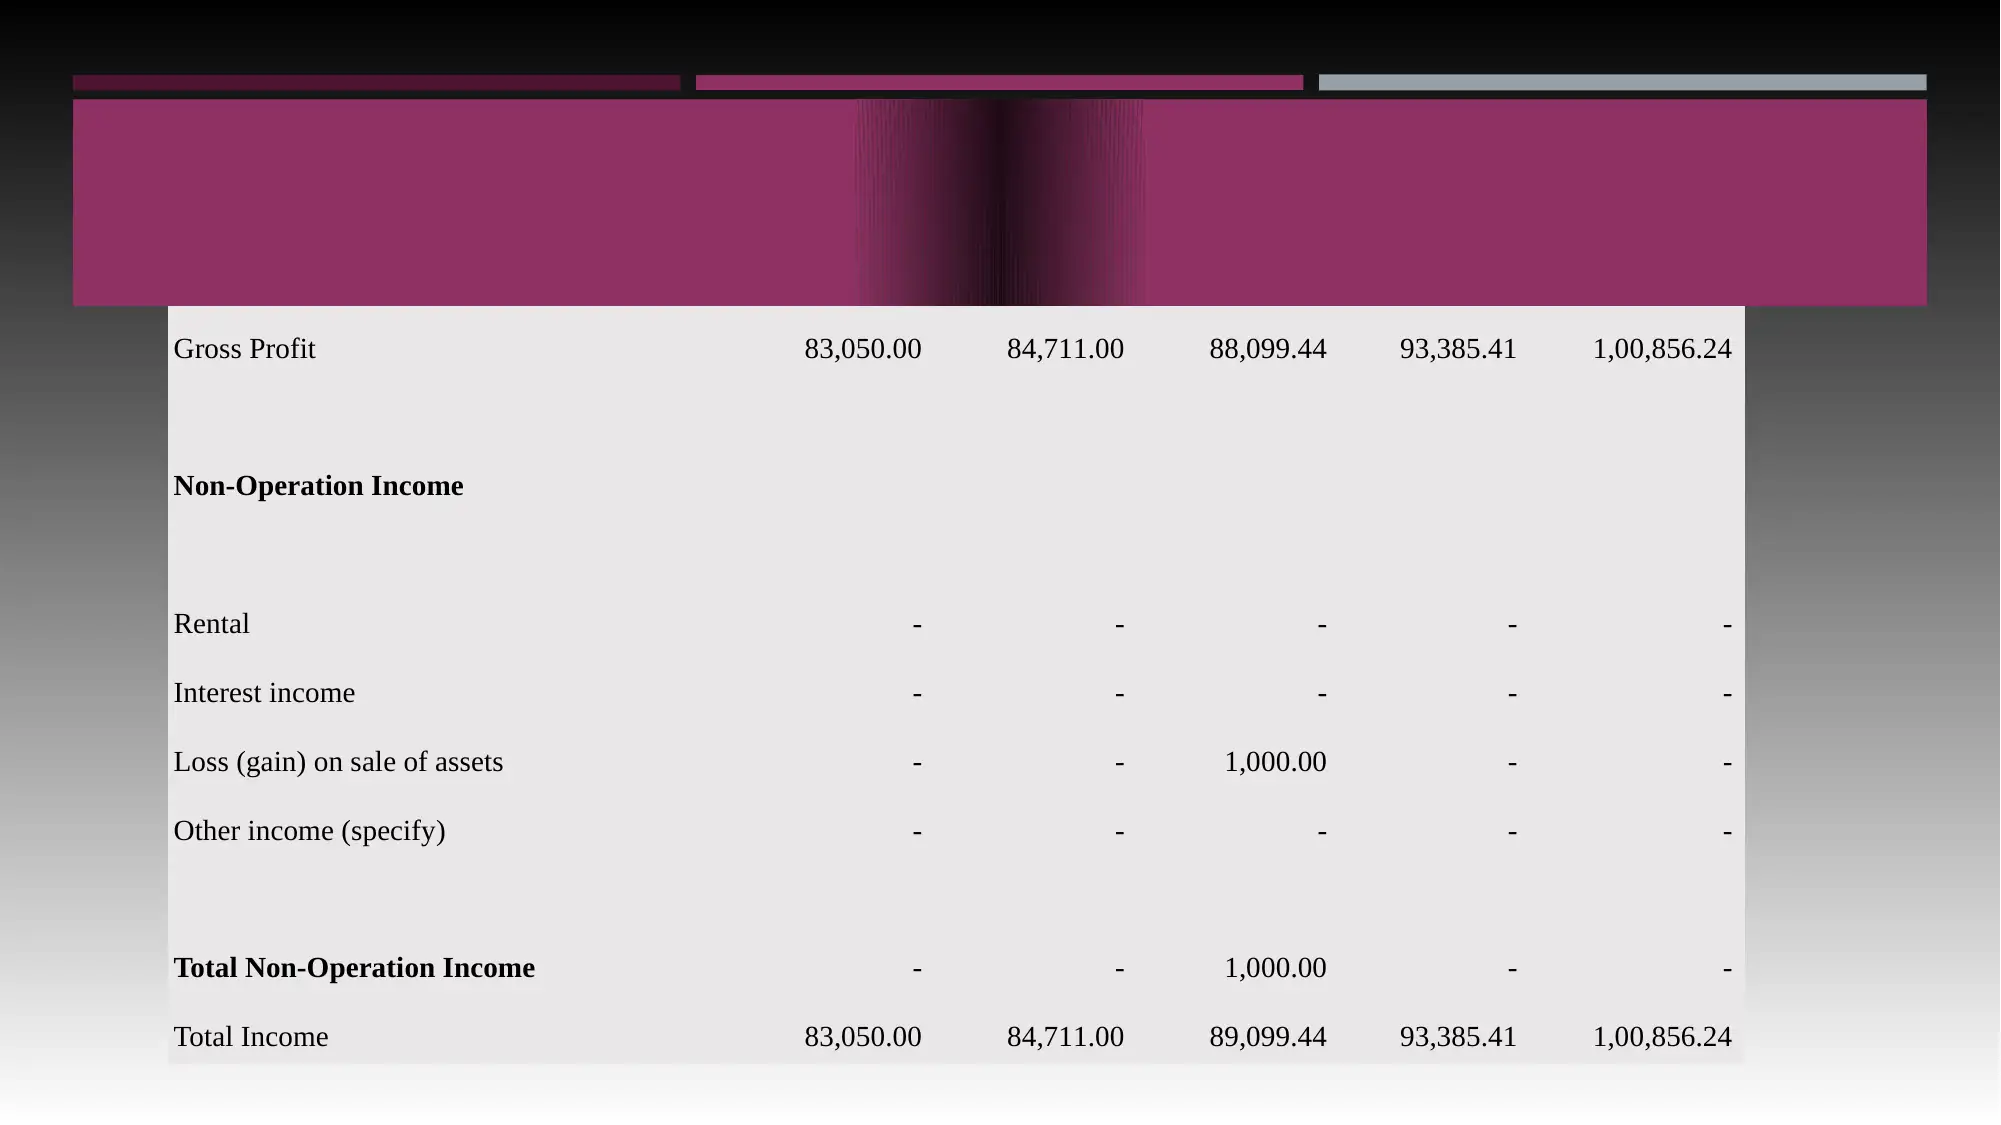
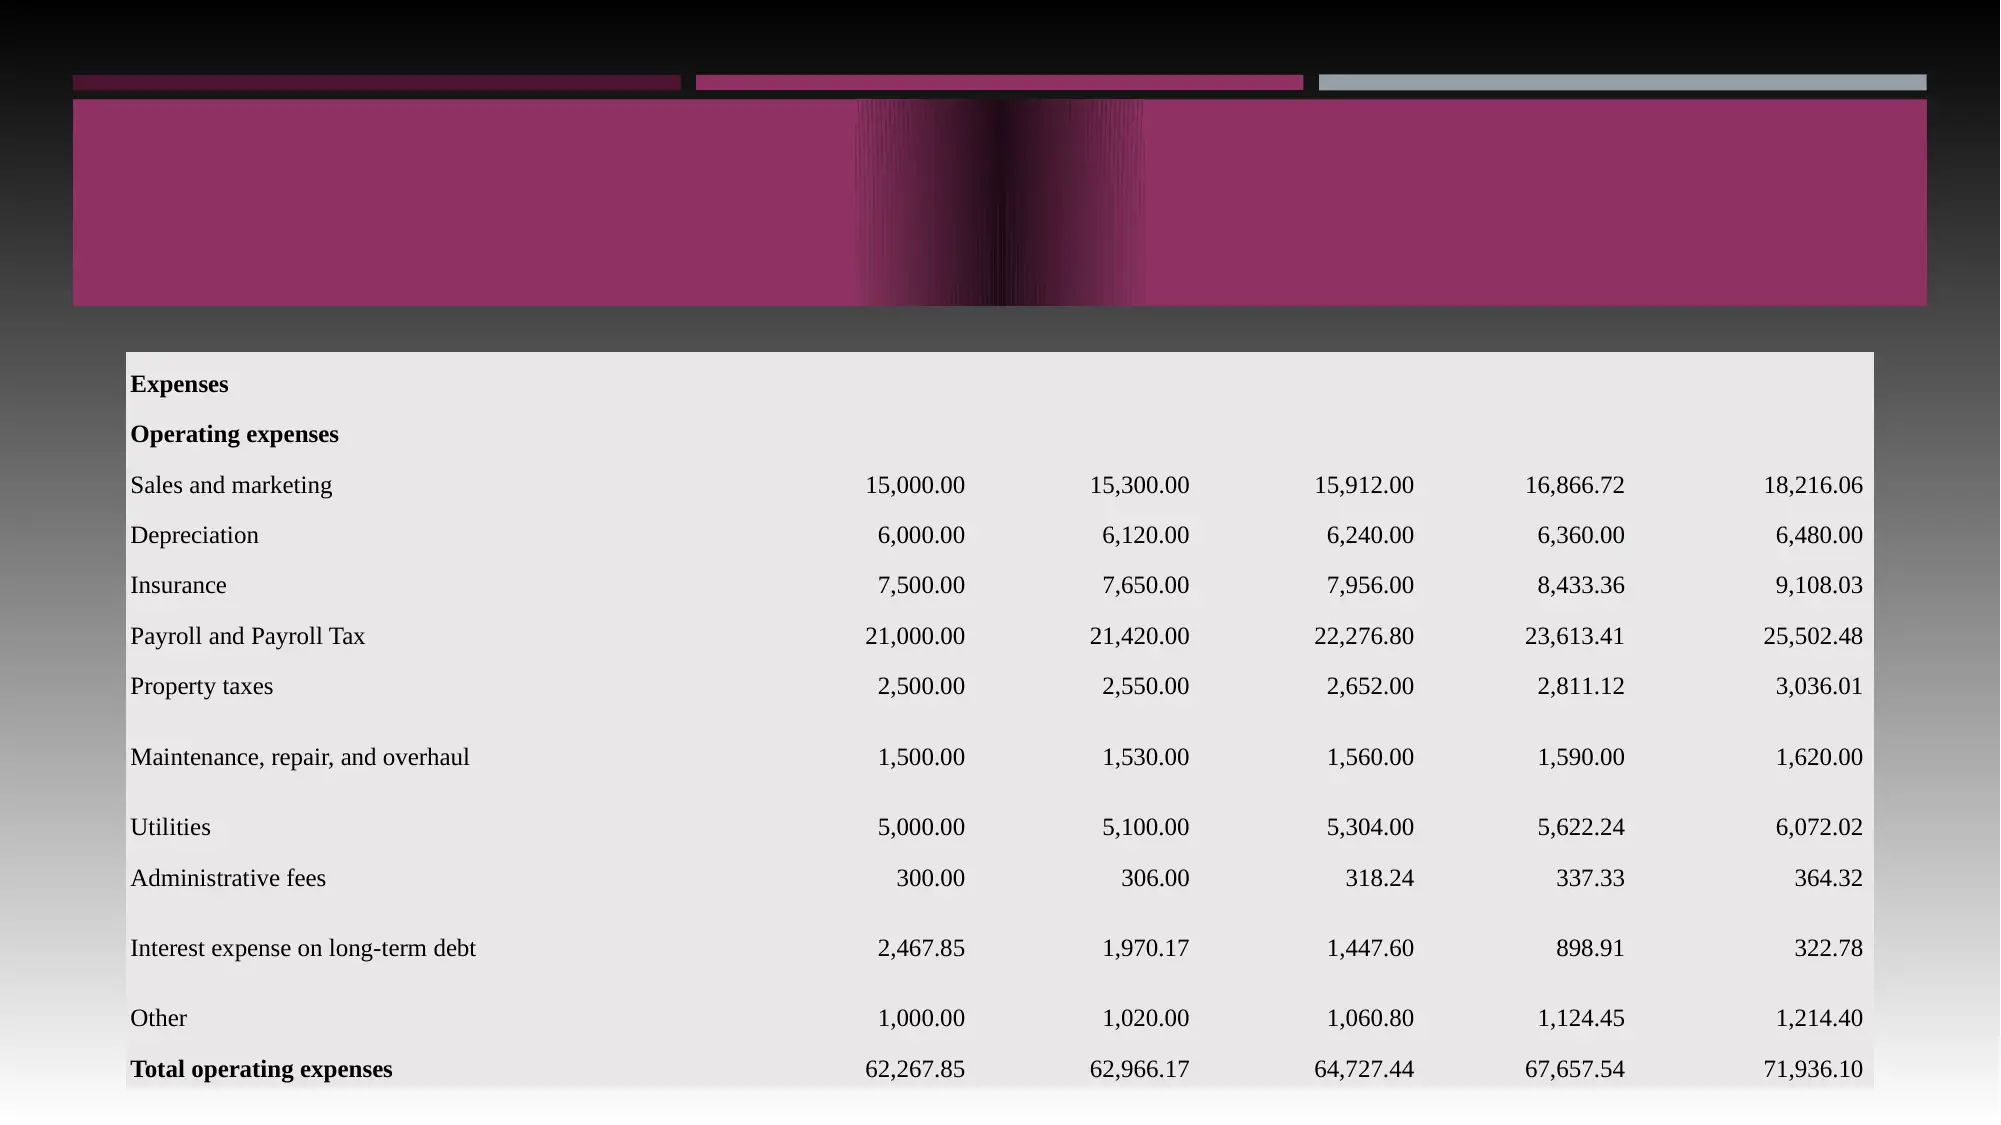
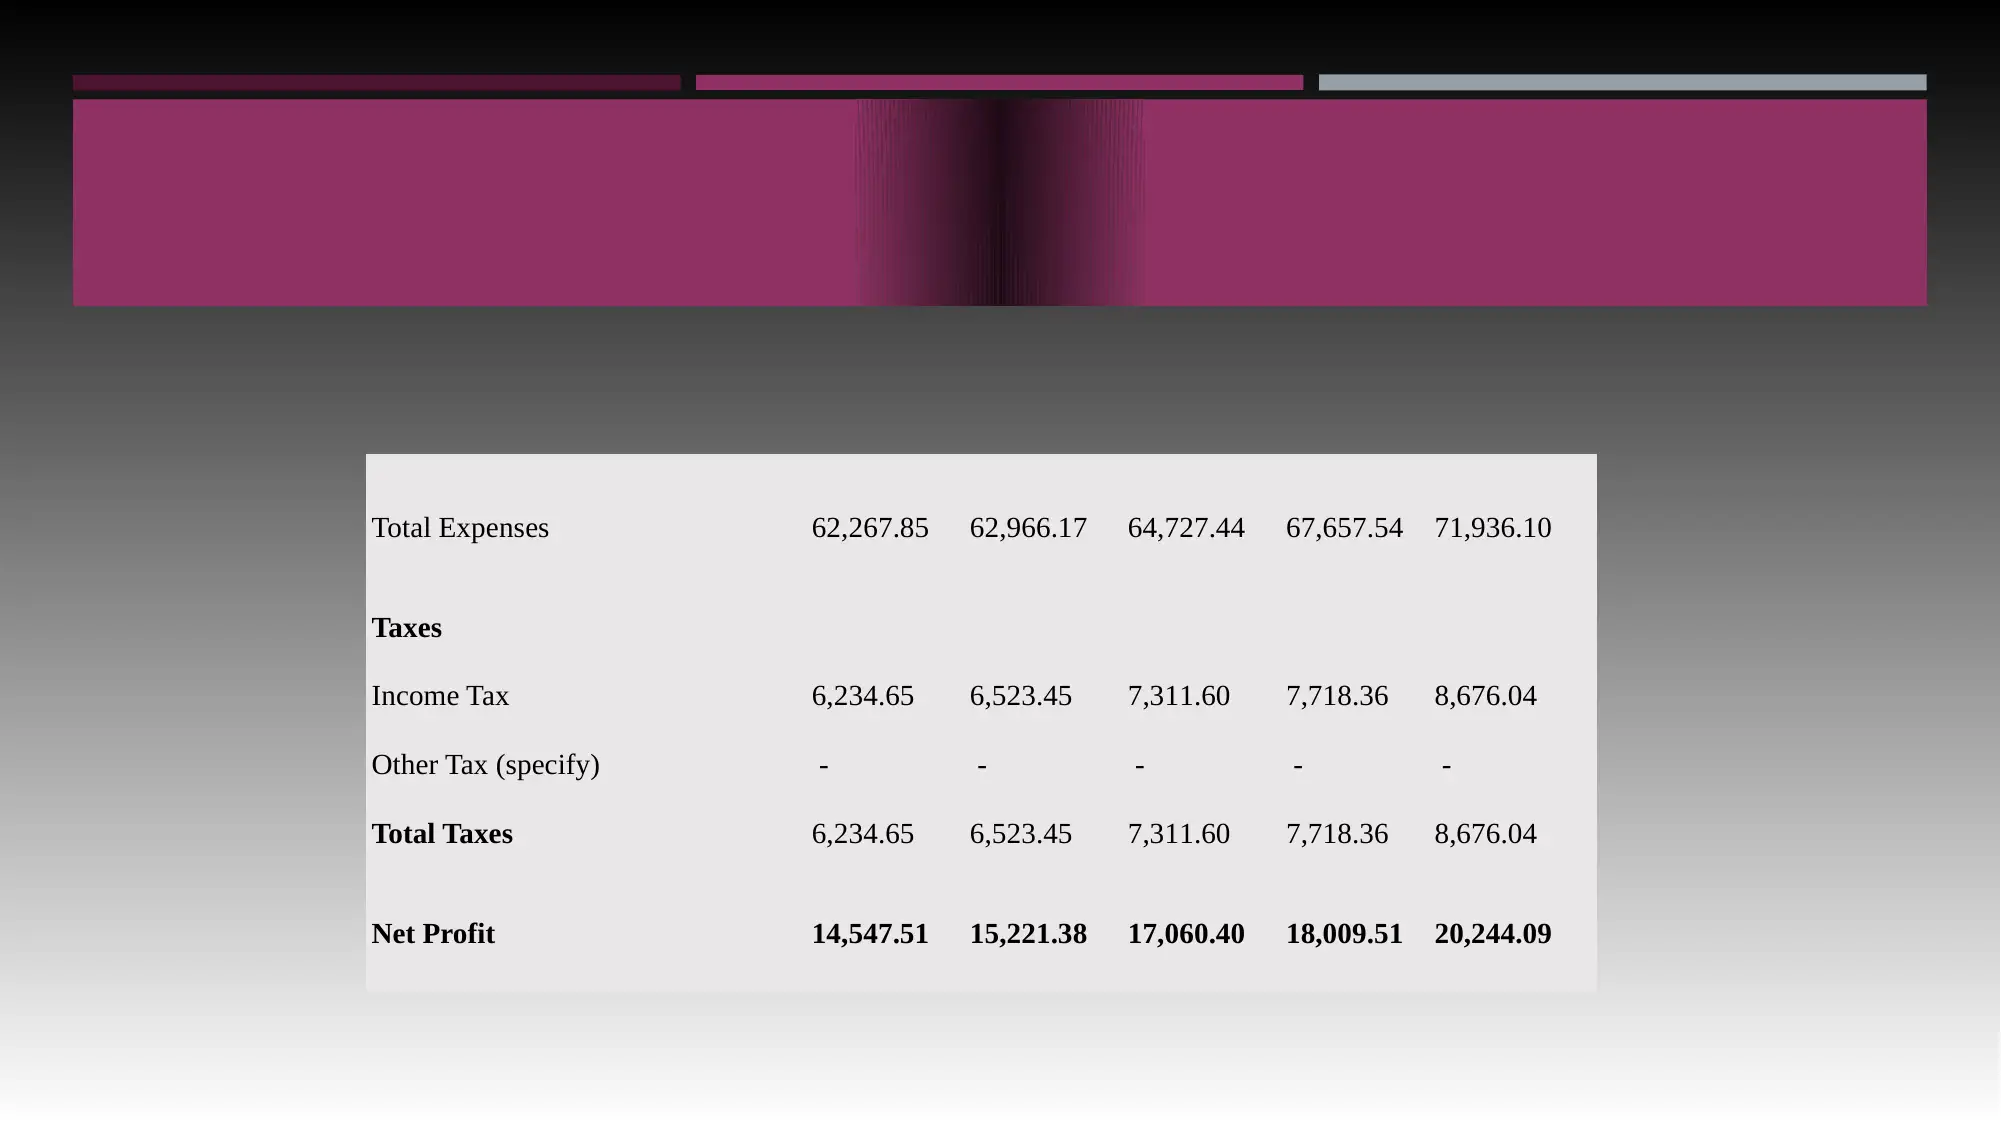
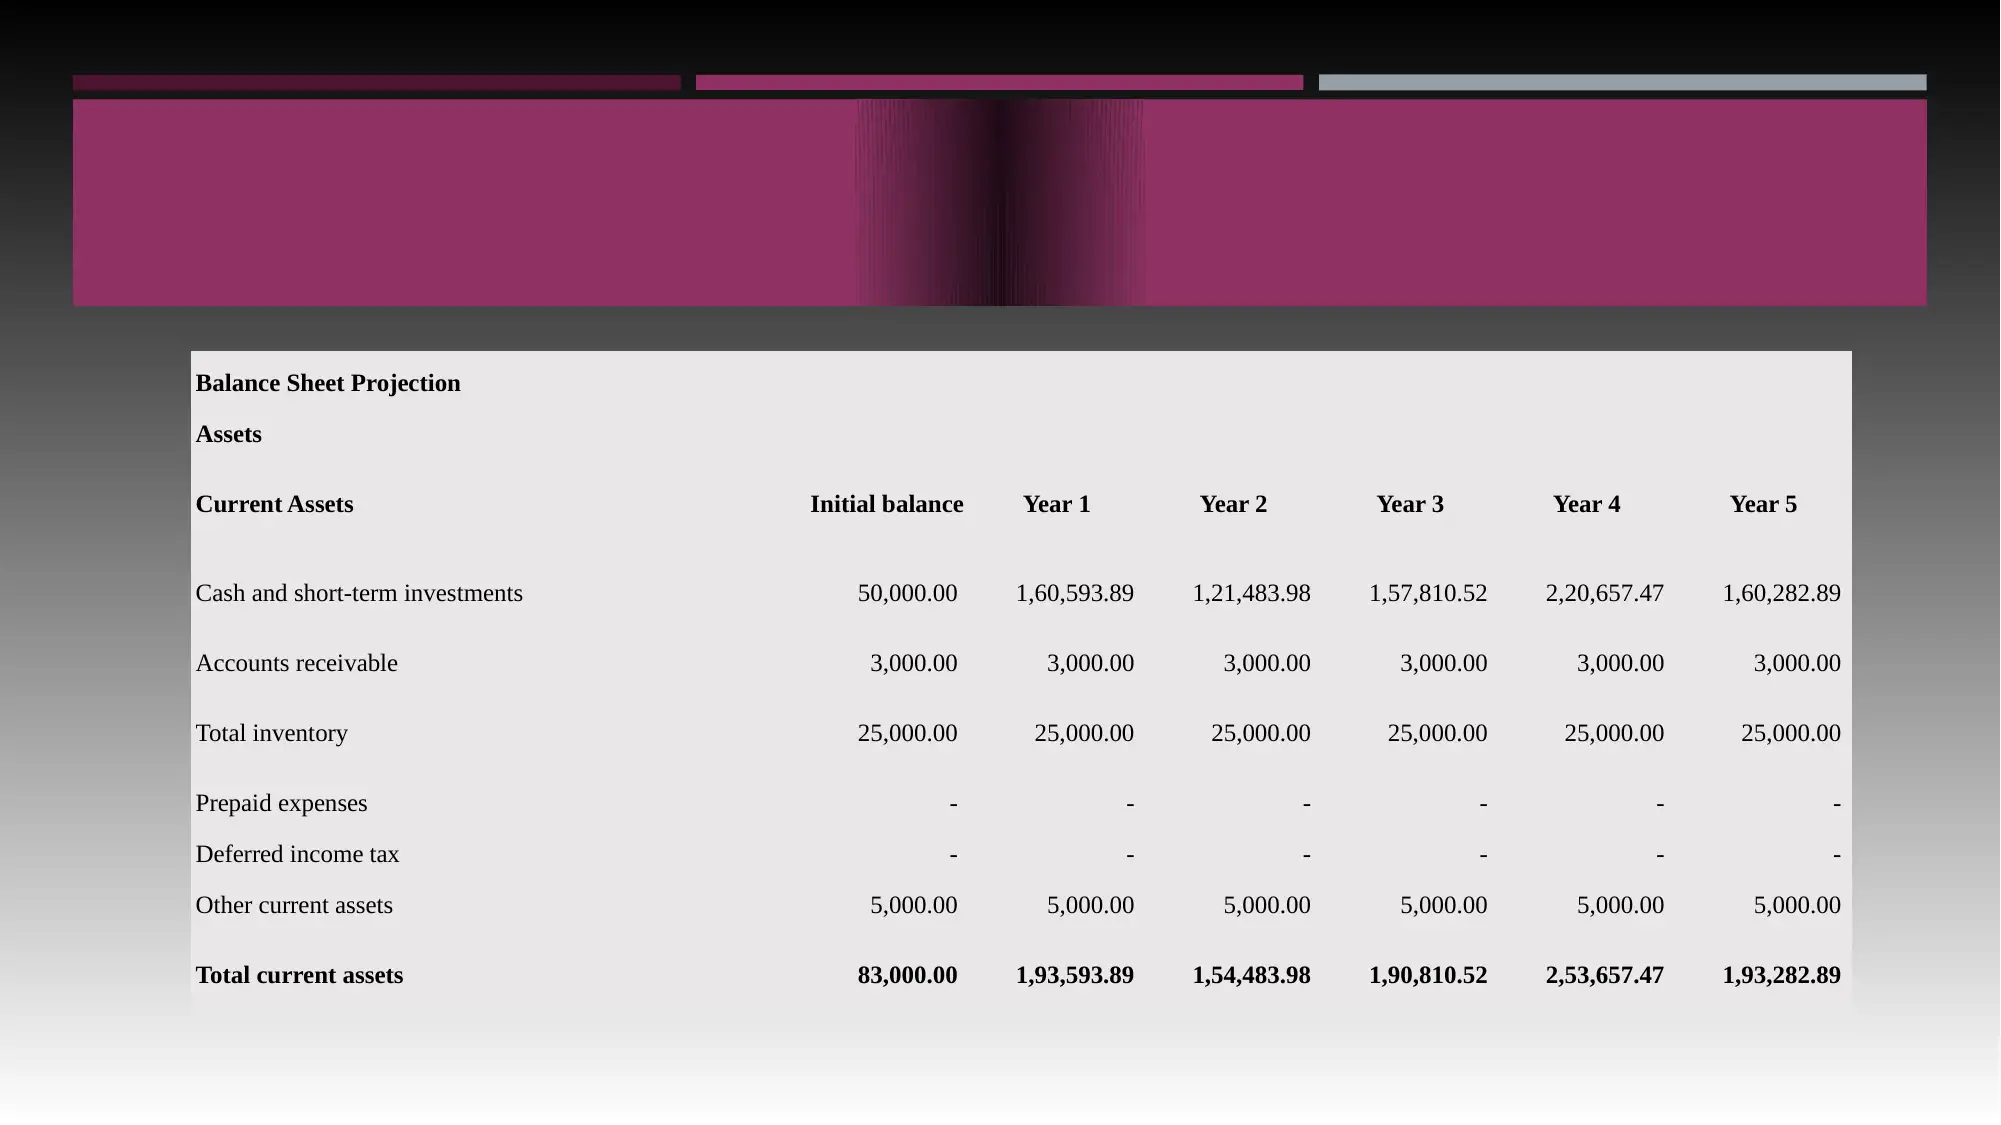
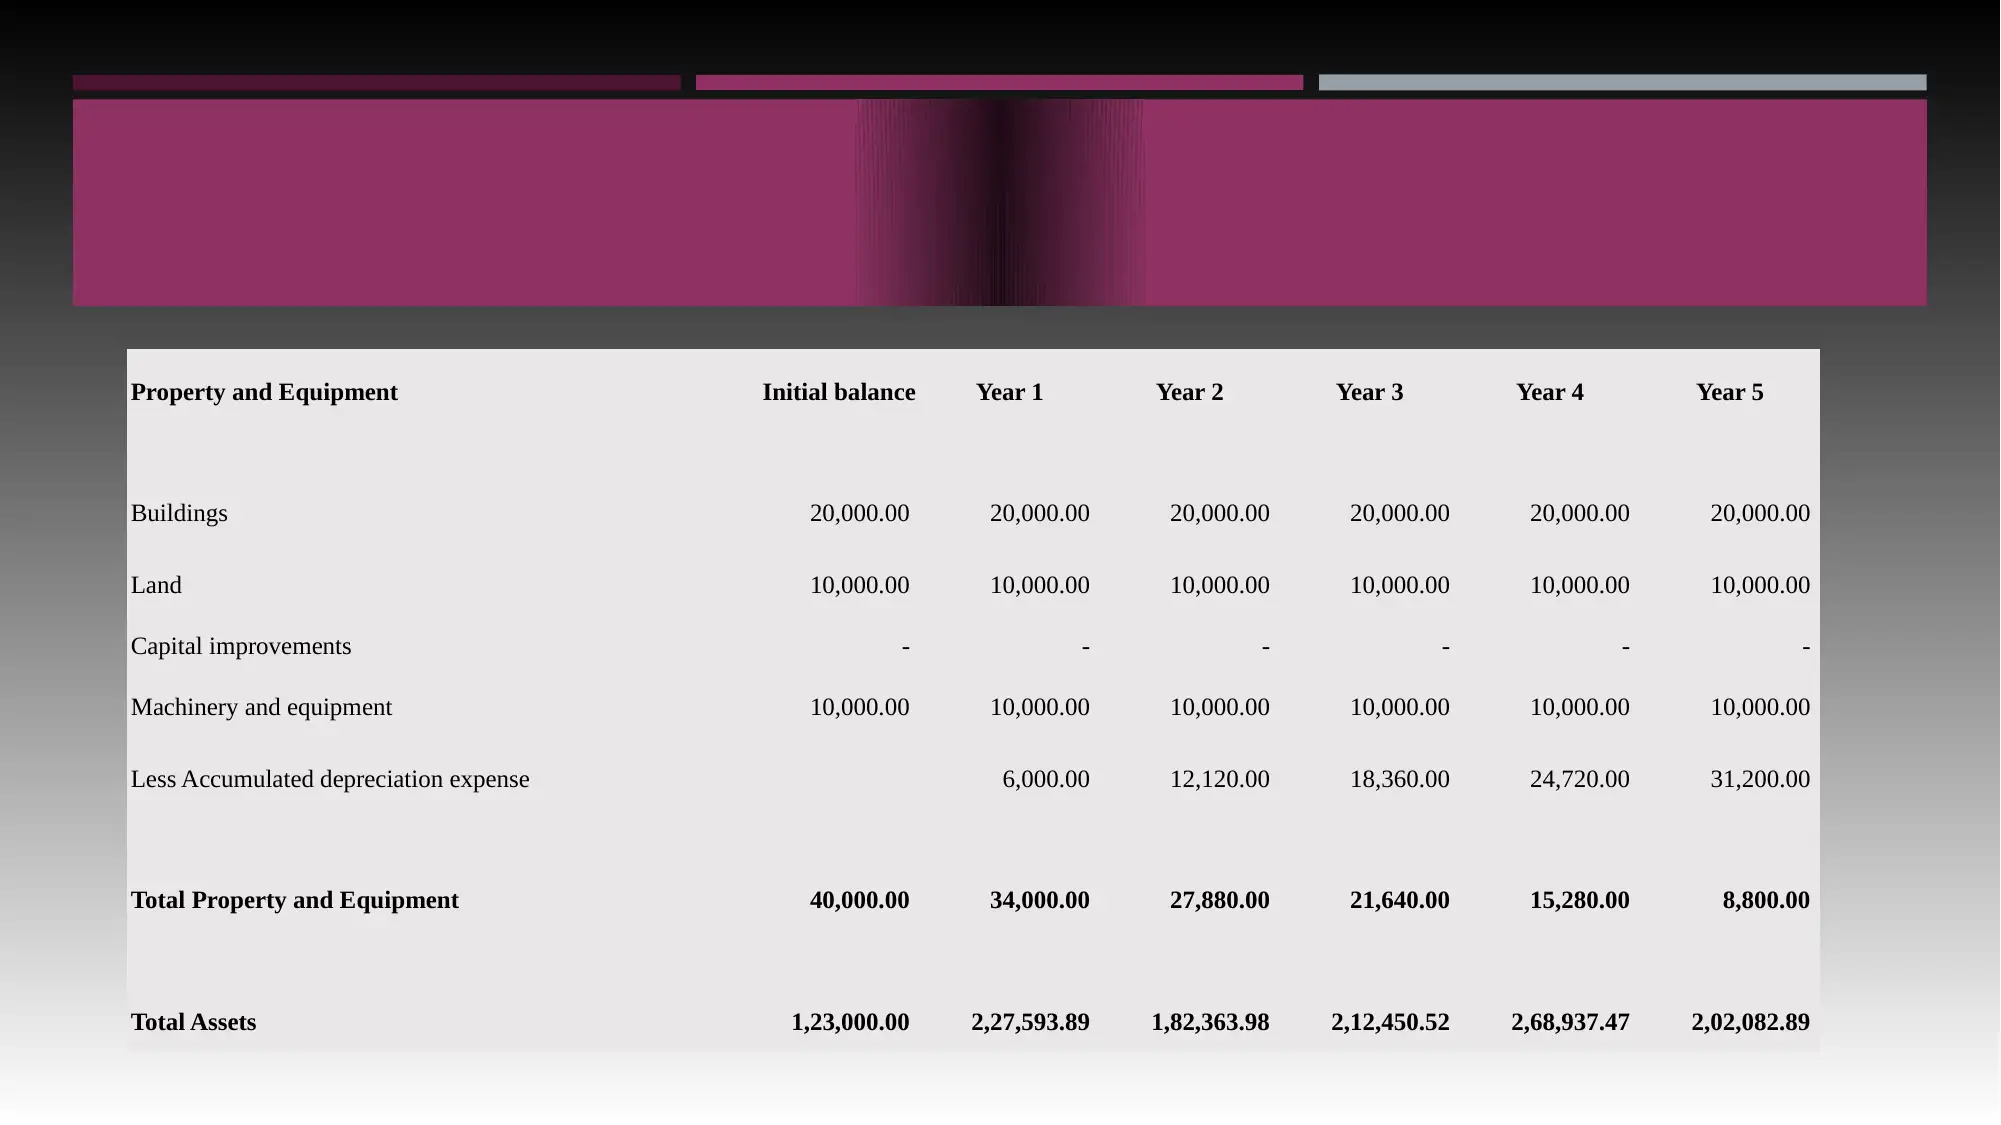
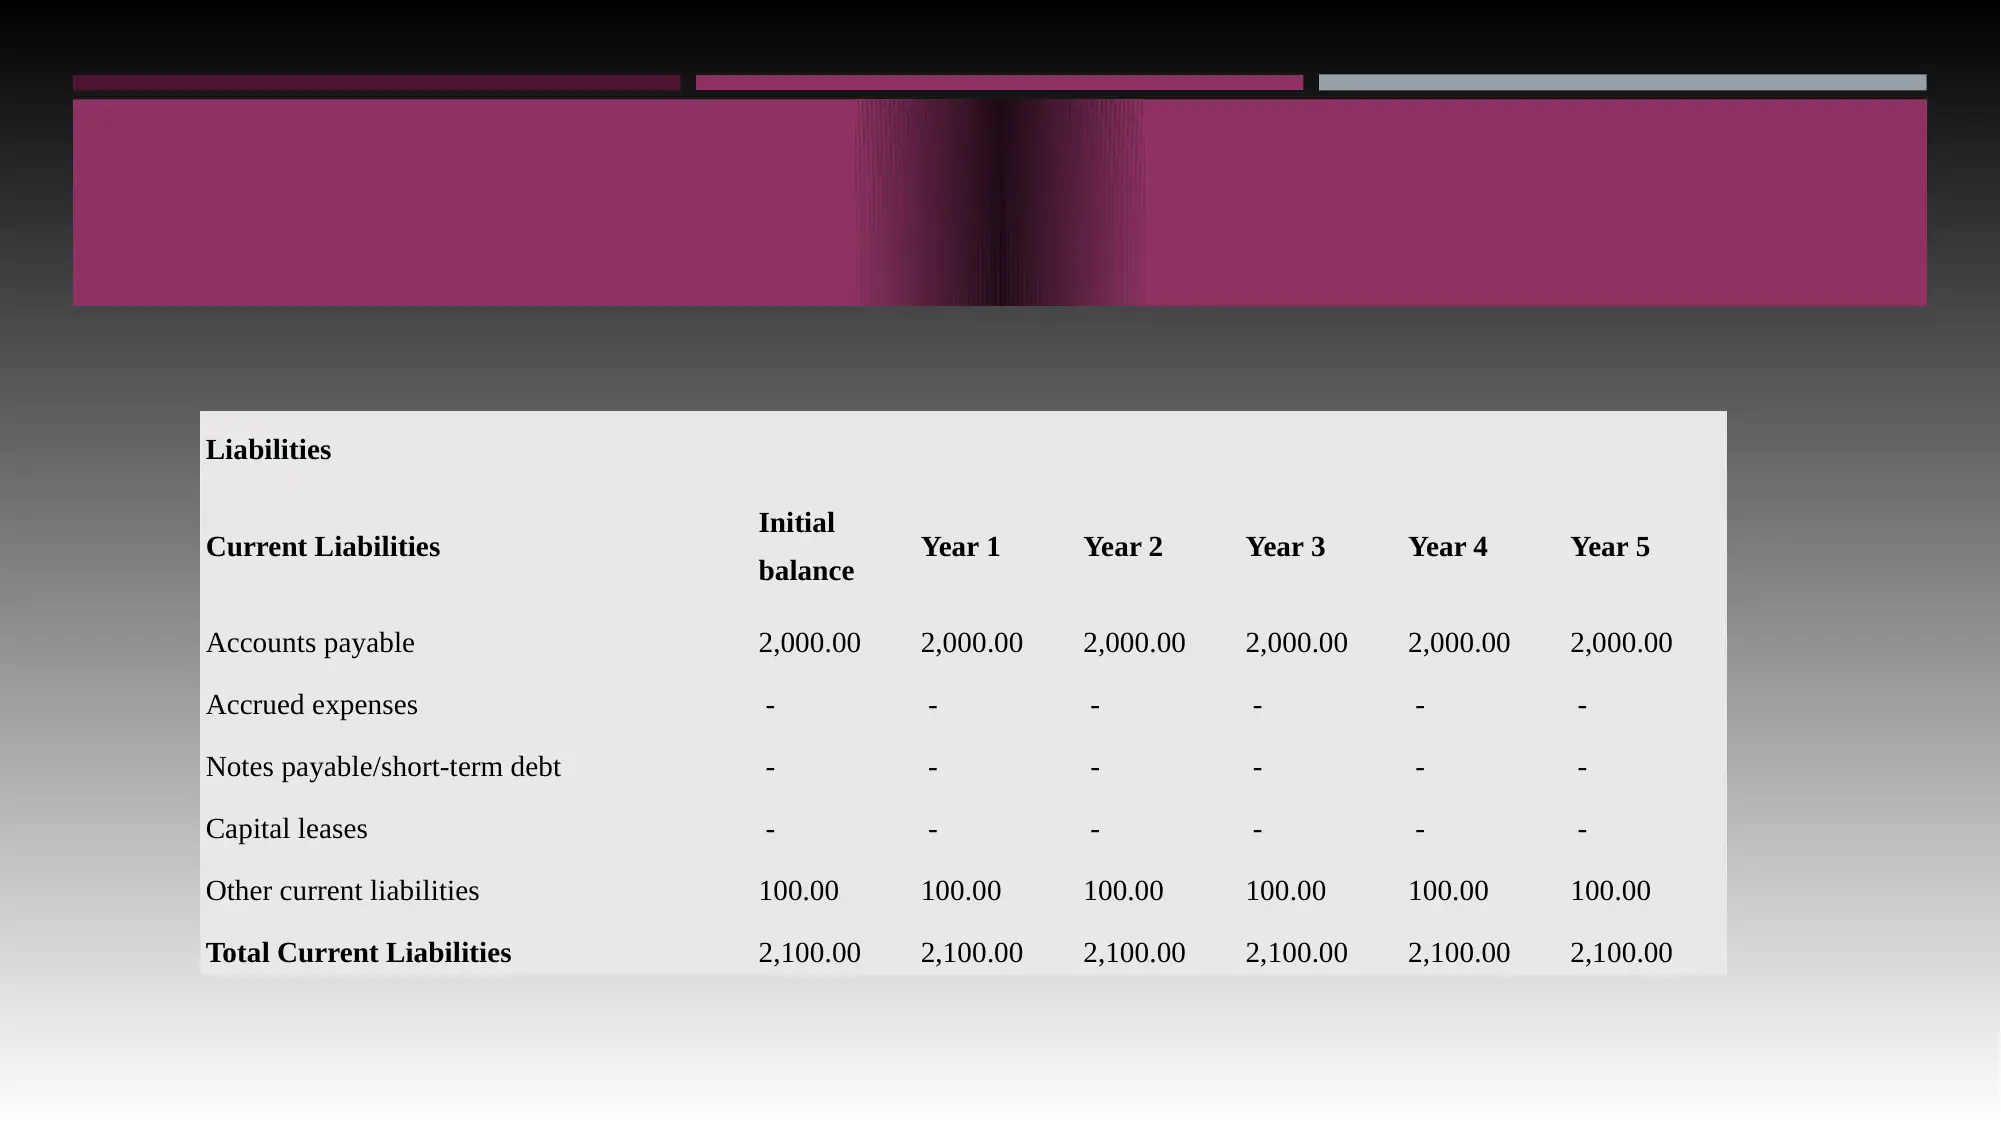
This financial plan presents a comprehensive 5-year projection for an eco-friendly straw company, analyzing the potential financial performance of a business selling natural wheat, biodegradable bamboo, milk flavoring, and edible straws. The plan includes detailed revenue forecasts, considering units sold and price increases, alongside a cost of goods sold analysis, factoring in material costs. It also incorporates operating expenses such as sales and marketing, depreciation, insurance, payroll, and utilities. The Profit and Loss statement projects income, expenses, and net profit over the five-year period, while the balance sheet outlines asset, liability, and equity projections. Furthermore, the plan considers loan details, tax rates, and inflation, providing a holistic view of the company's financial viability and growth potential. The plan details the company's financial performance, including revenue, cost of goods sold, expenses, and ultimately, the net profit. Projections are provided in the form of tables and financial statements, including a balance sheet, offering a detailed view of the company's financial health and future prospects. The plan also takes into account factors such as product price increases, annual inflation, and loan repayment terms, providing a comprehensive overview of the company's financial performance over the five-year period.
Document Page
Financial plan
tabler-icon-diamond-filled.svg

Paraphrase This Document

Need a fresh take? Get an instant paraphrase of this document with our AI Paraphraser
Document Page
5-Year Financial Plan
Company Name Eco-friendly Straw company
Forecasted Revenue
Units sold
annually
Natural Wheat Drinking Straws 270
Biodegradable Bamboo Straw 420
Milk Flavouring Straw 250
Edible Straws 520
Total Of Forecasted Revenue
Document Page
Cost Of Goods Sold
Expected
gross margin
Annual cost of
goods sold
Natural Wheat Drinking Straws 32% 9,072.00
Biodegradable Bamboo Straw 27% 10,773.00
Milk Flavouring Straw 22% 4,125.00
Edible Straws 30% 8,580.00
Total Cost Of Goods Sold 32,550.00
Document Page
Annual Maintenance, Repair And Overhaul
Factor (%) on capital equipment 15%
Asset Depreciation
Number of Years 5
Tax
Annual Tax Rate 30%
Inflation
Annual Inflation Rate 2%
Product Price Increase
Annual Price Increase 2%
Funding
Loan Amount 55,000.00
Annual interest rate 5.00%
Term of loan (months) 60
Monthly rate 0.41%
Payment 1,035.12
Total Amount Payable 62,107.31
tabler-icon-diamond-filled.svg

Paraphrase This Document

Need a fresh take? Get an instant paraphrase of this document with our AI Paraphraser
Document Page
Profit And Loss (Financial Plan)
Year 1 Year 2 Year 3 Year 4 Year 5
Annual cumulative price (revenue)
increase 0.00% 2.00% 4.00% 6.00% 8.00%
Annual cumulative inflation
(expense) increase 0.00% 2.00% 4.00% 6.00% 8.00%
Income
Year 1 Year 2 Year 3 Year 4 Year 5
Revenue
Document Page
Natural Wheat Drinking Straws 28,350.00 28,917.00 30,073.68 31,878.10 34,428.35
Biodegradable Bamboo Straw 39,900.00 40,698.00 42,325.92 44,865.48 48,454.71
Milk Flavouring Straw 18,750.00 19,125.00 19,890.00 21,083.40 22,770.07
Edible Straws 28,600.00 29,172.00 30,338.88 32,159.21 34,731.95
Total revenue 1,15,600.00 1,17,912.00 1,22,628.48 1,29,986.19 1,40,385.08
Cost of Sales
Natural Wheat Drinking Straws 9,072.00 9,253.44 9,623.58 10,200.99 11,017.07
Biodegradable Bamboo Straw 10,773.00 10,988.46 11,428.00 12,113.68 13,082.77
Milk Flavouring Straw 4,125.00 4,207.50 4,375.80 4,638.35 5,009.42
Edible Straws 8,580.00 8,751.60 9,101.66 9,647.76 10,419.58
Cost of goods sold 32,550.00 33,201.00 34,529.04 36,600.78 39,528.84
Document Page
Gross Profit 83,050.00 84,711.00 88,099.44 93,385.41 1,00,856.24
Non-Operation Income
Rental - - - - -
Interest income - - - - -
Loss (gain) on sale of assets - - 1,000.00 - -
Other income (specify) - - - - -
Total Non-Operation Income - - 1,000.00 - -
Total Income 83,050.00 84,711.00 89,099.44 93,385.41 1,00,856.24
tabler-icon-diamond-filled.svg

Paraphrase This Document

Need a fresh take? Get an instant paraphrase of this document with our AI Paraphraser
Document Page
Expenses
Operating expenses
Sales and marketing 15,000.00 15,300.00 15,912.00 16,866.72 18,216.06
Depreciation 6,000.00 6,120.00 6,240.00 6,360.00 6,480.00
Insurance 7,500.00 7,650.00 7,956.00 8,433.36 9,108.03
Payroll and Payroll Tax 21,000.00 21,420.00 22,276.80 23,613.41 25,502.48
Property taxes 2,500.00 2,550.00 2,652.00 2,811.12 3,036.01
Maintenance, repair, and overhaul 1,500.00 1,530.00 1,560.00 1,590.00 1,620.00
Utilities 5,000.00 5,100.00 5,304.00 5,622.24 6,072.02
Administrative fees 300.00 306.00 318.24 337.33 364.32
Interest expense on long-term debt 2,467.85 1,970.17 1,447.60 898.91 322.78
Other 1,000.00 1,020.00 1,060.80 1,124.45 1,214.40
Total operating expenses 62,267.85 62,966.17 64,727.44 67,657.54 71,936.10
Document Page
Total Expenses 62,267.85 62,966.17 64,727.44 67,657.54 71,936.10
Taxes
Income Tax 6,234.65 6,523.45 7,311.60 7,718.36 8,676.04
Other Tax (specify) - - - - -
Total Taxes 6,234.65 6,523.45 7,311.60 7,718.36 8,676.04
Net Profit 14,547.51 15,221.38 17,060.40 18,009.51 20,244.09
Document Page
Balance Sheet Projection
Assets
Current Assets Initial balance Year 1 Year 2 Year 3 Year 4 Year 5
Cash and short-term investments 50,000.00 1,60,593.89 1,21,483.98 1,57,810.52 2,20,657.47 1,60,282.89
Accounts receivable 3,000.00 3,000.00 3,000.00 3,000.00 3,000.00 3,000.00
Total inventory 25,000.00 25,000.00 25,000.00 25,000.00 25,000.00 25,000.00
Prepaid expenses - - - - - -
Deferred income tax - - - - - -
Other current assets 5,000.00 5,000.00 5,000.00 5,000.00 5,000.00 5,000.00
Total current assets 83,000.00 1,93,593.89 1,54,483.98 1,90,810.52 2,53,657.47 1,93,282.89
tabler-icon-diamond-filled.svg

Paraphrase This Document

Need a fresh take? Get an instant paraphrase of this document with our AI Paraphraser
Document Page
Property and Equipment Initial balance Year 1 Year 2 Year 3 Year 4 Year 5
Buildings 20,000.00 20,000.00 20,000.00 20,000.00 20,000.00 20,000.00
Land 10,000.00 10,000.00 10,000.00 10,000.00 10,000.00 10,000.00
Capital improvements - - - - - -
Machinery and equipment 10,000.00 10,000.00 10,000.00 10,000.00 10,000.00 10,000.00
Less Accumulated depreciation expense 6,000.00 12,120.00 18,360.00 24,720.00 31,200.00
Total Property and Equipment 40,000.00 34,000.00 27,880.00 21,640.00 15,280.00 8,800.00
Total Assets 1,23,000.00 2,27,593.89 1,82,363.98 2,12,450.52 2,68,937.47 2,02,082.89
Document Page
Liabilities
Current Liabilities Initial
balance Year 1 Year 2 Year 3 Year 4 Year 5
Accounts payable 2,000.00 2,000.00 2,000.00 2,000.00 2,000.00 2,000.00
Accrued expenses - - - - - -
Notes payable/short-term debt - - - - - -
Capital leases - - - - - -
Other current liabilities 100.00 100.00 100.00 100.00 100.00 100.00
Total Current Liabilities 2,100.00 2,100.00 2,100.00 2,100.00 2,100.00 2,100.00
chevron_up_icon
1 out of 14
circle_padding
hide_on_mobile
zoom_out_icon
[object Object]