Business Analysis Project: Eco World Development Group Berhad - Report
VerifiedAdded on 2023/06/10
|30
|6493
|332
Project
AI Summary
This project conducts a critical business analysis of Eco World Development Group Berhad, a Malaysian property development company, comparing its performance with SP Setia Berhad and MAH Sing Group Berhad. The analysis includes a detailed examination of the company's background, key issues, and comparative value proposition. It delves into financial analysis, utilizing ratio analysis to assess profitability (ROIC, net profit margin, ROA), liquidity (current and quick ratios), financial health, and solvency. The project also incorporates strategic analysis, including PESTLE and Porter's Five Forces analyses, to evaluate the business environment and competitive forces. Furthermore, it explores operations and organizational analysis, key success factors, and the application of a Balance Scorecard and Ansoff's matrix. The report concludes with recommendations, modeling, and scenario forecasting to provide actionable insights for improving Eco World's performance and competitive position in the Malaysian property market. The project highlights limitations of financial models and conventional analysis, offering a comprehensive overview of the company's strengths, weaknesses, opportunities, and threats.
Running head: BUSINESS ANALYSIS PROJECT
Business Analysis Project
Name of the Student
Name of the University
Authors Note
Course ID
Business Analysis Project
Name of the Student
Name of the University
Authors Note
Course ID
Paraphrase This Document
Need a fresh take? Get an instant paraphrase of this document with our AI Paraphraser
1BUSINESS ANALYSIS PROJECT
Table of Contents
Introduction:...............................................................................................................................3
Purpose:......................................................................................................................................3
Case Analysis:............................................................................................................................3
Company background:...............................................................................................................4
Key issues:.................................................................................................................................4
Comparative Value Proposition:................................................................................................5
Rationale of my choice of company:.........................................................................................6
Financial Analysis:.....................................................................................................................6
Ratio Analysis:...........................................................................................................................7
2.1.1 Profitability: Return on Invested Capital%:......................................................................7
Net profit margin%:...................................................................................................................8
Return on Assets:.......................................................................................................................9
Liquidity: Current Ratio:..........................................................................................................10
Quick Ratio:.............................................................................................................................11
Financial health: Financial Leverage:......................................................................................12
Solvency: Cash Flow per sale%:..............................................................................................13
Strategic Analysis:...................................................................................................................14
Business Environment Analysis:..............................................................................................14
PESTLE Analysis.....................................................................................................................14
Competitive Force Analysis:....................................................................................................16
2BUSINESS ANALYSIS PROJECT
Porter’s five forces:..................................................................................................................16
New forces in the industry:......................................................................................................18
Operations and organizational analysis:...................................................................................18
Key success factors:.................................................................................................................18
Balance Scorecard:...................................................................................................................19
Ansoff’s matrix:.......................................................................................................................20
Limitations of financial models and conventional analysis:....................................................21
Conclusion:..............................................................................................................................21
Recommendations:...................................................................................................................22
Recommendations modelling...................................................................................................22
Model Scenario Forecasting:....................................................................................................23
Outcomes:................................................................................................................................24
Scenario Description................................................................................................................24
Outcome:..................................................................................................................................25
Reference List:.........................................................................................................................26
⊘ This is a preview!⊘
Do you want full access?
Subscribe today to unlock all pages.
Trusted by 1+ million students worldwide
3BUSINESS ANALYSIS PROJECT
Introduction:
Purpose:
The objective of the study is to conduct a critical analysis relating to the competitive
position of Eco World Development Group Berhad and compare the company’s performance
with the SP Setia Berhad and MAH Sing Group Berhad. The report would be discussing the
competitive issues that is faced by the Eco World Development Group Berhad by
benchmarking the company with the competitive firms SP Setia Berhad and MAH Sing
Group Berhad. The analysis would be critical it offers a transparent picture and understanding
of the main issues that would be influencing the business and the management. Besides, the
study would be offering appropriate recommendations that would be addressing the vital
business faced by the Eco World Development Group Berhad and improving its productivity
as well.
Case Analysis:
Eco World Development Group Berhad has kepts its brand spread across the three
key economic regions in the Malaysia that includes 18 development of projects in total
(Ecoworld.my 2018). It also comprises of the new townships, integrated commercial
development, luxury high-rise apartments and business parks. The company has expanded its
operations both across the local and international markets. Over the years the company the
company has grown in the form of well-known and respected industry players in the property
sector of Malaysia. The expansion of company is facilitated by the vital developments in the
commercial development since the government backing has resulted in company’s expansion.
Paraphrase This Document
Need a fresh take? Get an instant paraphrase of this document with our AI Paraphraser
4BUSINESS ANALYSIS PROJECT
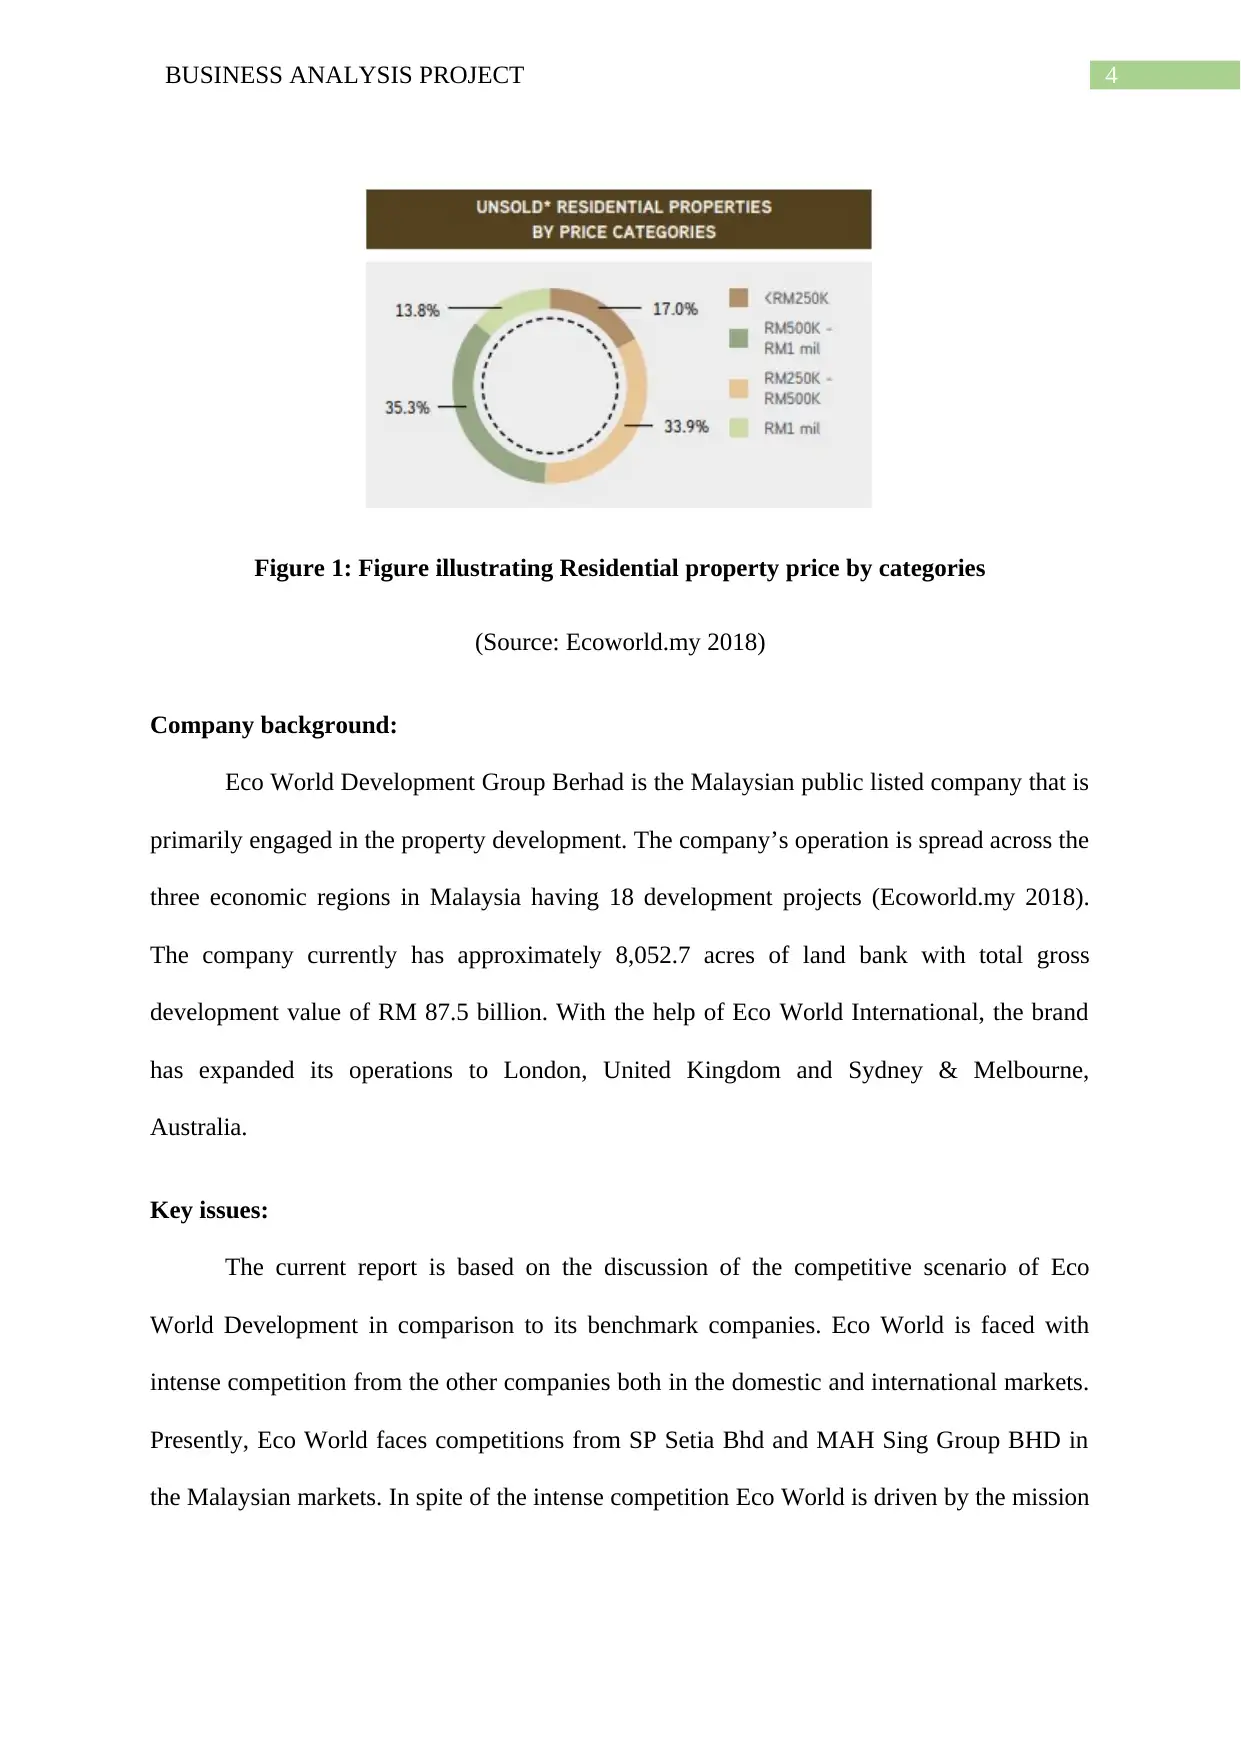
Figure 1: Figure illustrating Residential property price by categories
(Source: Ecoworld.my 2018)
Company background:
Eco World Development Group Berhad is the Malaysian public listed company that is
primarily engaged in the property development. The company’s operation is spread across the
three economic regions in Malaysia having 18 development projects (Ecoworld.my 2018).
The company currently has approximately 8,052.7 acres of land bank with total gross
development value of RM 87.5 billion. With the help of Eco World International, the brand
has expanded its operations to London, United Kingdom and Sydney & Melbourne,
Australia.
Key issues:
The current report is based on the discussion of the competitive scenario of Eco
World Development in comparison to its benchmark companies. Eco World is faced with
intense competition from the other companies both in the domestic and international markets.
Presently, Eco World faces competitions from SP Setia Bhd and MAH Sing Group BHD in
the Malaysian markets. In spite of the intense competition Eco World is driven by the mission
5BUSINESS ANALYSIS PROJECT
of creating a better tomorrow which is powered by the team of experience and dynamic team.
The brand of Eco World is expected to attain growth in the coming years.
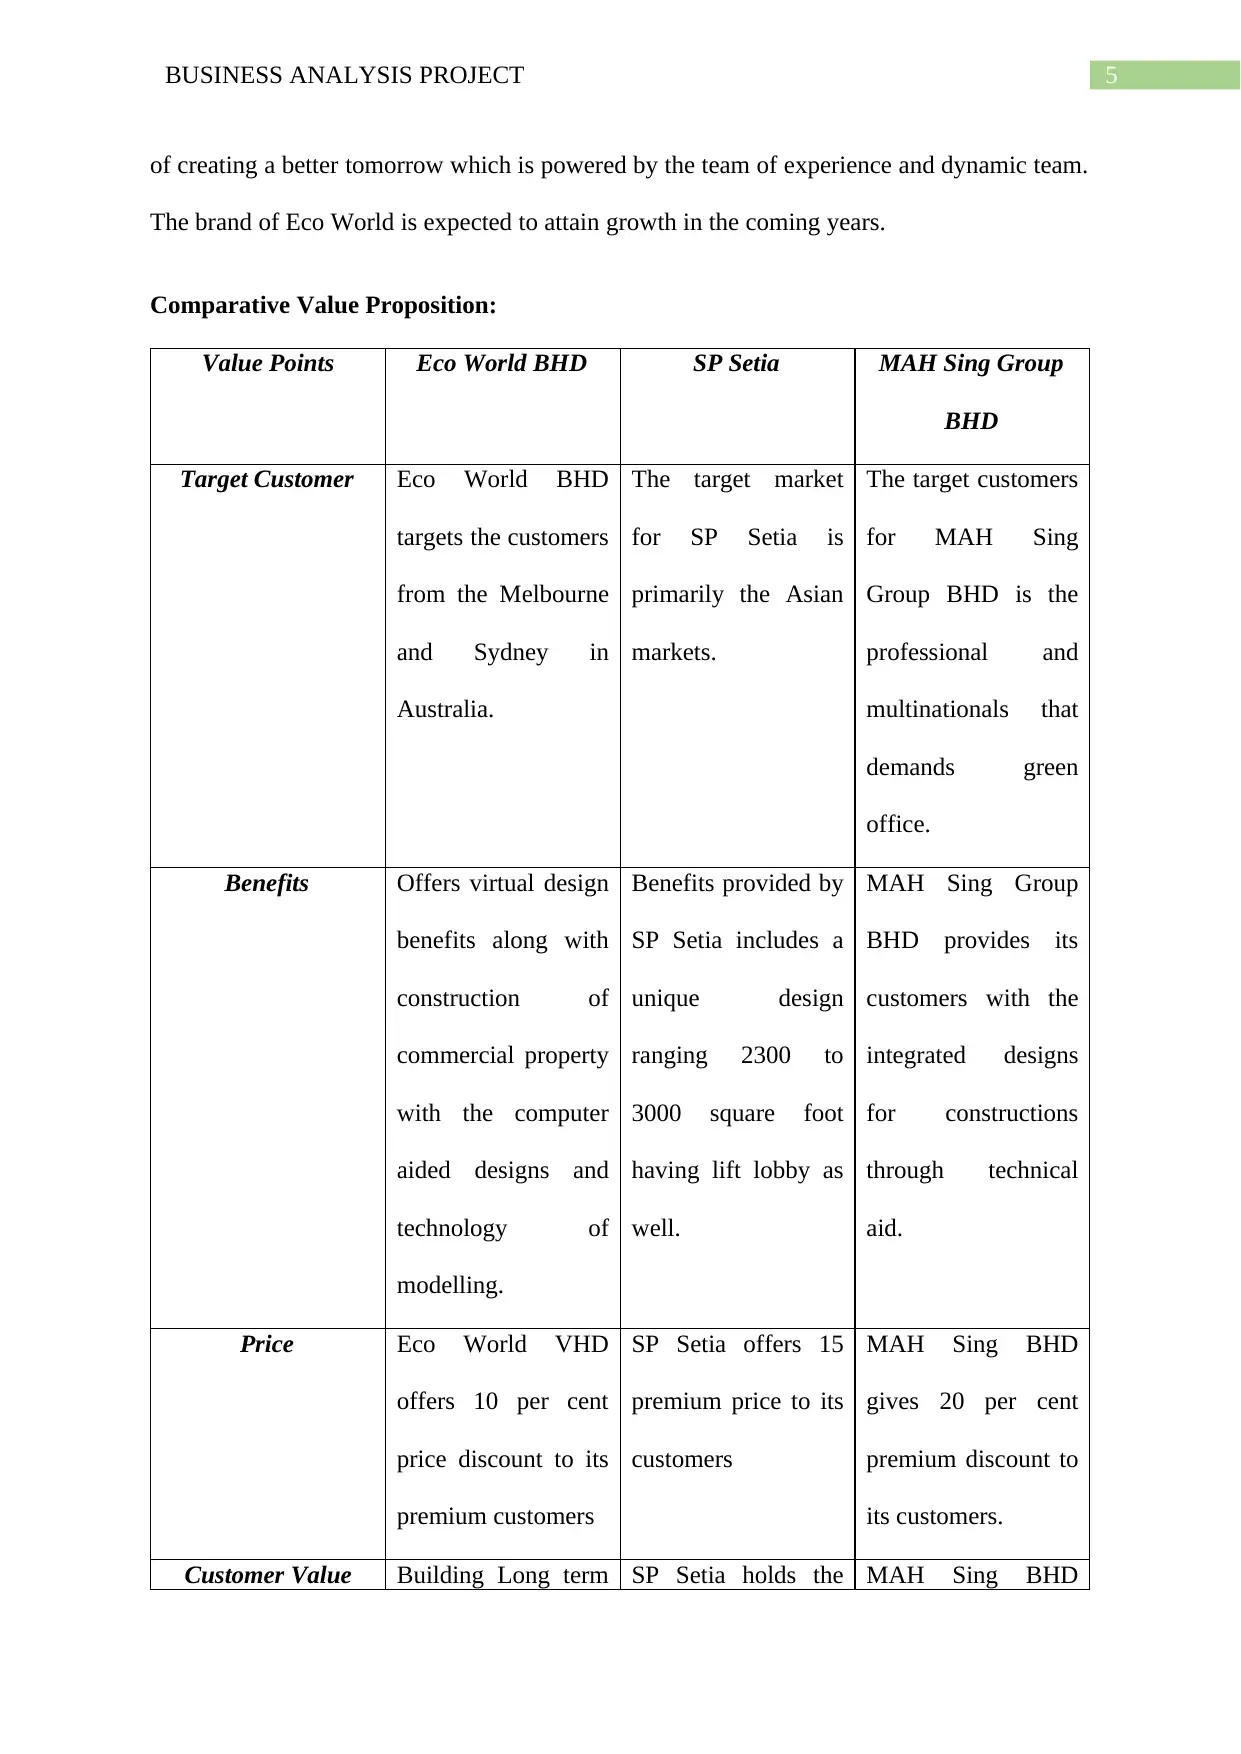
Comparative Value Proposition:
Value Points Eco World BHD SP Setia MAH Sing Group
BHD
Target Customer Eco World BHD
targets the customers
from the Melbourne
and Sydney in
Australia.
The target market
for SP Setia is
primarily the Asian
markets.
The target customers
for MAH Sing
Group BHD is the
professional and
multinationals that
demands green
office.
Benefits Offers virtual design
benefits along with
construction of
commercial property
with the computer
aided designs and
technology of
modelling.
Benefits provided by
SP Setia includes a
unique design
ranging 2300 to
3000 square foot
having lift lobby as
well.
MAH Sing Group
BHD provides its
customers with the
integrated designs
for constructions
through technical
aid.
Price Eco World VHD
offers 10 per cent
price discount to its
premium customers
SP Setia offers 15
premium price to its
customers
MAH Sing BHD
gives 20 per cent
premium discount to
its customers.
Customer Value Building Long term SP Setia holds the MAH Sing BHD
of creating a better tomorrow which is powered by the team of experience and dynamic team.
The brand of Eco World is expected to attain growth in the coming years.
Comparative Value Proposition:
Value Points Eco World BHD SP Setia MAH Sing Group
BHD
Target Customer Eco World BHD
targets the customers
from the Melbourne
and Sydney in
Australia.
The target market
for SP Setia is
primarily the Asian
markets.
The target customers
for MAH Sing
Group BHD is the
professional and
multinationals that
demands green
office.
Benefits Offers virtual design
benefits along with
construction of
commercial property
with the computer
aided designs and
technology of
modelling.
Benefits provided by
SP Setia includes a
unique design
ranging 2300 to
3000 square foot
having lift lobby as
well.
MAH Sing Group
BHD provides its
customers with the
integrated designs
for constructions
through technical
aid.
Price Eco World VHD
offers 10 per cent
price discount to its
premium customers
SP Setia offers 15
premium price to its
customers
MAH Sing BHD
gives 20 per cent
premium discount to
its customers.
Customer Value Building Long term SP Setia holds the MAH Sing BHD
⊘ This is a preview!⊘
Do you want full access?
Subscribe today to unlock all pages.
Trusted by 1+ million students worldwide
6BUSINESS ANALYSIS PROJECT
customer value with
its customers.
integrity and
safeguards
customer’s privacy
with the help of
company’s
confidential
information policy.
provides long term
its customers with
the long term
outlook for
residential property
market.
Table 1: Table depicting Customer Value Proposition
(Source: As Created by Author)
Rationale of my choice of company:
The primary purpose of selecting Eco World Development Group Berhad is because
the company has been growing and attaining new heights. The company is helmed as the
most renowned and respected players in the Malaysian property industry. In spite of the
strong international presence, Eco World faces intense competition from the other industry
players. The rationale for my choice of company is primarily because of its market presence
for more than 15 years. This helps in analysing the company’s present market trend and a
comparative market position with other industry participants.
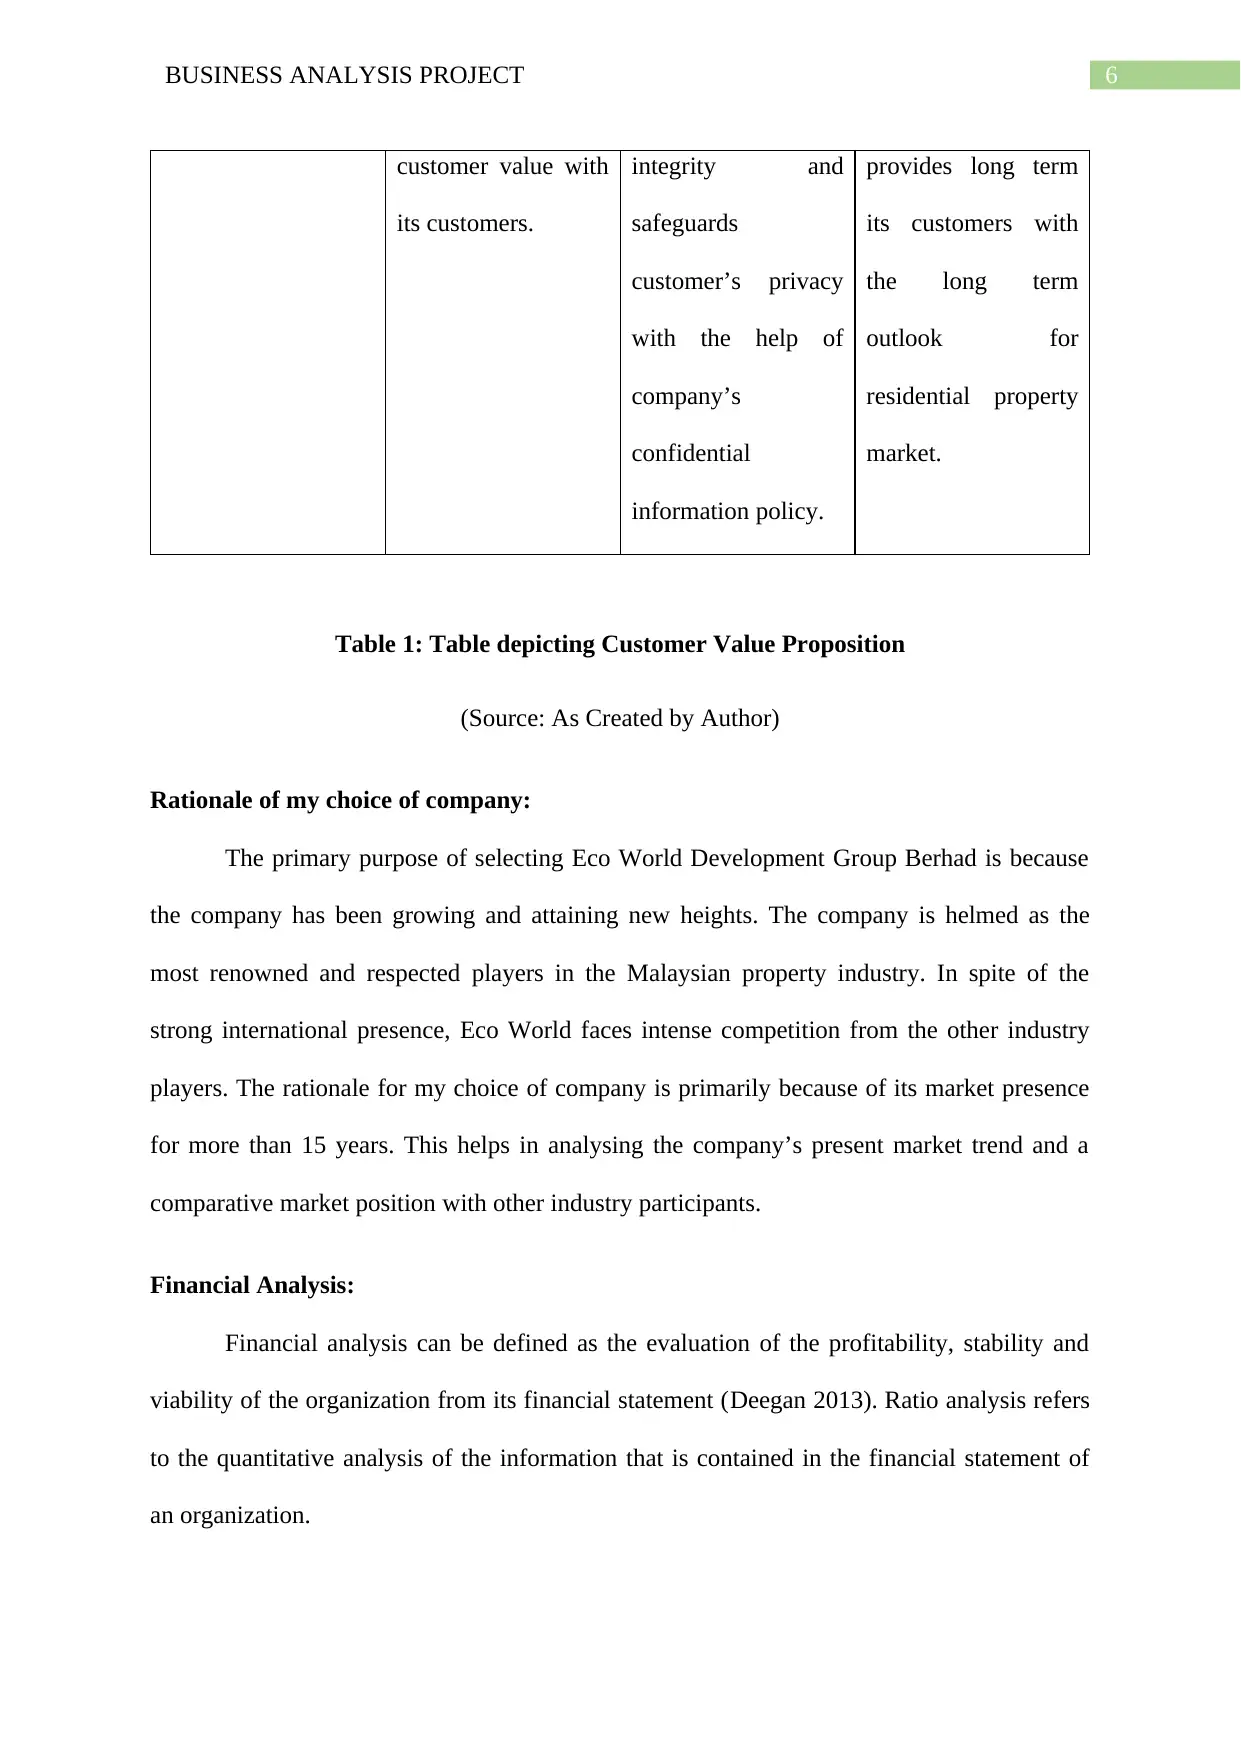
Financial Analysis:
Financial analysis can be defined as the evaluation of the profitability, stability and
viability of the organization from its financial statement (Deegan 2013). Ratio analysis refers
to the quantitative analysis of the information that is contained in the financial statement of
an organization.
customer value with
its customers.
integrity and
safeguards
customer’s privacy
with the help of
company’s
confidential
information policy.
provides long term
its customers with
the long term
outlook for
residential property
market.
Table 1: Table depicting Customer Value Proposition
(Source: As Created by Author)
Rationale of my choice of company:
The primary purpose of selecting Eco World Development Group Berhad is because
the company has been growing and attaining new heights. The company is helmed as the
most renowned and respected players in the Malaysian property industry. In spite of the
strong international presence, Eco World faces intense competition from the other industry
players. The rationale for my choice of company is primarily because of its market presence
for more than 15 years. This helps in analysing the company’s present market trend and a
comparative market position with other industry participants.
Financial Analysis:
Financial analysis can be defined as the evaluation of the profitability, stability and
viability of the organization from its financial statement (Deegan 2013). Ratio analysis refers
to the quantitative analysis of the information that is contained in the financial statement of
an organization.
Paraphrase This Document
Need a fresh take? Get an instant paraphrase of this document with our AI Paraphraser
7BUSINESS ANALYSIS PROJECT
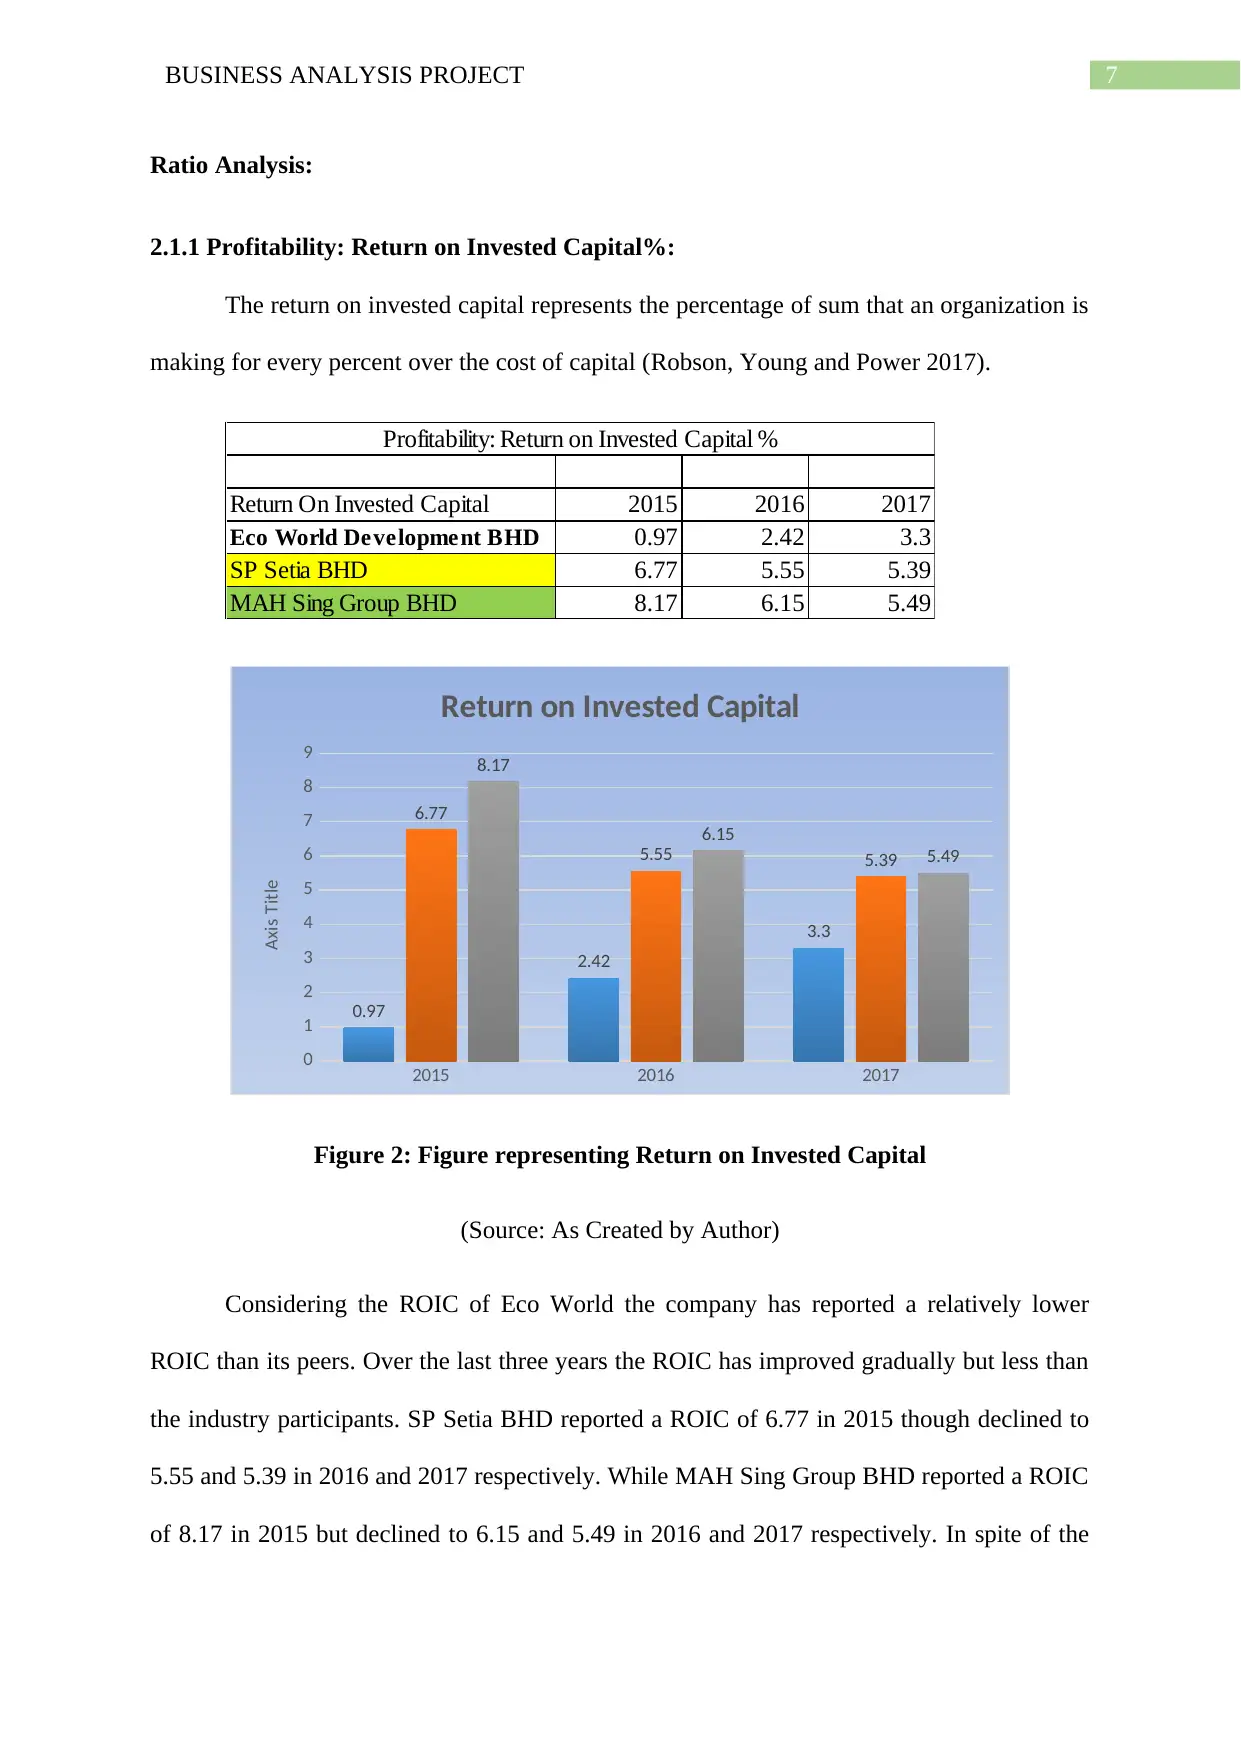
Ratio Analysis:
2.1.1 Profitability: Return on Invested Capital%:
The return on invested capital represents the percentage of sum that an organization is
making for every percent over the cost of capital (Robson, Young and Power 2017).
Return On Invested Capital 2015 2016 2017
Eco World Development BHD 0.97 2.42 3.3
SP Setia BHD 6.77 5.55 5.39
MAH Sing Group BHD 8.17 6.15 5.49
Profitability: Return on Invested Capital %
2015 2016 2017
0
1
2
3
4
5
6
7
8
9
0.97
2.42
3.3
6.77
5.55 5.39
8.17
6.15
5.49
Return on Invested Capital
Axis Title
Figure 2: Figure representing Return on Invested Capital
(Source: As Created by Author)
Considering the ROIC of Eco World the company has reported a relatively lower
ROIC than its peers. Over the last three years the ROIC has improved gradually but less than
the industry participants. SP Setia BHD reported a ROIC of 6.77 in 2015 though declined to
5.55 and 5.39 in 2016 and 2017 respectively. While MAH Sing Group BHD reported a ROIC
of 8.17 in 2015 but declined to 6.15 and 5.49 in 2016 and 2017 respectively. In spite of the
8BUSINESS ANALYSIS PROJECT
lower ROIC Eco World BHD generates better returns and has used its capital effectively
while SP Setia in spite of generating attractive returns on the invested capital has failed to
capitalize in the later years. MAH Sing Group BHD has represented a better performance on
its return however its stocks are witnessing a decline due to the fluctuating market demand.
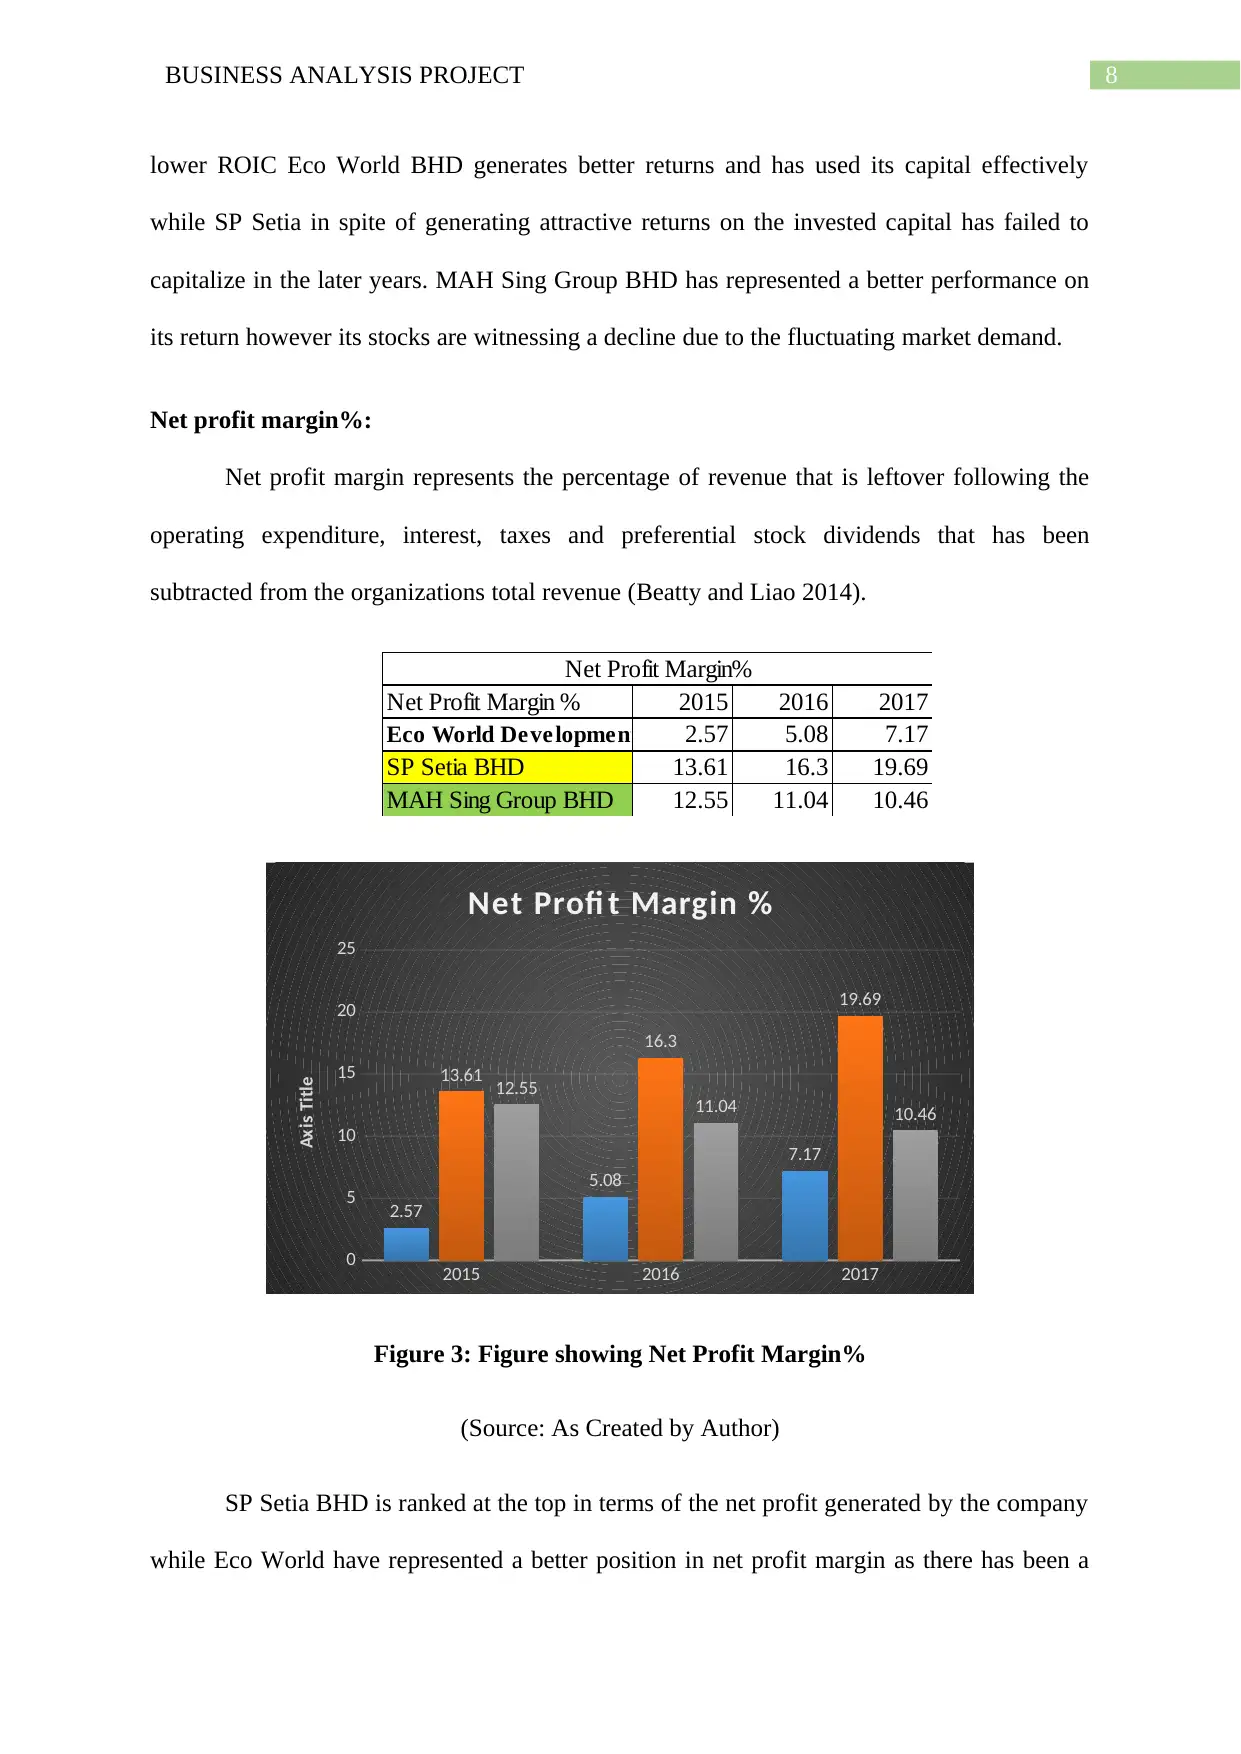
Net profit margin%:
Net profit margin represents the percentage of revenue that is leftover following the
operating expenditure, interest, taxes and preferential stock dividends that has been
subtracted from the organizations total revenue (Beatty and Liao 2014).
Net Profit Margin % 2015 2016 2017
Eco World Development BHD2.57 5.08 7.17
SP Setia BHD 13.61 16.3 19.69
MAH Sing Group BHD 12.55 11.04 10.46
Net Profit Margin%
2015 2016 2017
0
5
10
15
20
25
2.57
5.08
7.17
13.61
16.3
19.69
12.55 11.04 10.46
Net Profi t Margin %
Axis Title
Figure 3: Figure showing Net Profit Margin%
(Source: As Created by Author)
SP Setia BHD is ranked at the top in terms of the net profit generated by the company
while Eco World have represented a better position in net profit margin as there has been a
lower ROIC Eco World BHD generates better returns and has used its capital effectively
while SP Setia in spite of generating attractive returns on the invested capital has failed to
capitalize in the later years. MAH Sing Group BHD has represented a better performance on
its return however its stocks are witnessing a decline due to the fluctuating market demand.
Net profit margin%:
Net profit margin represents the percentage of revenue that is leftover following the
operating expenditure, interest, taxes and preferential stock dividends that has been
subtracted from the organizations total revenue (Beatty and Liao 2014).
Net Profit Margin % 2015 2016 2017
Eco World Development BHD2.57 5.08 7.17
SP Setia BHD 13.61 16.3 19.69
MAH Sing Group BHD 12.55 11.04 10.46
Net Profit Margin%
2015 2016 2017
0
5
10
15
20
25
2.57
5.08
7.17
13.61
16.3
19.69
12.55 11.04 10.46
Net Profi t Margin %
Axis Title
Figure 3: Figure showing Net Profit Margin%
(Source: As Created by Author)
SP Setia BHD is ranked at the top in terms of the net profit generated by the company
while Eco World have represented a better position in net profit margin as there has been a
⊘ This is a preview!⊘
Do you want full access?
Subscribe today to unlock all pages.
Trusted by 1+ million students worldwide
9BUSINESS ANALYSIS PROJECT
steady rise in net margin over the last three years. MAH Sing Group has kept a relatively
stable net profit margin and it is generating better net margin over the total sales revenue
(Henderson et al. 2015). Eco World reported a lower net profit margin during 2015 with
figures standing 2.57% however it gained strength in 2016 and 2017 as the net profit margin
improved to 5.08% and 7.17% respectively.
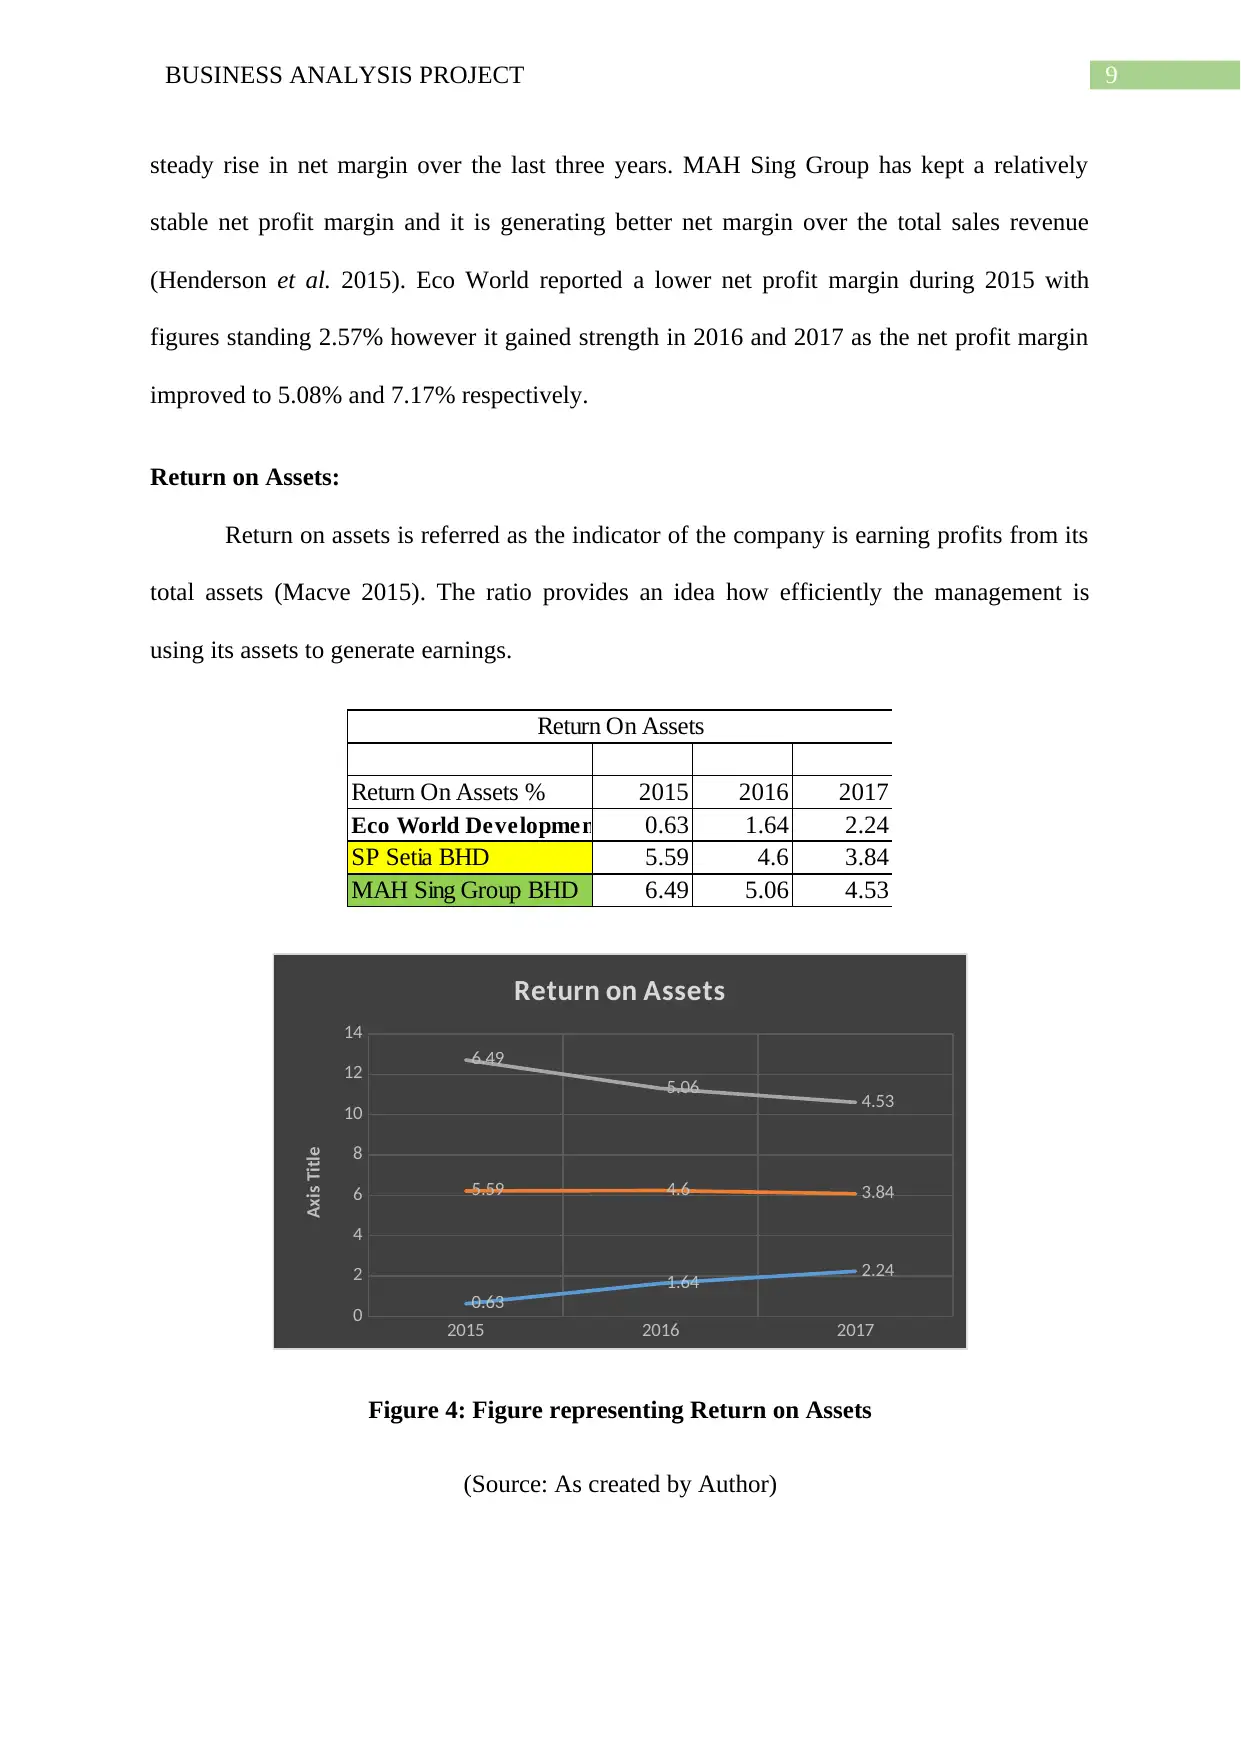
Return on Assets:
Return on assets is referred as the indicator of the company is earning profits from its
total assets (Macve 2015). The ratio provides an idea how efficiently the management is
using its assets to generate earnings.
Return On Assets % 2015 2016 2017
Eco World Development BHD0.63 1.64 2.24
SP Setia BHD 5.59 4.6 3.84
MAH Sing Group BHD 6.49 5.06 4.53
Return On Assets
2015 2016 2017
0
2
4
6
8
10
12
14
0.63
1.64 2.24
5.59 4.6 3.84
6.49
5.06 4.53
Return on Assets
Axis Title
Figure 4: Figure representing Return on Assets
(Source: As created by Author)
steady rise in net margin over the last three years. MAH Sing Group has kept a relatively
stable net profit margin and it is generating better net margin over the total sales revenue
(Henderson et al. 2015). Eco World reported a lower net profit margin during 2015 with
figures standing 2.57% however it gained strength in 2016 and 2017 as the net profit margin
improved to 5.08% and 7.17% respectively.
Return on Assets:
Return on assets is referred as the indicator of the company is earning profits from its
total assets (Macve 2015). The ratio provides an idea how efficiently the management is
using its assets to generate earnings.
Return On Assets % 2015 2016 2017
Eco World Development BHD0.63 1.64 2.24
SP Setia BHD 5.59 4.6 3.84
MAH Sing Group BHD 6.49 5.06 4.53
Return On Assets
2015 2016 2017
0
2
4
6
8
10
12
14
0.63
1.64 2.24
5.59 4.6 3.84
6.49
5.06 4.53
Return on Assets
Axis Title
Figure 4: Figure representing Return on Assets
(Source: As created by Author)
Paraphrase This Document
Need a fresh take? Get an instant paraphrase of this document with our AI Paraphraser
10BUSINESS ANALYSIS PROJECT
Eco World is standing in the lower position in converting its investment from its net
profit in comparison to its competitors. The ROA for MAH Sing Group BHD stands better in
throughout the three years. SP Setia BHD is ranked second behind the MAH Sing group from
2015 to 2017. At the time of studying the ROA of Eco World the management has done a
better job in making the judicious choice in allocating the resources. Alternatively, it is
understood that the company is making a better profit with lower amount of investment.
Liquidity: Current Ratio:
The current ratio refers to the liquidity ratio which measures the organization’s
capability to pay the short-term and long term obligations (Khan 2015). The understand this
capability, the current ratio takes into the account the current total assets of the company
relative to its current total liabilities.
Current Ratio 2015 2016 2017
Eco World Development BHD 1.51 1.4 1.22
SP Setia BHD 1.94 2.17 1.43
MAH Sing Group BHD 3.43 3.1 3
Current Ratio
2015 2016 2017
0
0.5
1
1.5
2
2.5
3
3.5
1.51 1.4 1.22
1.94 2.17
1.43
3.43
3.1 3
Current Ratio
Axis Title
Figure 5: Figure representing Current Ratio
11BUSINESS ANALYSIS PROJECT
(Source: As created by Author)
Eco World BHD is ranked in third position in comparison to the industry rivalry. This
represents that SP Setia BHD and MAH Sing Group has reported a better current ratio and
are more capable of paying their obligations. The current ratio for Eco World BHD reflects
that the company’s operating cycle is moderately efficient and is able to pay its current
liabilities with reduced inventory turnover. While the liquidity of MAH Sing Group BHD is
stronger reflecting that the company has stronger efficiency cycle. The liquidity for MAH
Sing Group has relatively been strong and stable among the others.
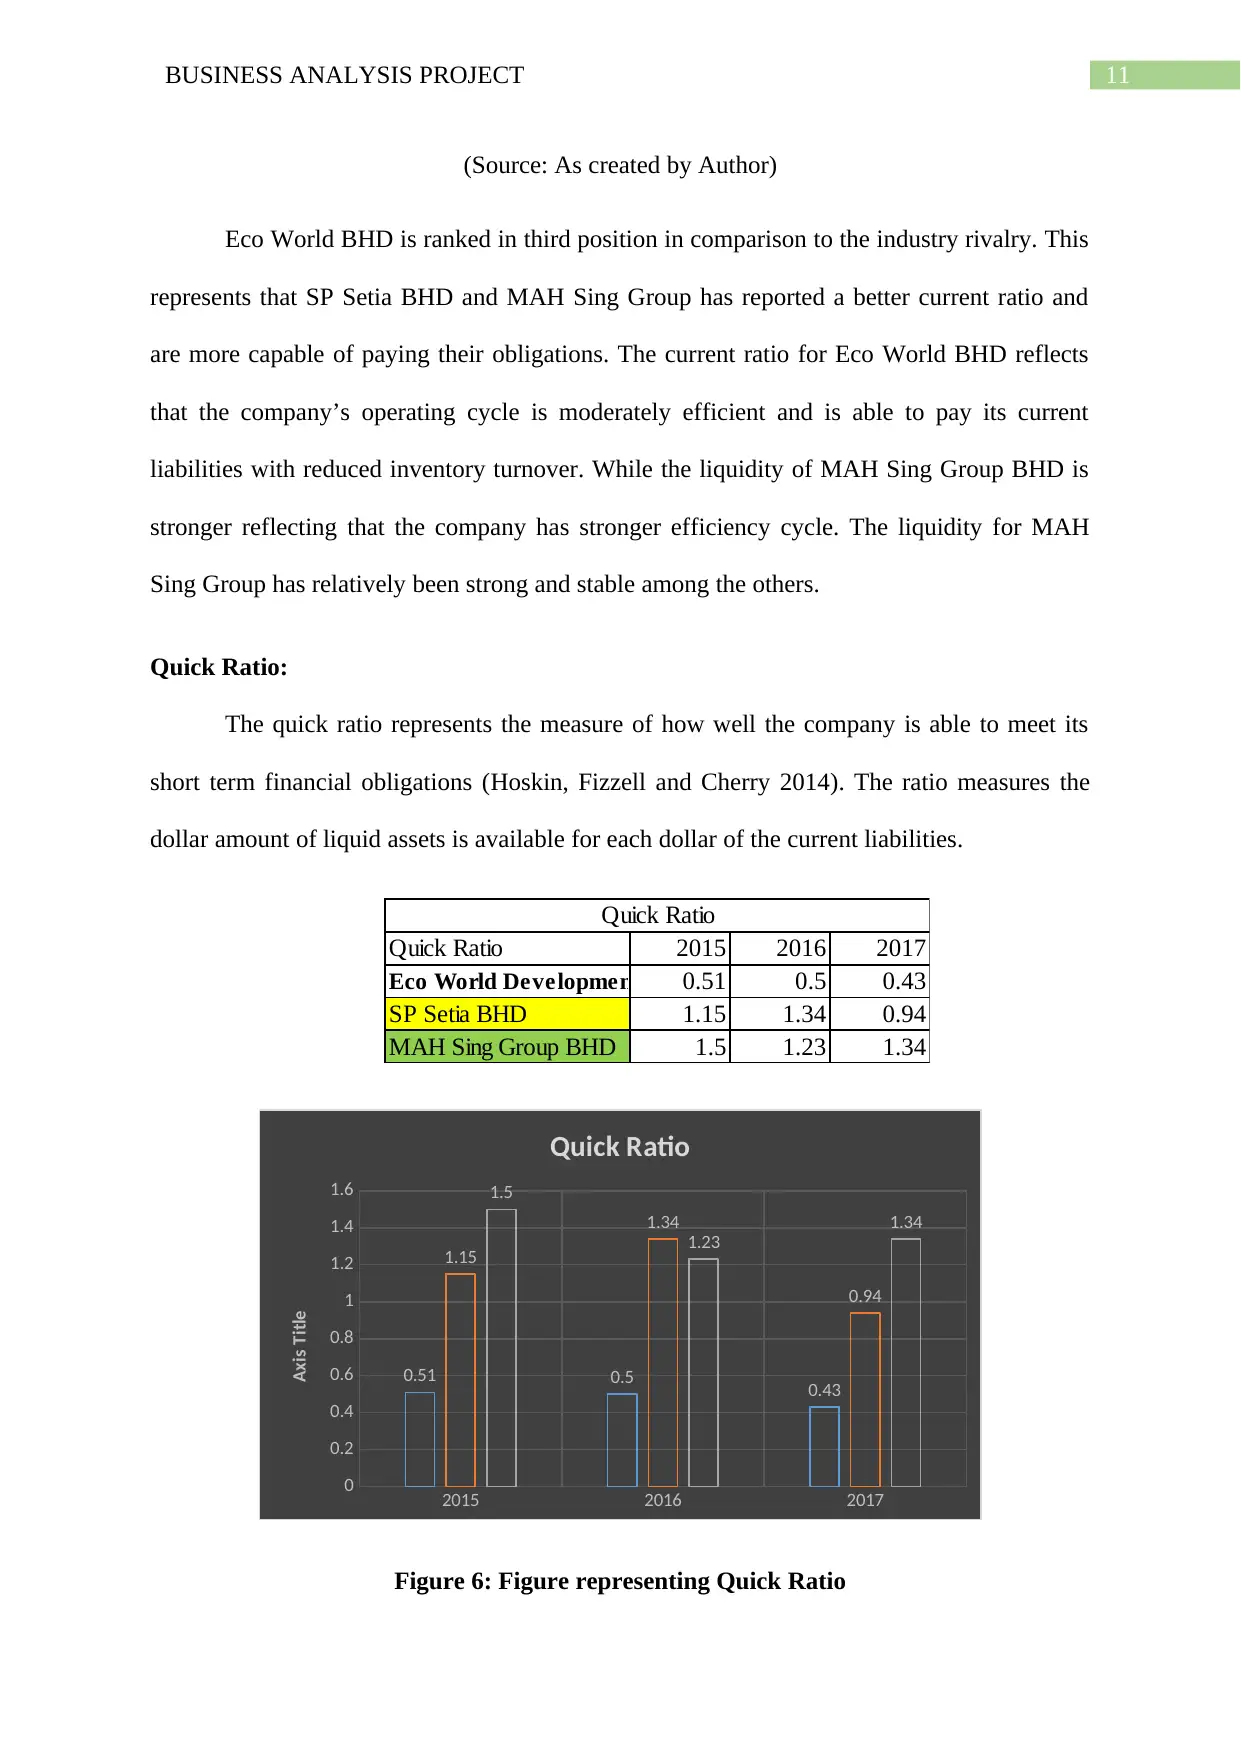
Quick Ratio:
The quick ratio represents the measure of how well the company is able to meet its
short term financial obligations (Hoskin, Fizzell and Cherry 2014). The ratio measures the
dollar amount of liquid assets is available for each dollar of the current liabilities.
Quick Ratio 2015 2016 2017
Eco World Development BHD0.51 0.5 0.43
SP Setia BHD 1.15 1.34 0.94
MAH Sing Group BHD 1.5 1.23 1.34
Quick Ratio
2015 2016 2017
0
0.2
0.4
0.6
0.8
1
1.2
1.4
1.6
0.51 0.5 0.43
1.15
1.34
0.94
1.5
1.23
1.34
Quick Ratio
Axis Title
Figure 6: Figure representing Quick Ratio
(Source: As created by Author)
Eco World BHD is ranked in third position in comparison to the industry rivalry. This
represents that SP Setia BHD and MAH Sing Group has reported a better current ratio and
are more capable of paying their obligations. The current ratio for Eco World BHD reflects
that the company’s operating cycle is moderately efficient and is able to pay its current
liabilities with reduced inventory turnover. While the liquidity of MAH Sing Group BHD is
stronger reflecting that the company has stronger efficiency cycle. The liquidity for MAH
Sing Group has relatively been strong and stable among the others.
Quick Ratio:
The quick ratio represents the measure of how well the company is able to meet its
short term financial obligations (Hoskin, Fizzell and Cherry 2014). The ratio measures the
dollar amount of liquid assets is available for each dollar of the current liabilities.
Quick Ratio 2015 2016 2017
Eco World Development BHD0.51 0.5 0.43
SP Setia BHD 1.15 1.34 0.94
MAH Sing Group BHD 1.5 1.23 1.34
Quick Ratio
2015 2016 2017
0
0.2
0.4
0.6
0.8
1
1.2
1.4
1.6
0.51 0.5 0.43
1.15
1.34
0.94
1.5
1.23
1.34
Quick Ratio
Axis Title
Figure 6: Figure representing Quick Ratio
⊘ This is a preview!⊘
Do you want full access?
Subscribe today to unlock all pages.
Trusted by 1+ million students worldwide
1 out of 30
Related Documents


Your All-in-One AI-Powered Toolkit for Academic Success.
+13062052269
info@desklib.com
Available 24*7 on WhatsApp / Email
![[object Object]](/_next/static/media/star-bottom.7253800d.svg)
Unlock your academic potential
Copyright © 2020–2026 A2Z Services. All Rights Reserved. Developed and managed by ZUCOL.