Principles of Economics ECO100 - Assessment 3: Market Analysis Report

Verified

Added on  2022/10/19

|9
|1920
|293
Homework Assignment
AI Summary
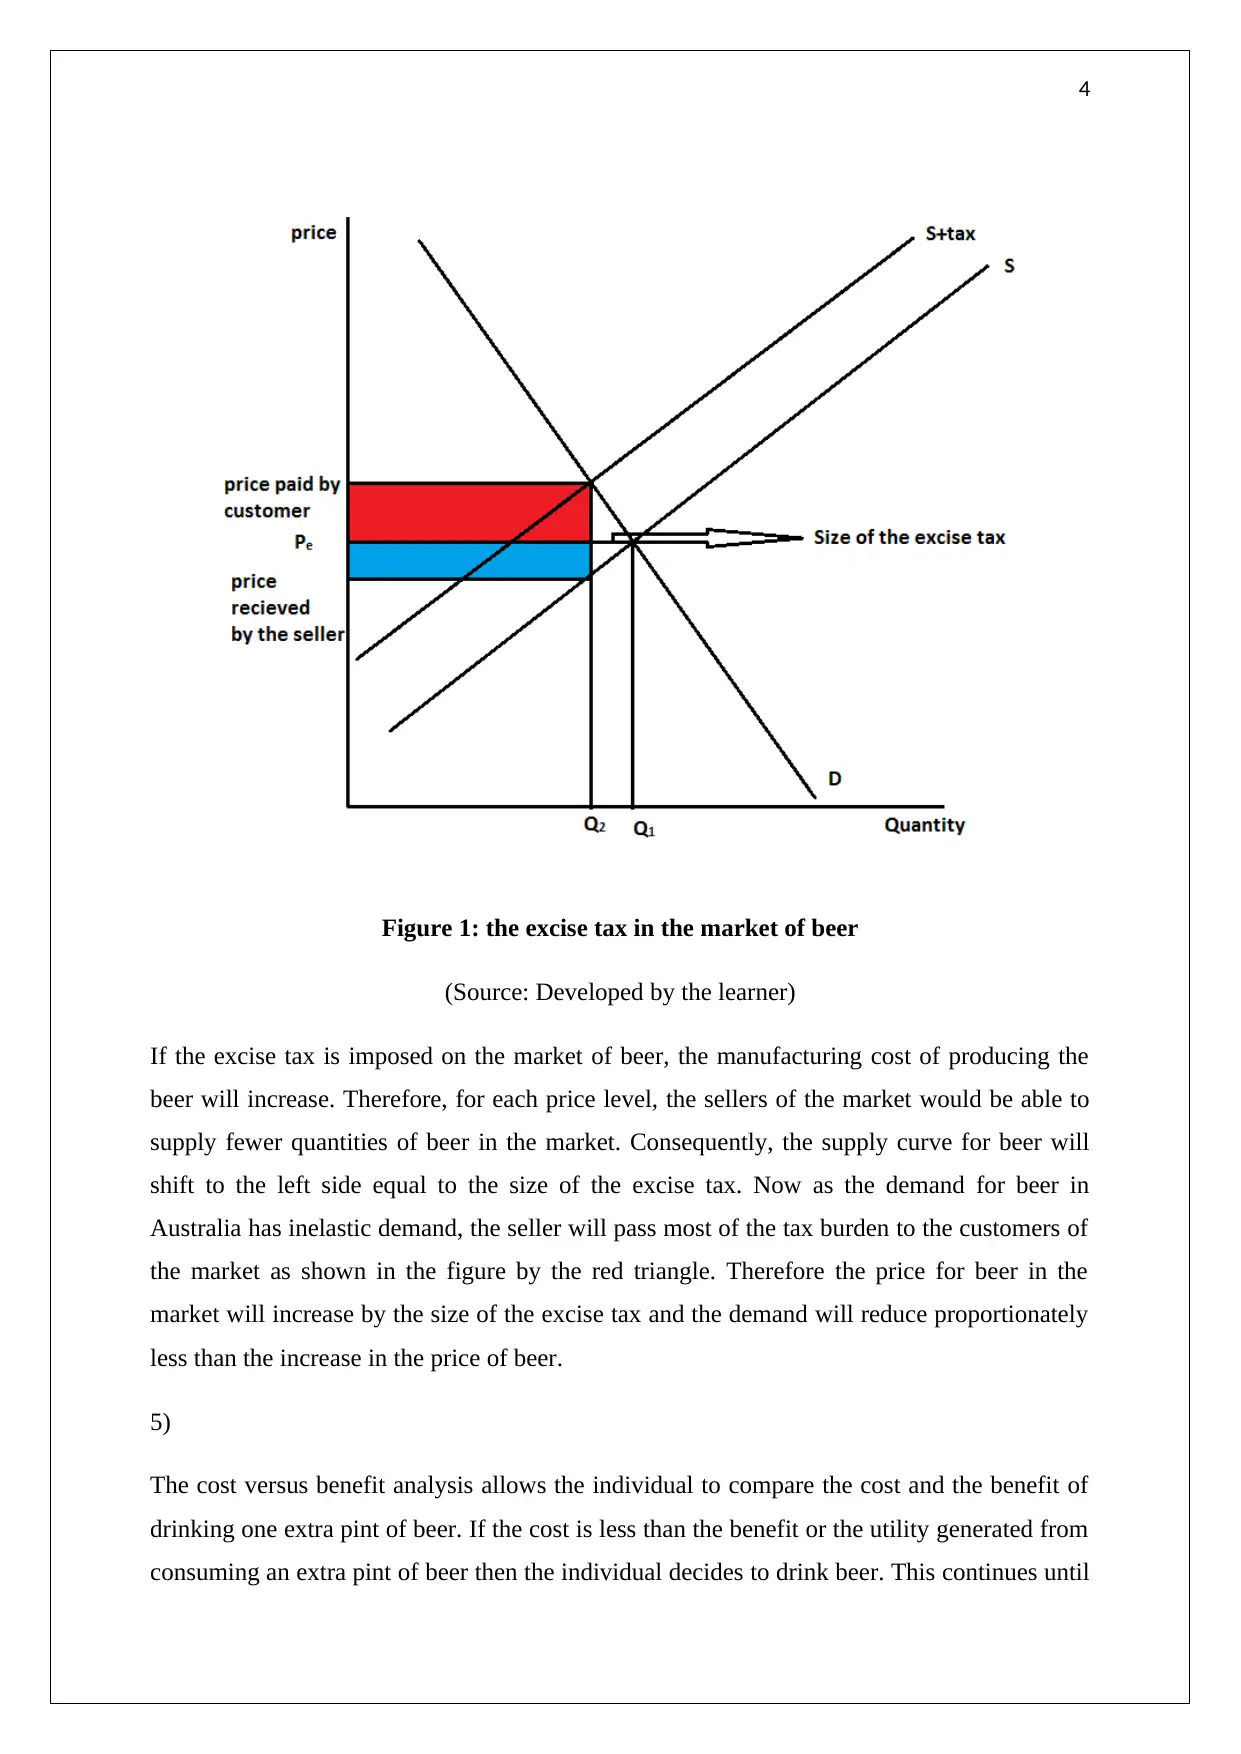
This assignment analyzes the Australian beer market, comparing its consumption rate to Indonesia's, and discussing factors influencing demand, such as price and consumer preferences. It examines the price elasticity of beer demand, illustrating the effects of excise tax through supply and demand curves. The assignment also explores government policies to reduce alcohol consumption, employing cost-benefit analysis. Furthermore, it delves into the labour market, defining real wages and their growth rate in Australia and the US, and analyzing the impact of minimum wage laws on employment and labour supply. The paper uses figures and references to support its analysis of key economic concepts.
Document Page
1
ASSESSMENT 3 MAJOR ASSIGNMENT
ECO100 PRINCIPLES OF ECONOMICS
tabler-icon-diamond-filled.svg

Paraphrase This Document

Need a fresh take? Get an instant paraphrase of this document with our AI Paraphraser
Document Page
2
Contents
The market for beer....................................................................................................................3
Labour market............................................................................................................................5
Reference....................................................................................................................................9
Document Page
3
Market for beer
1)
The beer consumption in Australia is 106 litres per capita as per the data of the year 2018.
This rate of consumption of beer is less than the rate of consumption of beer for Indonesia
which is 0.7 litres per capita. Per capita consumption of the beer is the suitable measure for
the beer consumption as the absolute consumption of beer for different countries are
different. Along with that, the population for the different country is also different. For
example, the population of Indonesia is 261,115,456 and the population of Australia is
25,505,300. Therefore the per capita consumption provides a population neutral consumption
of the beer in the two different countries.
2)
One of the common factors for the high consumption of beer in case of Australia is the cheap
price of that product. Freixas and Rochet (2018) stated that the price of a product is one of the
most important determinants of the demand. On the other hand, the price of beer in Indonesia
is way higher compared to that of Australia and hence the per capita consumption has a huge
gap. Another factor that explains the gap between the per capita consumption is the tastes and
preferences of the customers. While the lifestyles of Australian people over the years have
been suited for high beer consumption, it has been restricted by the religious values in case of
the people of Indonesia.
3)
The elasticity of beer demand in Australia is inelastic in nature. That means the percentage
change in the quantity demanded of beer corresponding to the change in the price is
proportionately more. Factors such as the income of the customers of the market, types of
products, availability of substitutes, level of price and number of users influence the elasticity
of demand for beer in Australia (Varian, 2016). The elasticity of demand for beer in Australia
is inelastic due to the fact that beer consumption is a part of the life and culture for the people
of Australia. In this, the number of users is very high and hence the elasticity of demand for
beer in this country is less than 1. Therefore, if the price for beer reduces by some percentage,
the demand increases less than the increasing percentage of the price.
4)
Document Page
4
Figure 1: the excise tax in the market of beer
(Source: Developed by the learner)
If the excise tax is imposed on the market of beer, the manufacturing cost of producing the
beer will increase. Therefore, for each price level, the sellers of the market would be able to
supply fewer quantities of beer in the market. Consequently, the supply curve for beer will
shift to the left side equal to the size of the excise tax. Now as the demand for beer in
Australia has inelastic demand, the seller will pass most of the tax burden to the customers of
the market as shown in the figure by the red triangle. Therefore the price for beer in the
market will increase by the size of the excise tax and the demand will reduce proportionately
less than the increase in the price of beer.
5)
The cost versus benefit analysis allows the individual to compare the cost and the benefit of
drinking one extra pint of beer. If the cost is less than the benefit or the utility generated from
consuming an extra pint of beer then the individual decides to drink beer. This continues until
tabler-icon-diamond-filled.svg

Paraphrase This Document

Need a fresh take? Get an instant paraphrase of this document with our AI Paraphraser
Document Page
5
the cost of an extra pint of beer is equal to utility generated from it. At this point, the
individual undertakes the decision the quantity for drinking beer.
The society is the collection of the individuals who are using the cost and benefits concept to
determine the quantity of beer. Therefore, the society also increases the consumption of the
beer until the cost of beer equals to the utility generated from an extra pint of beer. The
government wishes to reduce the consumption of beer in Australia as the production cost of
beer is low and hence the price is low (Frank and Cartwright, 2016). Therefore the consumers
of the market end up consuming a huge amount of beer which also impacts the productivity
of the economy. This deteriorated productivity again affects the economic growth and the
development of the economy as well. Therefore, for the sustainable growth of the economy,
the government uses the cost and benefit analysis to reduce consumption of beer in Australia.
6)
Other than the tax, the government of Australia has taken various policies to reduce alcohol
consumption in Australia. First and the foremost policy that has been used by the Australian
government is initiative to aware people regarding the positive choices. These awareness
programmes from the side of the government aim to increase the knowledge of the customers
regarding the ill effects of alcohol consumption. The government also have enacted the
initiative of ASSIST policy under which the government provides support to the victims of
alcohol addicts so that they can reduce the consumption in a very short time (Bowles, 2019).
The FASD hub initiative taken by the government increases the knowledge of the customers
regarding fetal alcohol spectrum disorders (FASD). Lastly, the government has also provided
24*7 hotline number to assist the alcohol addicts in real-time. This policy aims to talk to the
consumers of the Australian market that wants to reduce the consumption of alcohol but
cannot deal with the desires. The government approve therapists are everywhere for the help
of the consumers so that reduced consumption of beer can be used for the betterment of the
economy of Australia.
Labour market
1)
Real wages are referred to as the number of goods and services that can be bought from the
wage of and individual (Elmeskov et al. 2016). The real wage measure subtracts the level of
inflation from the nominal wages so that the real capacity of the individual in the markets of
Document Page
6
goods and service can be measured. The real wage growth rate is the increase in the value of
goods and services that can be bought with a specific wage of an individual. When the real
wage rate of an individual increase, it can buy more of goods and the services from the
market irrespective of the price of the goods.
2)
The real wage growth rate is an important requirement for the wage-led the growth of
economies. The figure below shows the real wage growth rate in Australia that is increasing
over the years (Buraimo et al. 2015). It can also be noted from the figure below that, there
has been the influencing of the business cycle in the real wage growth rate as well. In the last
10 years, the real wage growth has accelerated in the case of Australia, however, it needs to
be noted that the corresponding increases in productivity have not been as impressive.
Figure 2: The real wage growth rate of Australia
(Source: Bloomberg.com)
The real wage growth rate of the US, on the other hand, is different in terms of its
contribution to the national GDP in the last 10 years. The graph below shows that in the last
10 years, productivity has increased more than the growth in the real wage growth rate. The
gap between the productivity and the wage is widening and is expected to widen until the
wage growth hits a specific level.
Document Page
7
Figure 3: The real wage growth rate of the USA
(Source: Bloomberg.com)
3)
The government of Australia has enacted a minimum wage law in the country to ensure that
unskilled labours also can afford a good lifestyle in the country (Harrison, 2017). The fair
work commission that governs the interests of the labour has set the minimum wage at $21
per hour. The data of national wage rates shows that the minimum wage rate has been
increasing in the economy corresponding to the expansion and the growth of the economy.
Figure 4: the minimum wage in Australia
(Source: Eichhorst and Marx, 2015)
tabler-icon-diamond-filled.svg

Paraphrase This Document

Need a fresh take? Get an instant paraphrase of this document with our AI Paraphraser
Document Page
8
The minimum wage is set above the equilibrium wage rate shown by the market just like a
bind price floor. In this case, as the minimum wage is above the equilibrium wage rate, the
labour supply is more than the labour demand at this wage. Therefore, the minimum wage
rate creates an excess supply of labour in the market.
4)
The minimum wage rate above the equilibrium wage rate reduces the demand for labour in
the market. Therefore as an international student in Australia, the job availability reduces that
can impact the probability of getting hired in any of Australian companies (Eichhorst and
Marx, 2015). Apart from that, the minimum wage rate imposition also results in a high
unemployment rate in the economy which also can increase the competition after the
completion of the course. Thus, while minimum wage rate is beneficial for the low skilled
workers of the labour force, it creates a pressure on the other labours of the market as; it
reduces the opportunity to work for the new entrants in the labour force.
Document Page
9
Reference
"Bloomberg ", Bloomberg.Com (Webpage, 2019) <https://www.bloomberg.com/asia>
Bowles, S., 2019. Microeconomics: behavior, institutions, and evolution. Princeton
University Press, pp.45-190.
Buraimo, B., Frick, B., Hickfang, M. and Simmons, R., 2015. The economics of longterm
contracts in the footballers' labour market. Scottish Journal of Political Economy, 62(1),
pp.8-24.
Eichhorst, W. and Marx, P. eds., 2015. Non-standard employment in post-industrial labour
markets: An occupational perspective. Edward Elgar Publishing, pp. 1145-1254.
Elmeskov, J., Martin, J.P. and Scarpetta, S., 2016. Key lessons for labour market reforms:
Evidence from OECD countries' experience. Swedish economic policy review, 5(2), pp. 12-
48.
Frank, R.H. and Cartwright, E., 2016. Microeconomics and behavior. New York: McGraw-
Hill, pp.1245-1355.
Freixas, X. and Rochet, J.C., 2018. Microeconomics of banking. MIT press, pp. 145-174.
Harrison, A.J., 2017. Economics and land use planning. Routledge, pp. 120-126.
Varian, H.R., 2016. Intermediate microeconomics with calculus: a modern approach. WW
Norton & Company, pp.56-98.
chevron_up_icon
1 out of 9
circle_padding
hide_on_mobile
zoom_out_icon
[object Object]