Term 3 2020 ECO100 Assignment: Economic Problem Analysis and Solutions
VerifiedAdded on 2022/12/29
|9
|908
|76
Homework Assignment
AI Summary
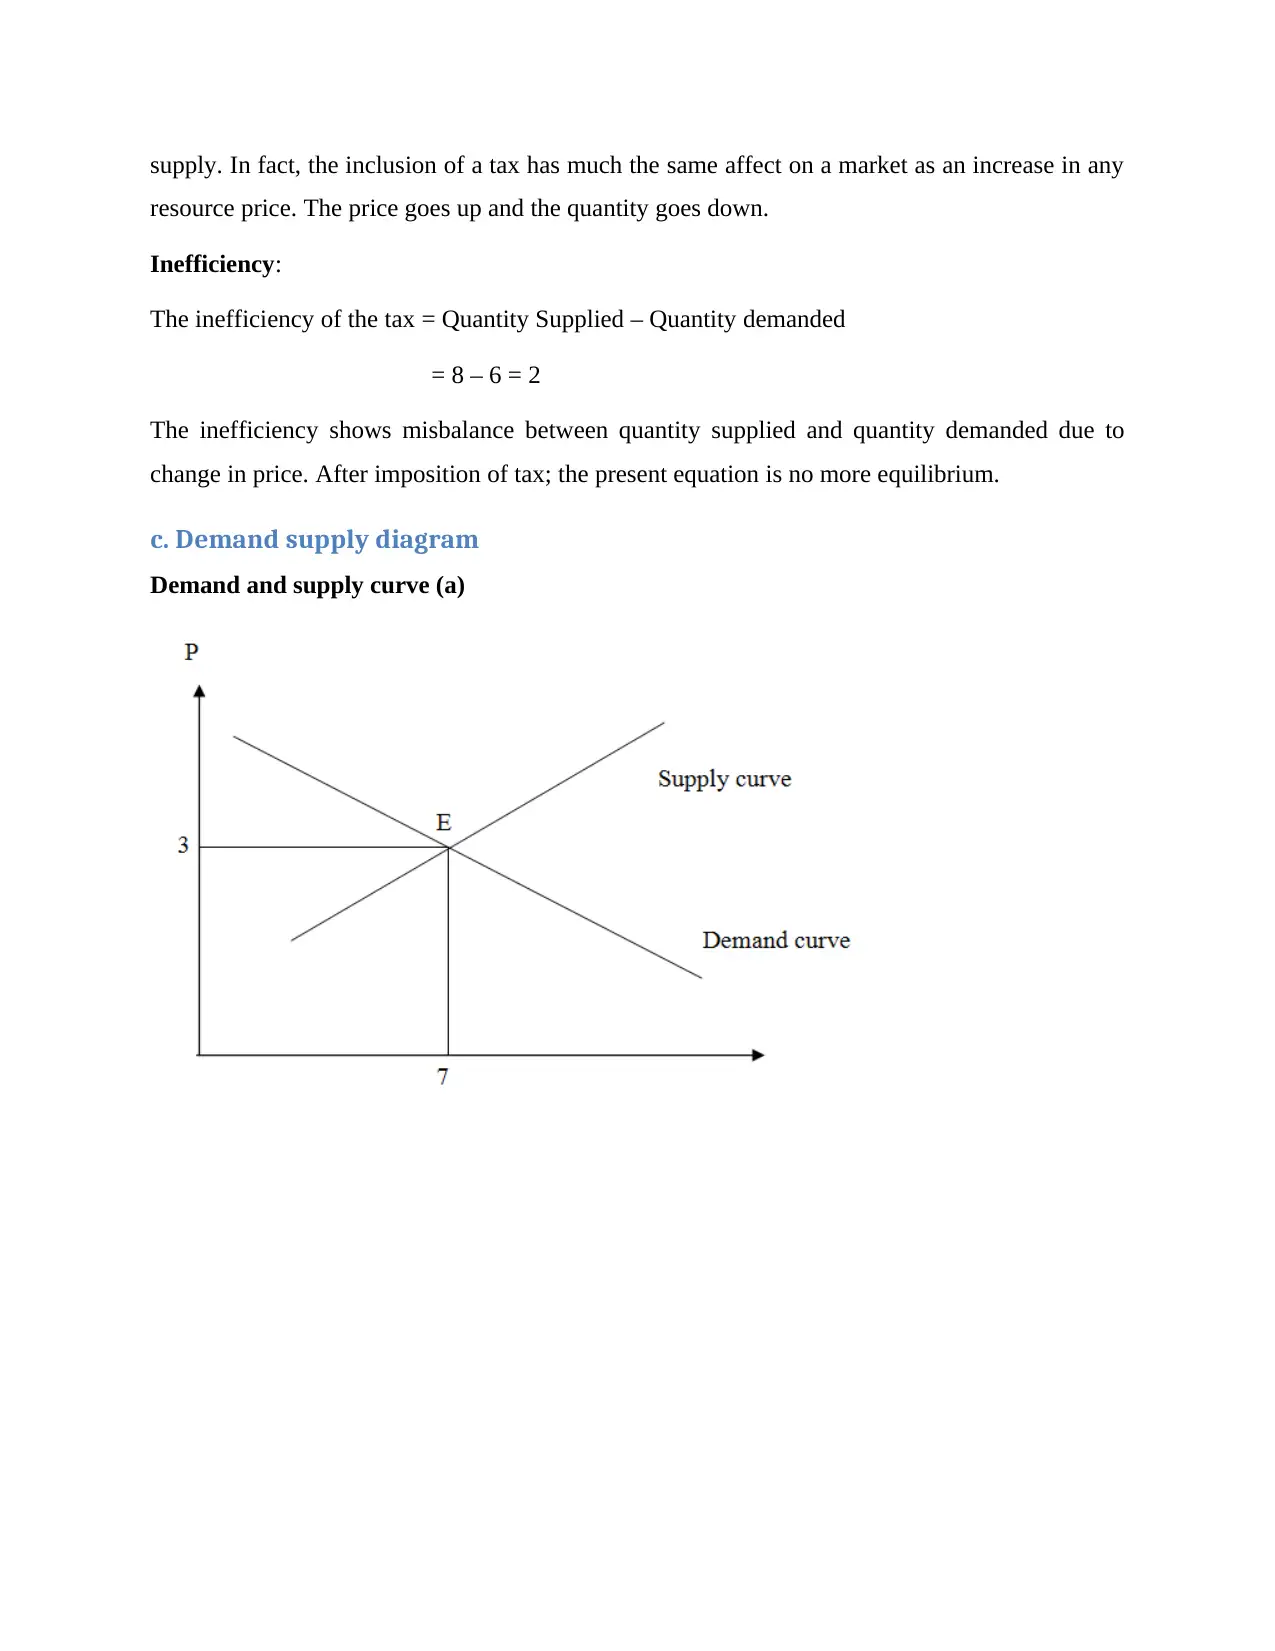
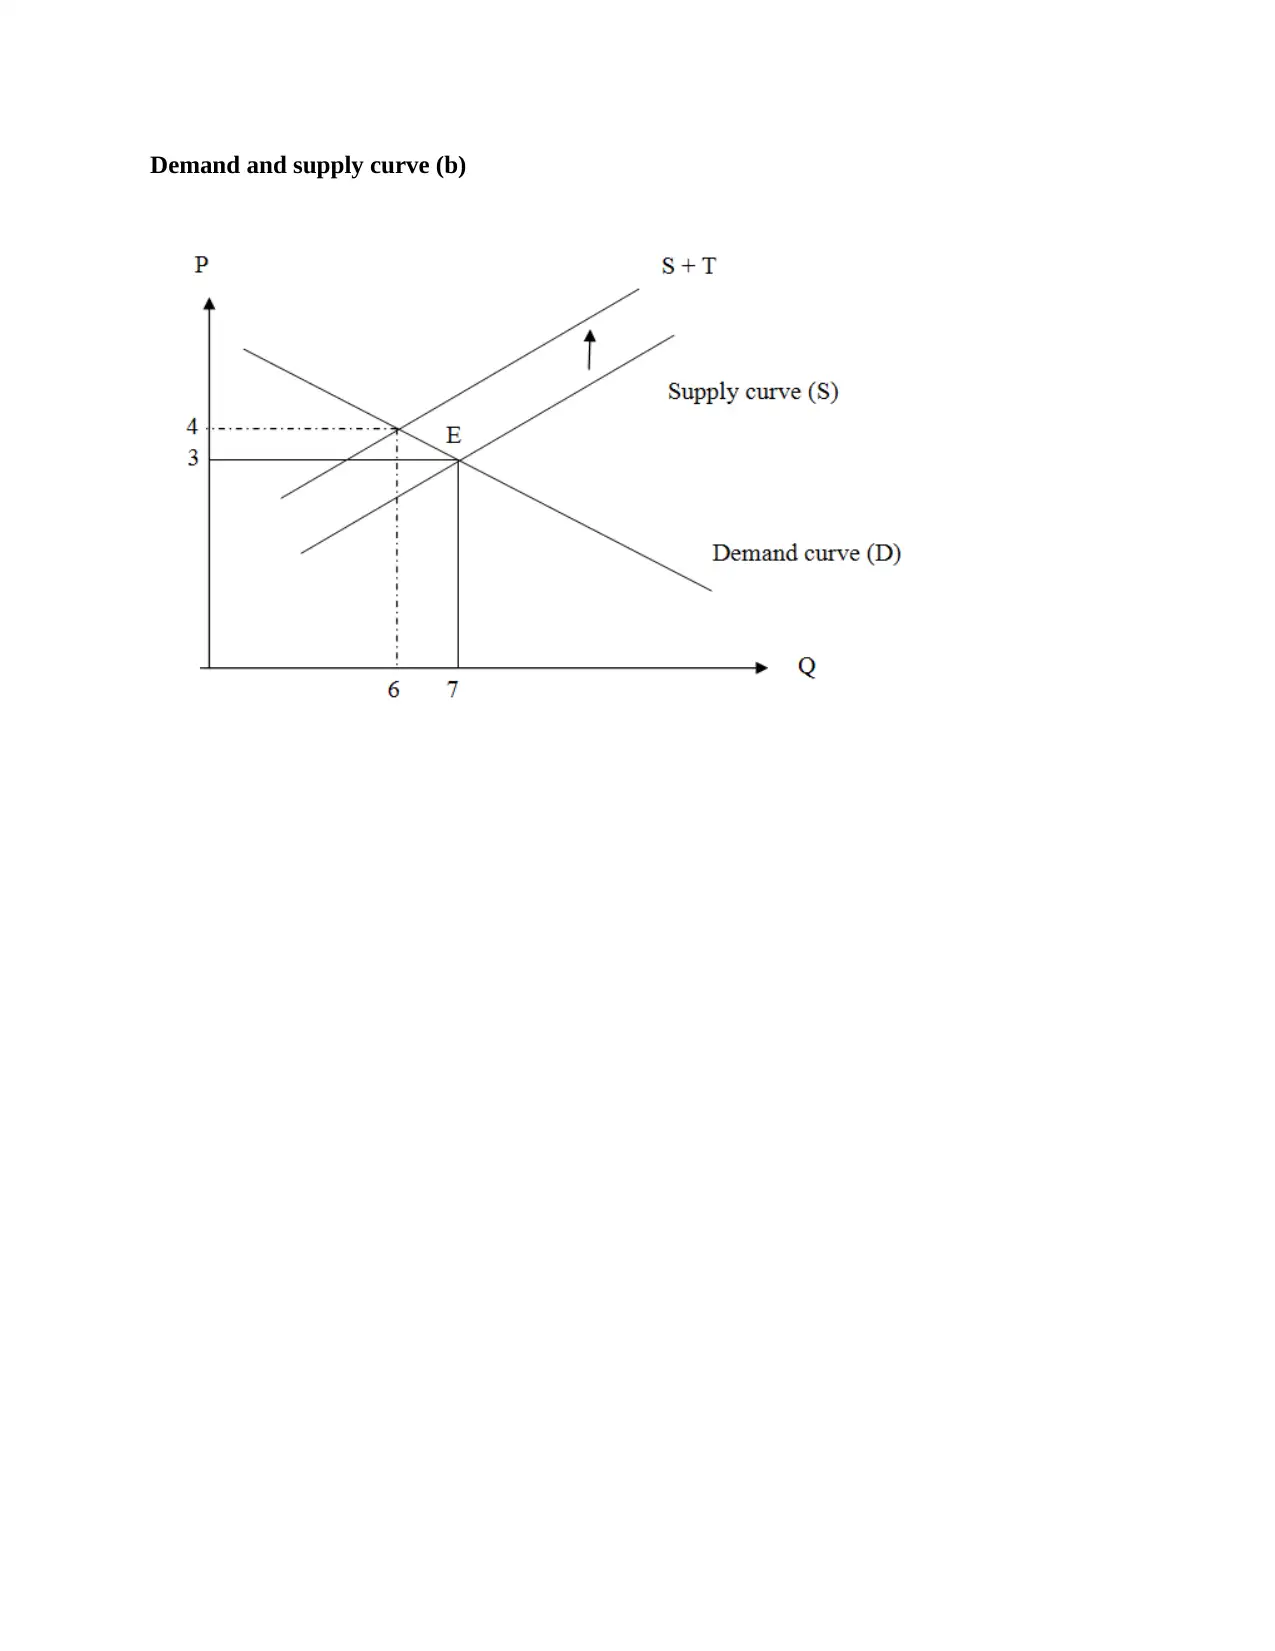
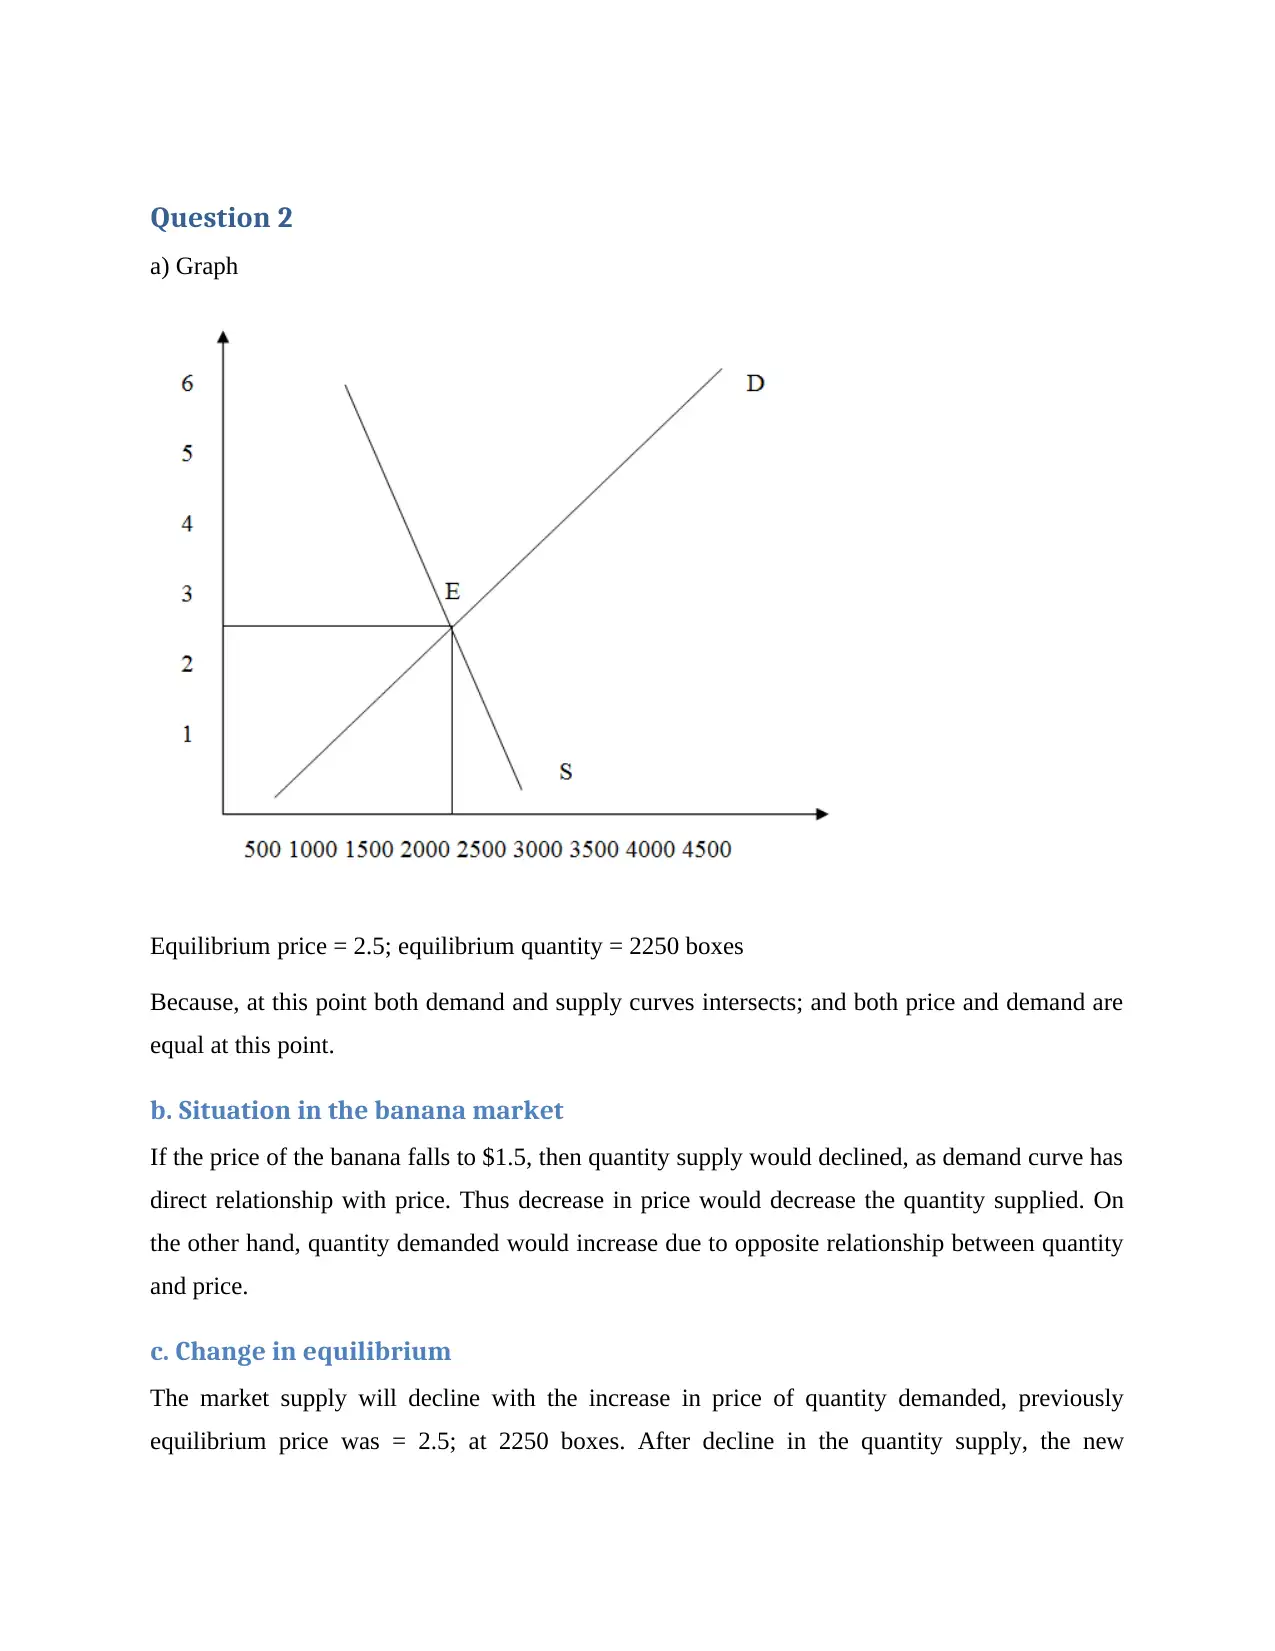
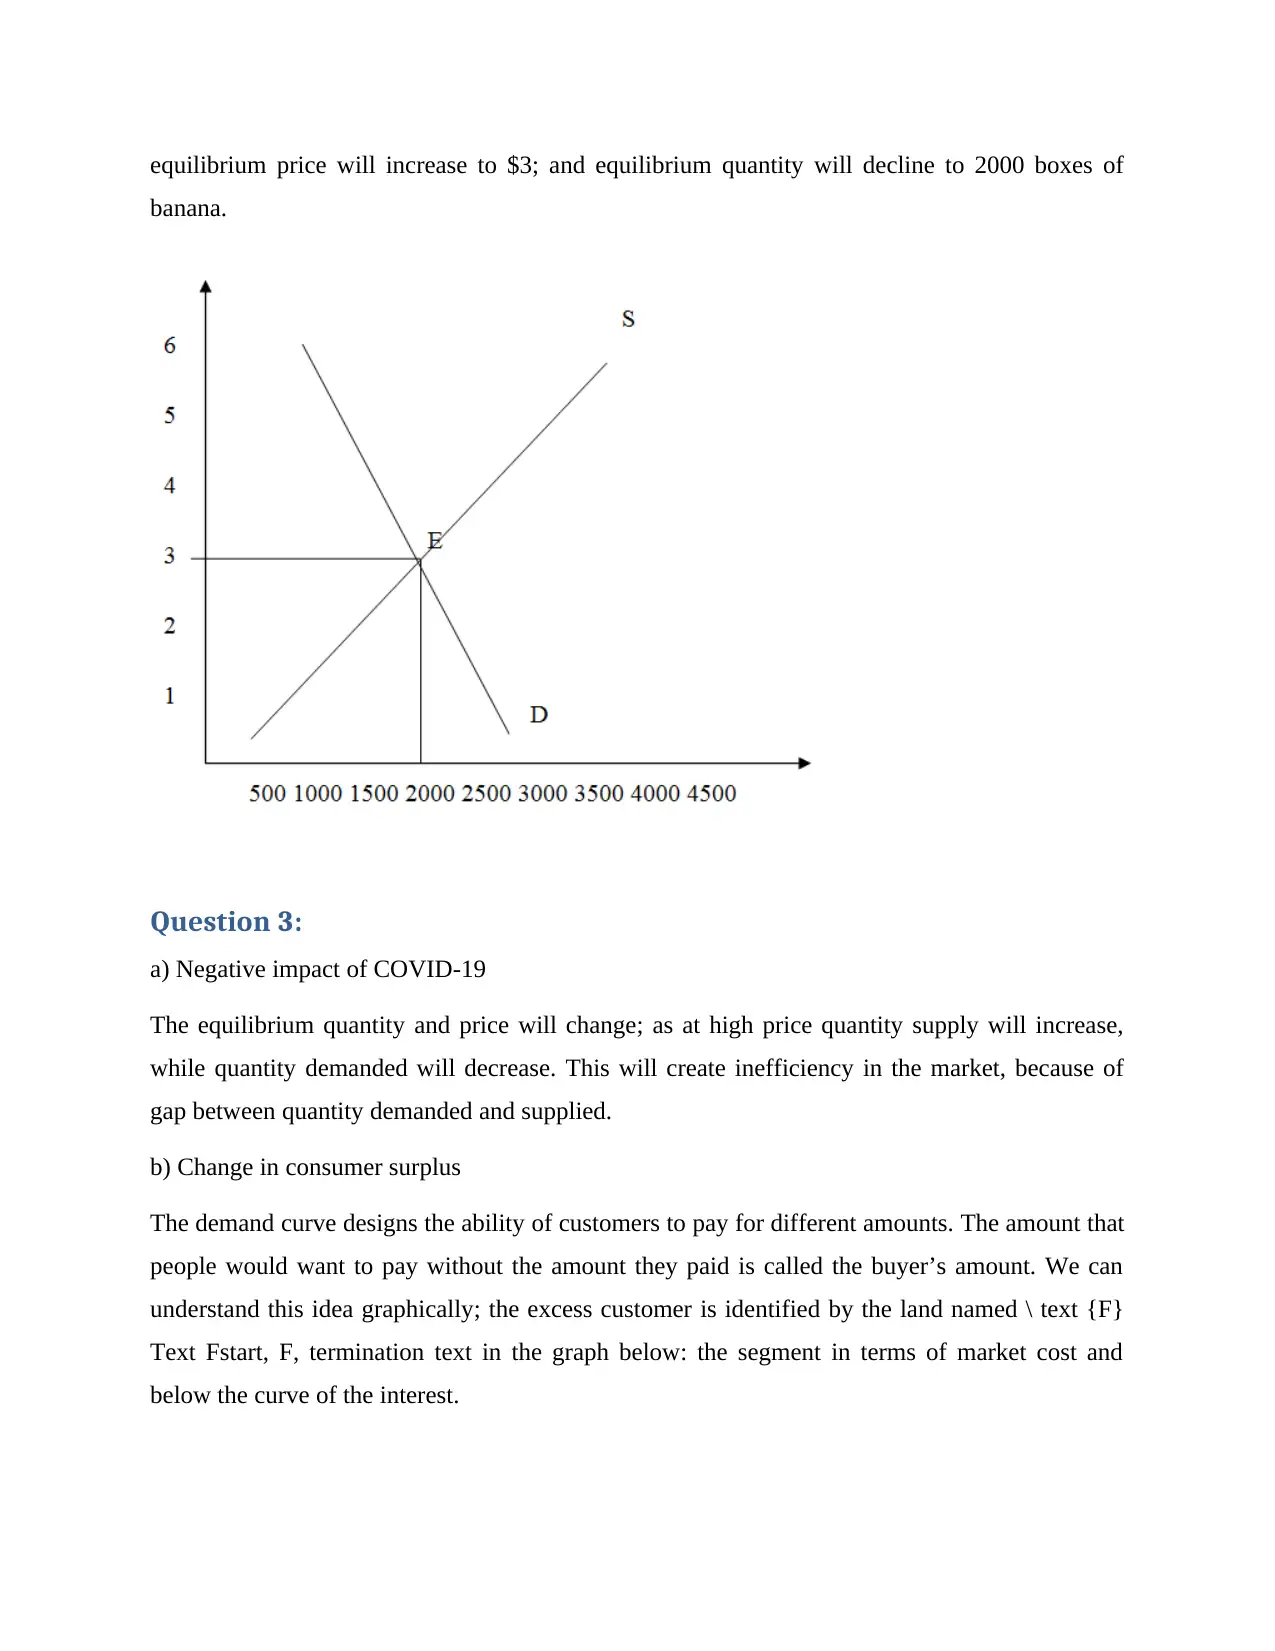
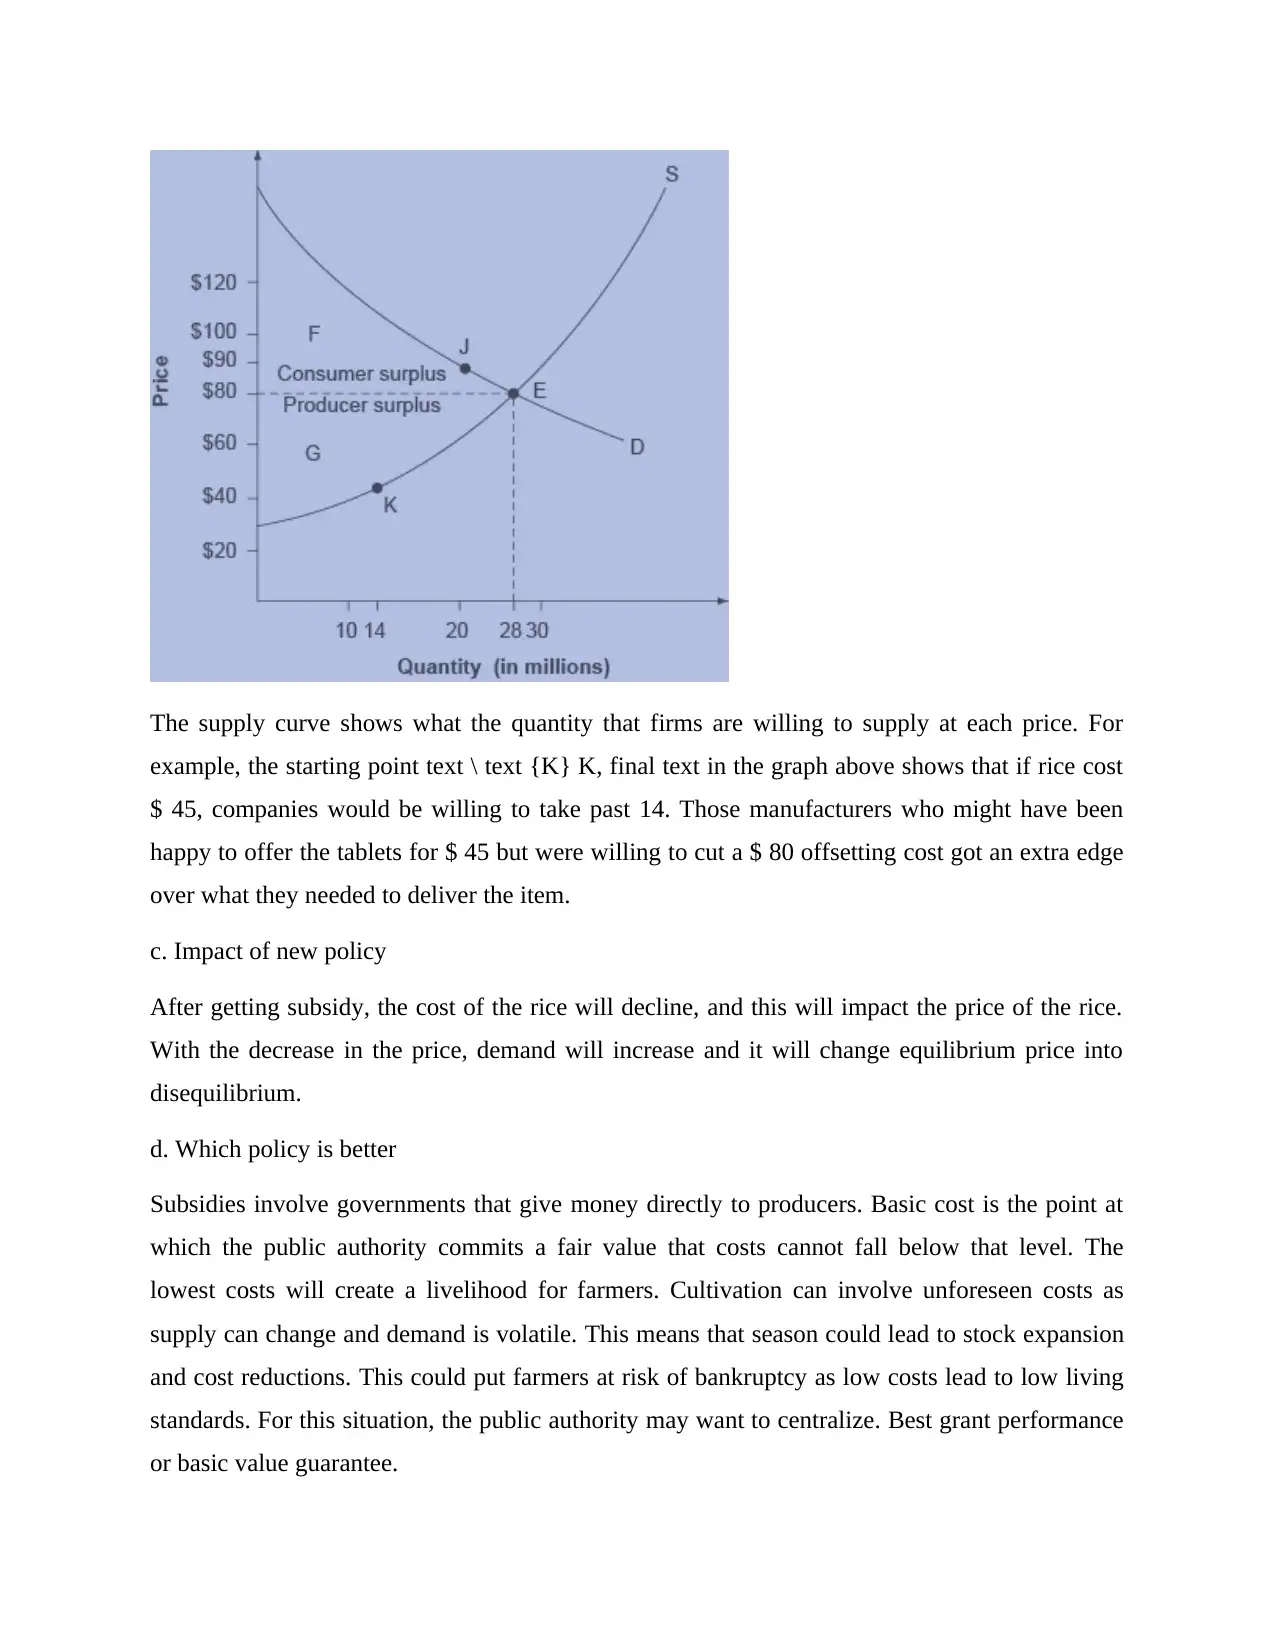
This document presents a comprehensive solution to an ECO100 Introduction to Economics assignment. The assignment addresses several key economic concepts, including the determination of equilibrium price and quantity in the tea market using demand and supply equations. It analyzes the impact of a government-imposed tax on equilibrium, determining tax incidence and the resulting inefficiency. The solution includes demand and supply diagrams. The assignment also examines the banana market, analyzing changes in equilibrium due to price fluctuations. Further, the assignment explores the negative impacts of COVID-19 on the market, changes in consumer surplus, and the effects of new economic policies, such as subsidies and price floors, comparing their effectiveness. The solutions provide detailed explanations, calculations, and graphical representations to illustrate the economic principles discussed.

1 out of 9
Related Documents


Your All-in-One AI-Powered Toolkit for Academic Success.
+13062052269
info@desklib.com
Available 24*7 on WhatsApp / Email
![[object Object]](/_next/static/media/star-bottom.7253800d.svg)
Copyright © 2020–2026 A2Z Services. All Rights Reserved. Developed and managed by ZUCOL.