Economic Principles Assignment: ECO10004 Task 2-5 Analysis
VerifiedAdded on 2022/12/22
|8
|1617
|1
Homework Assignment
AI Summary
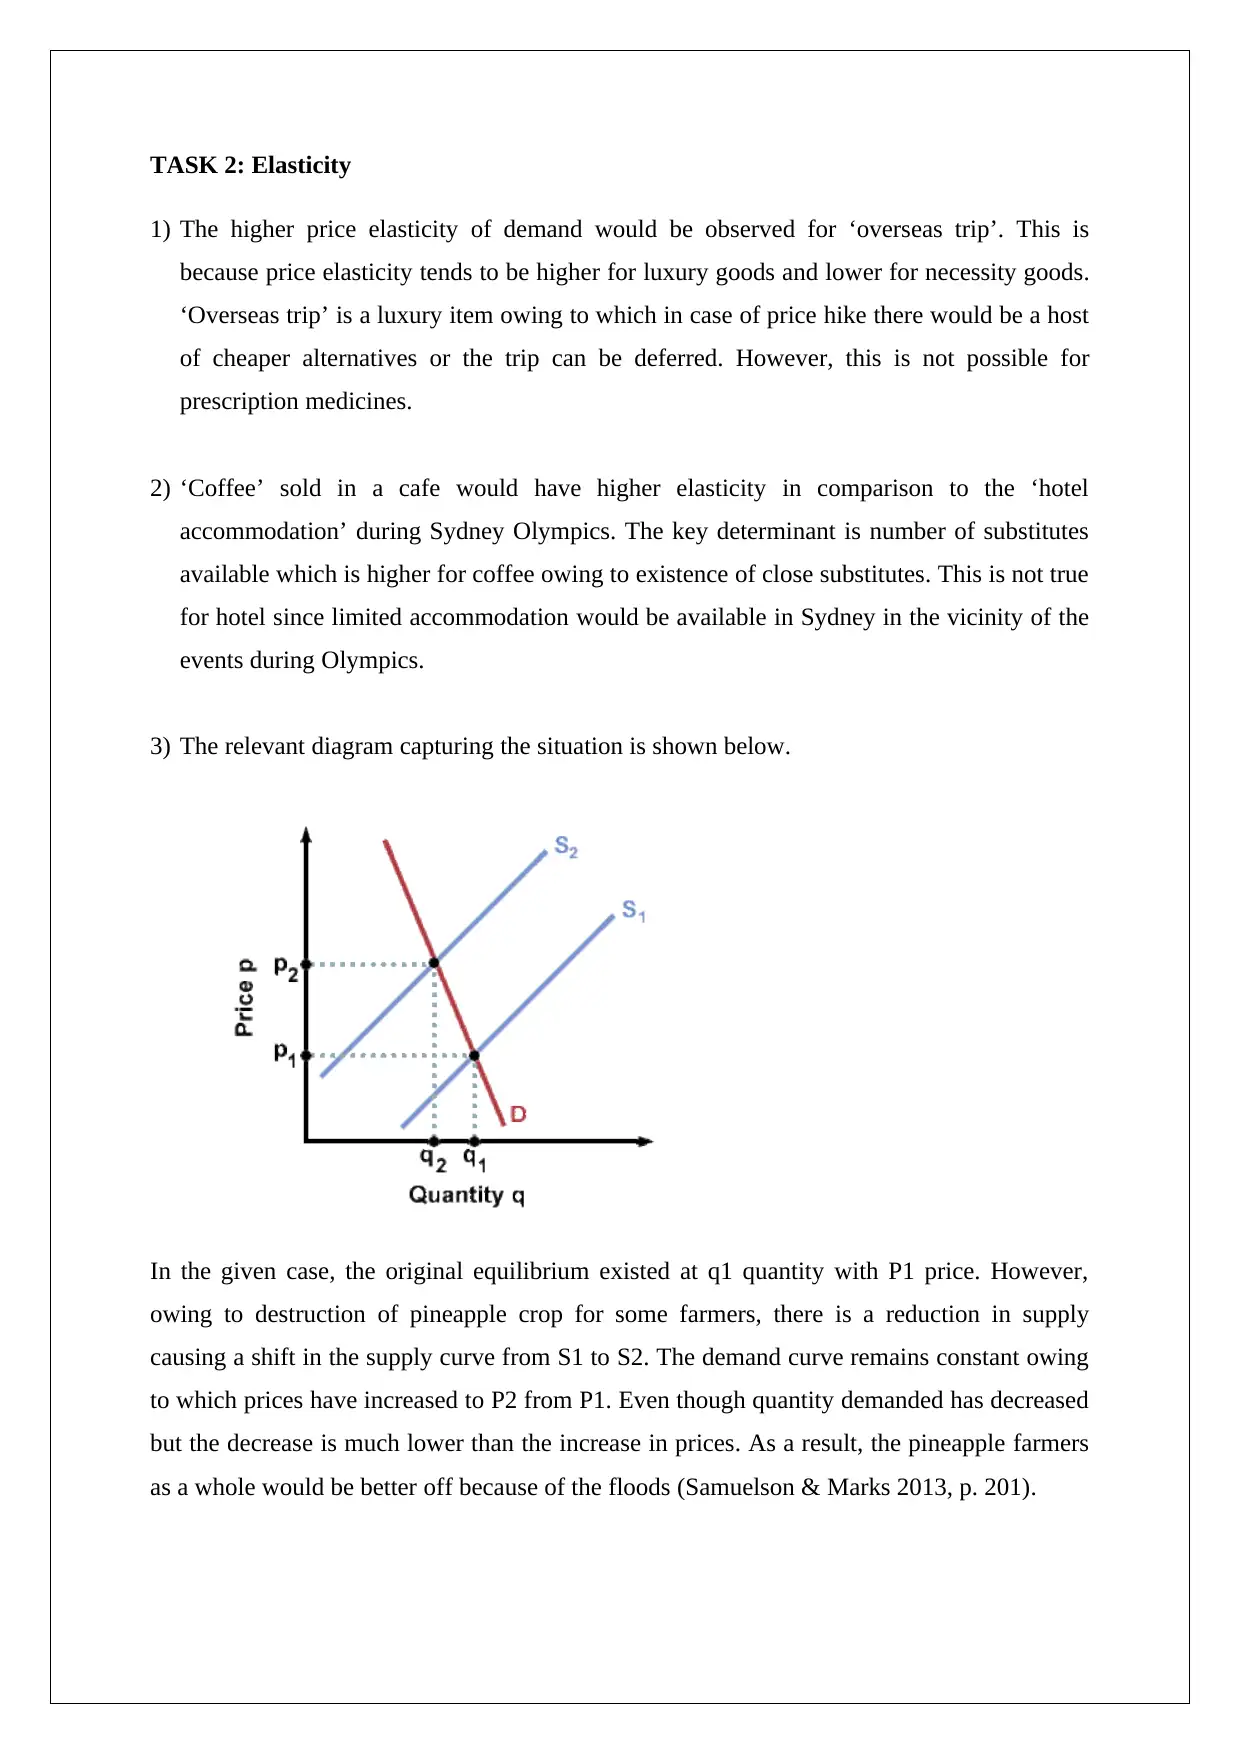
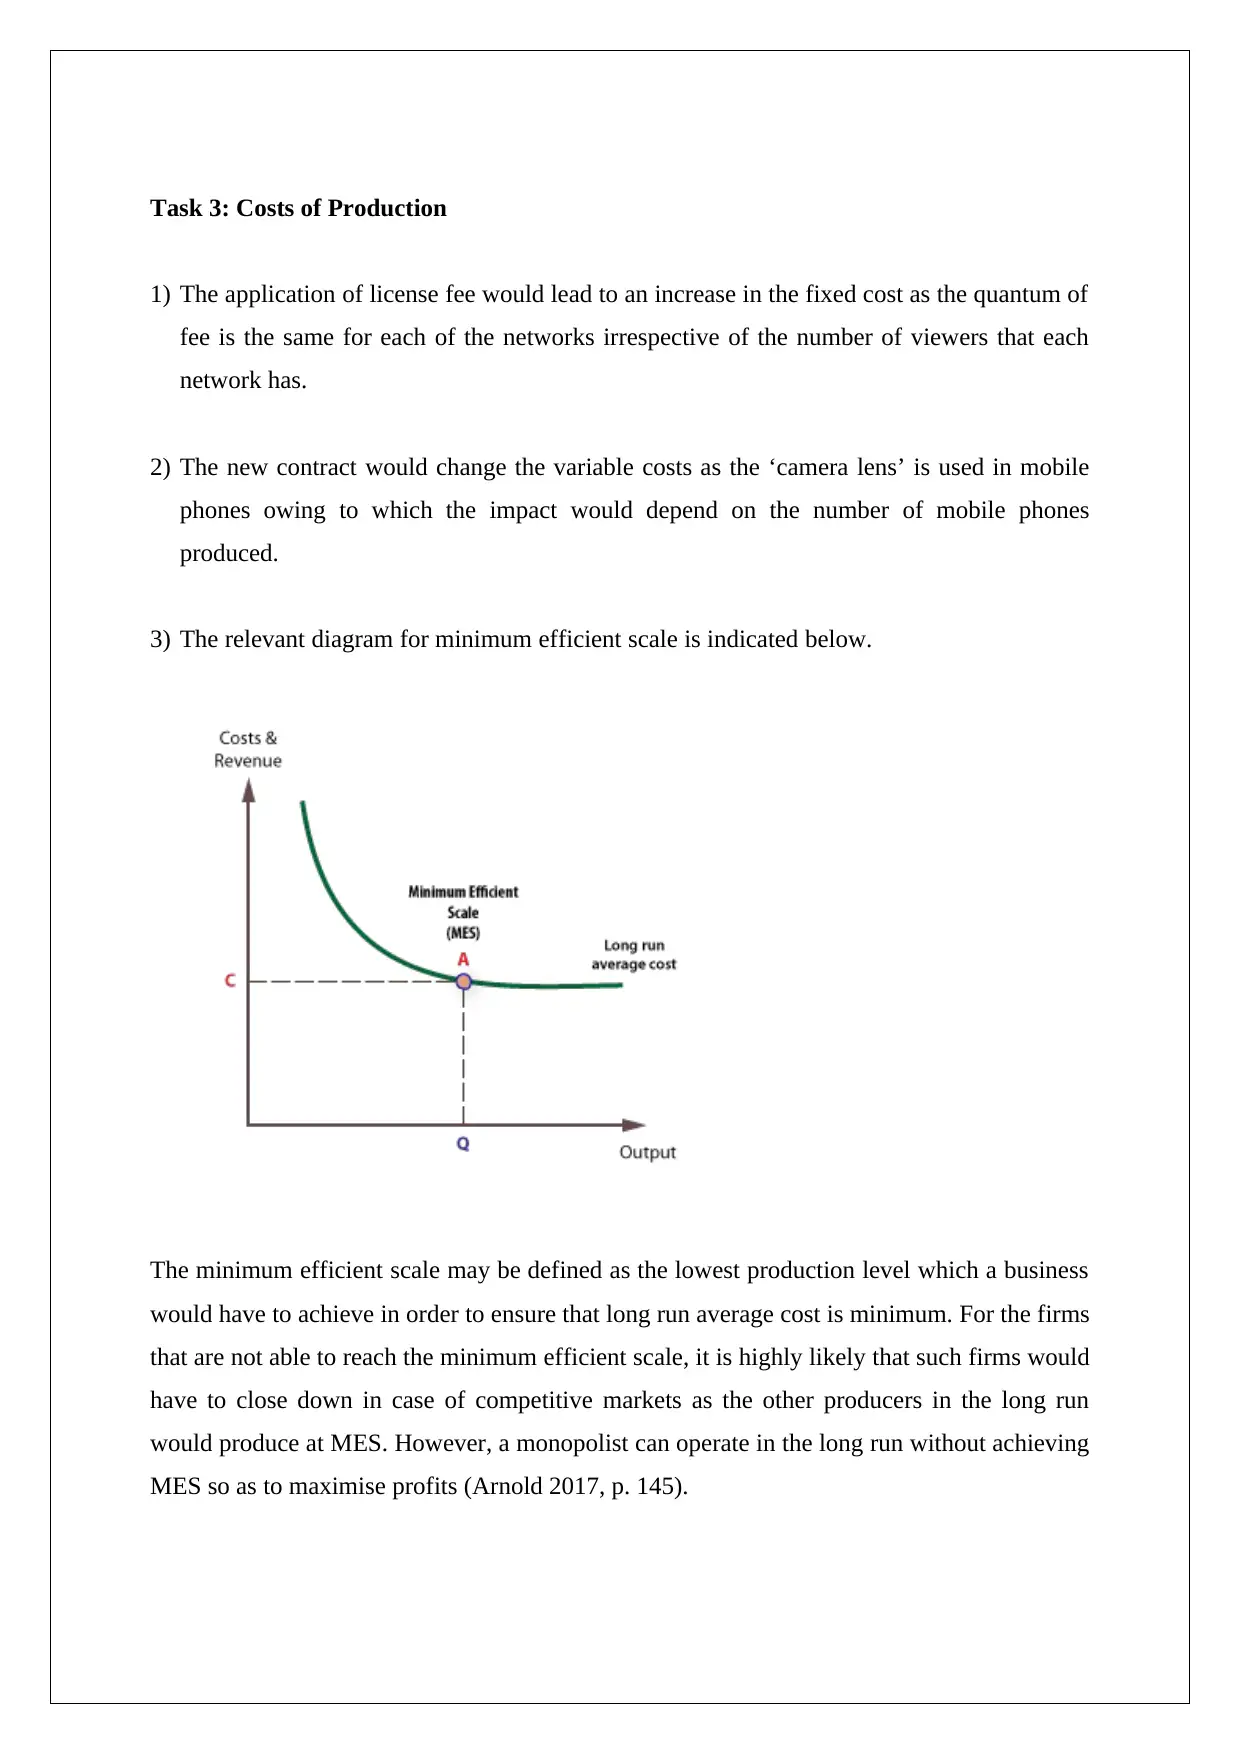
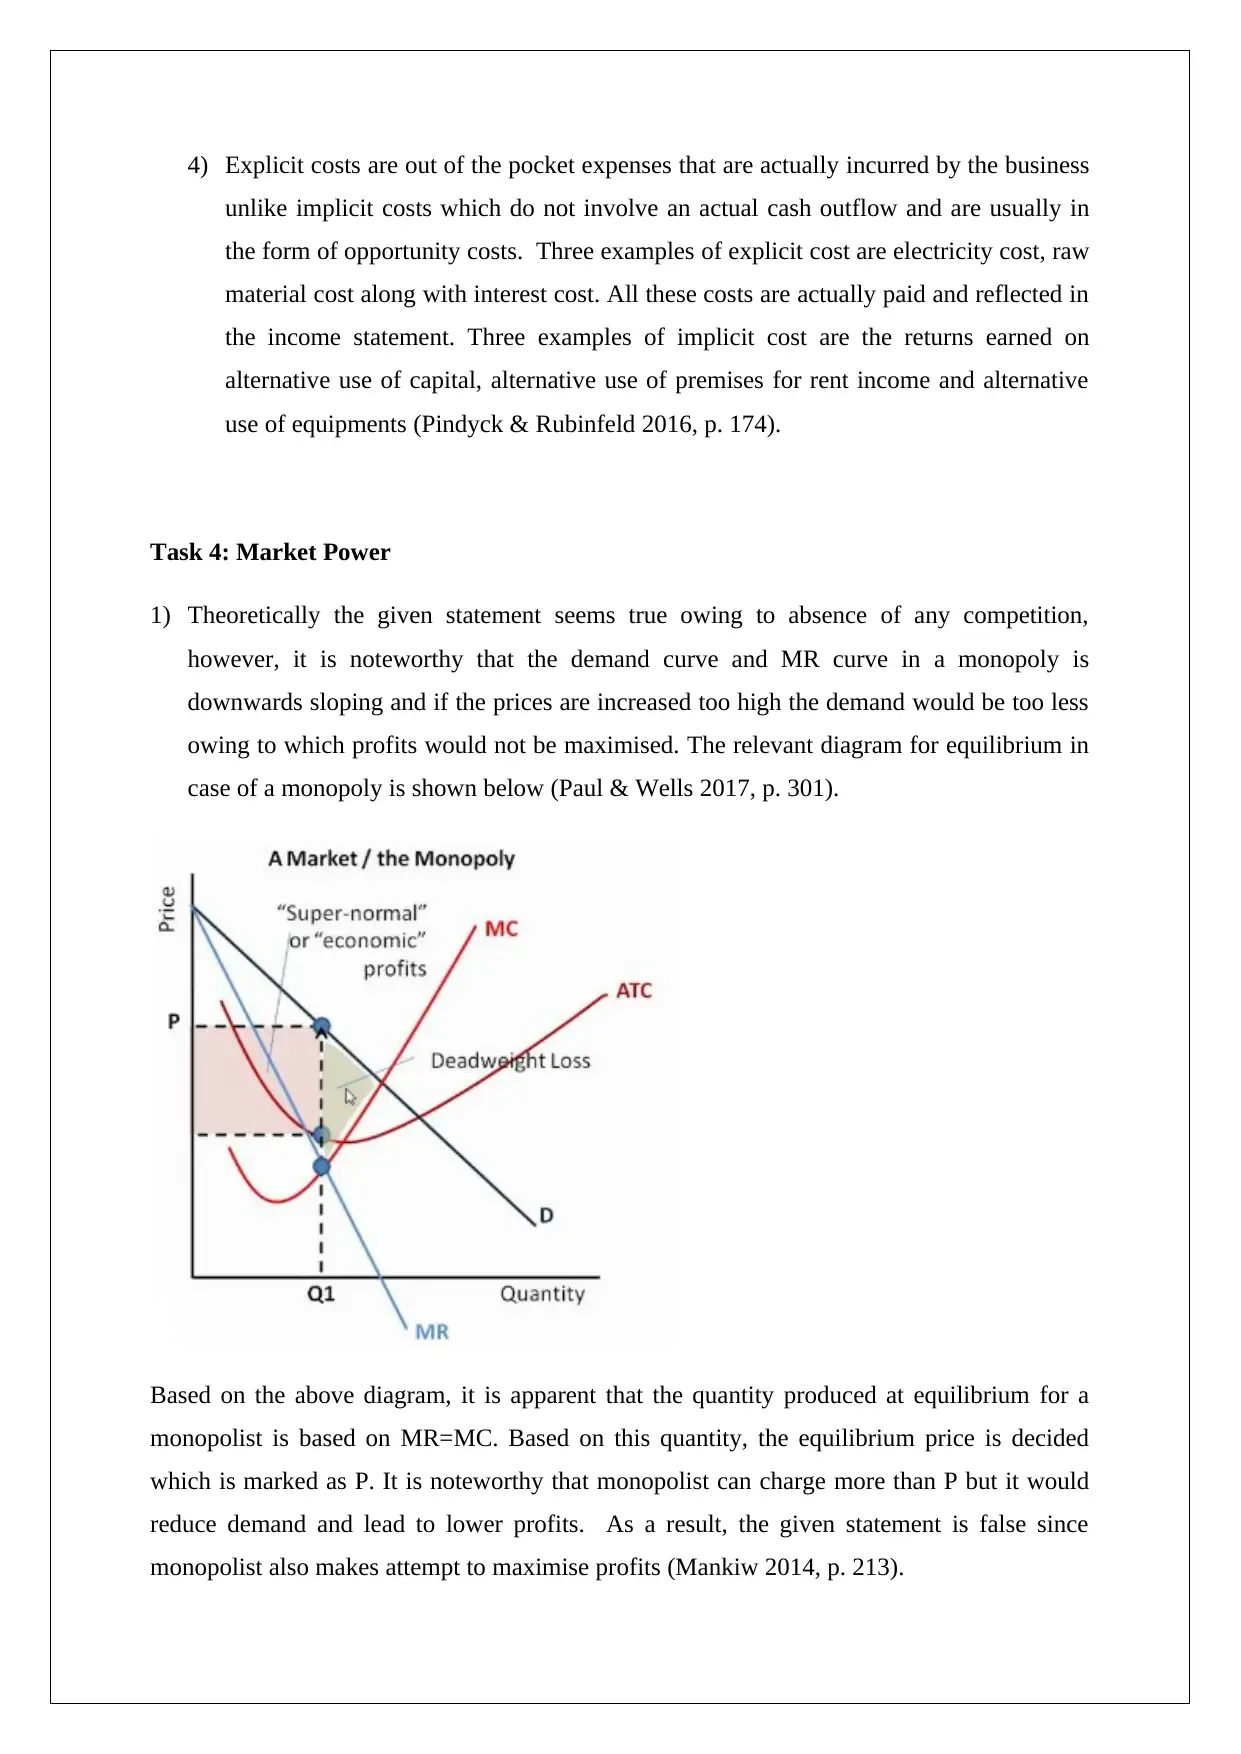
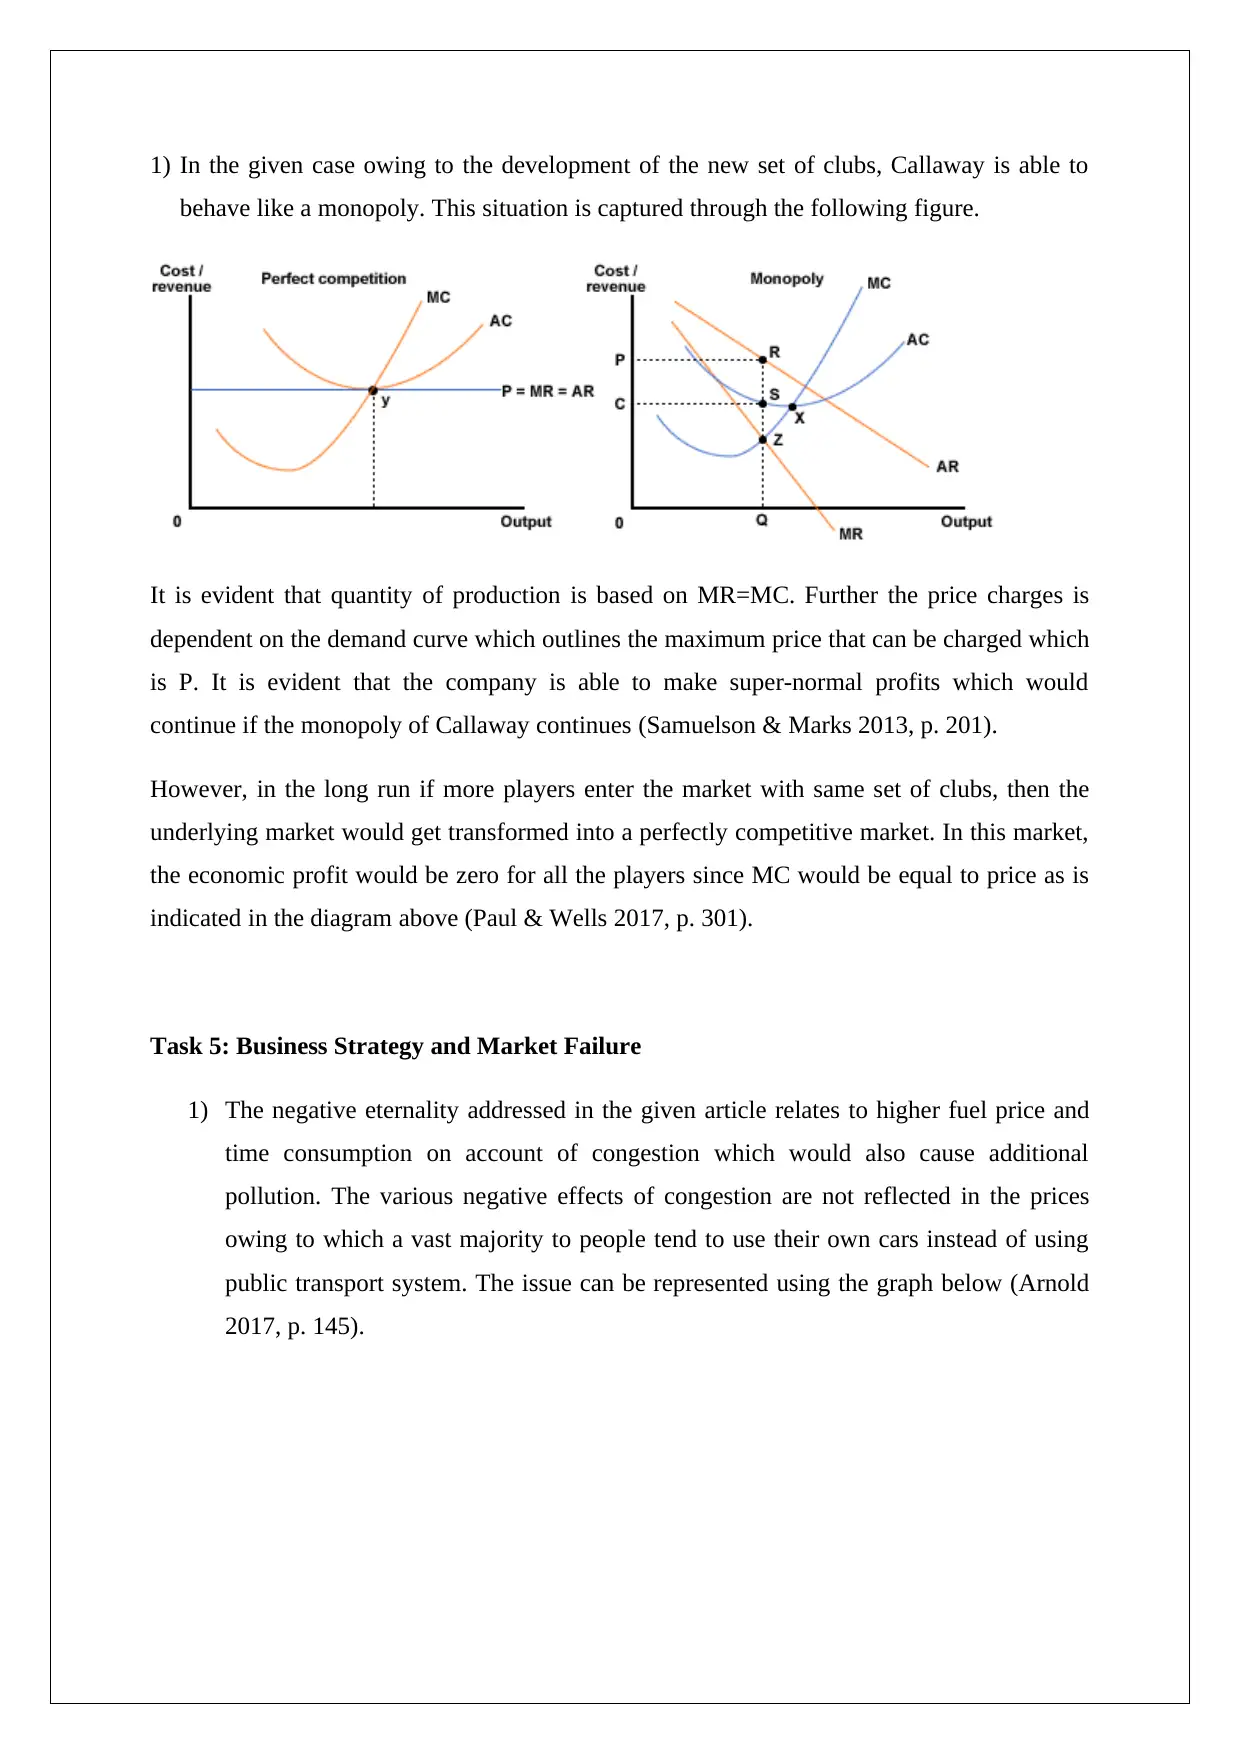
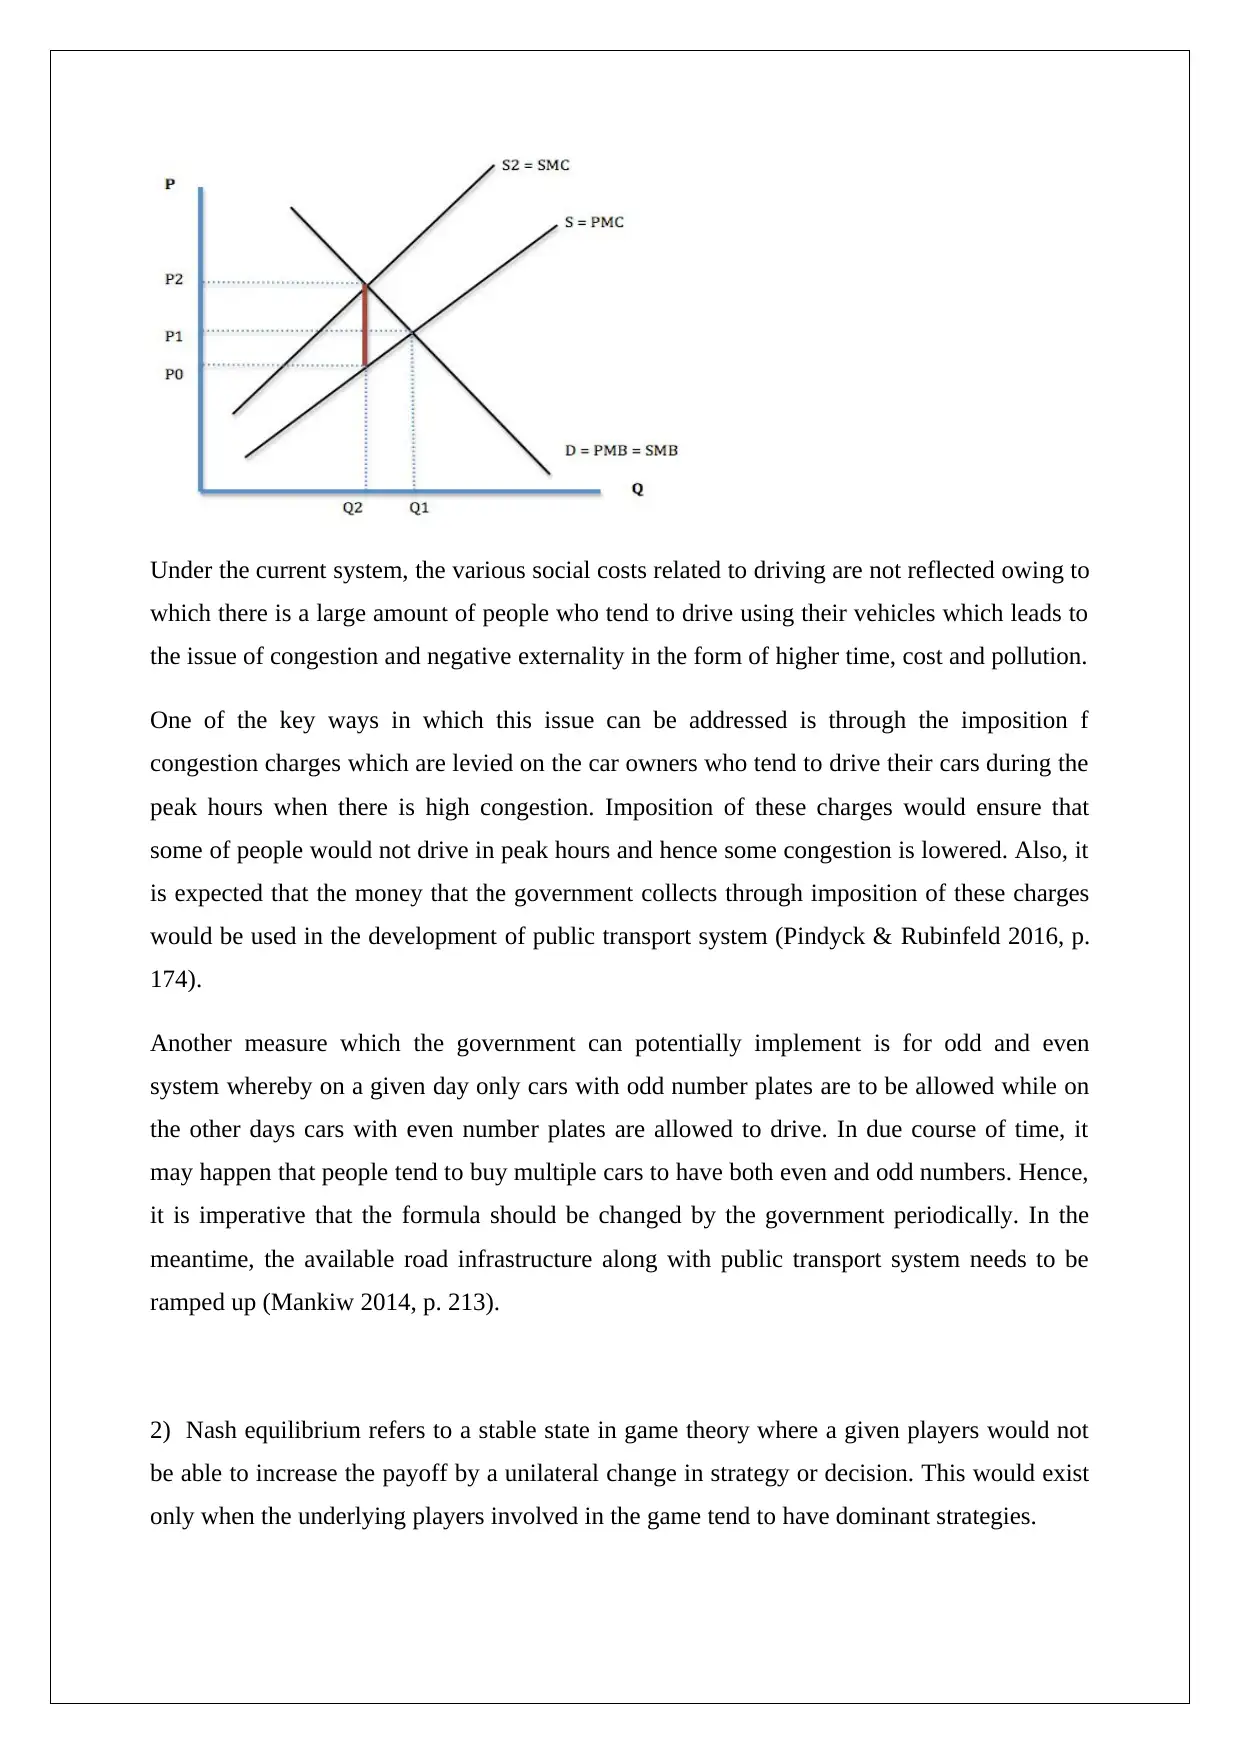
This economics assignment, completed for ECO10004, addresses several key economic principles. Task 2 analyzes elasticity, comparing the price elasticity of demand for an overseas trip versus prescription medication, and coffee versus hotel accommodation during the Sydney Olympics, supported by relevant diagrams. Task 3 delves into costs of production, examining the impact of license fees and new contracts on fixed and variable costs, and explaining the minimum efficient scale, along with examples of explicit and implicit costs. Task 4 explores market power, evaluating the pricing strategies of a monopolist and the impact of new product development on market competition. Task 5 focuses on business strategy and market failure, discussing negative externalities like congestion, and the Nash equilibrium in game theory, illustrated with examples.
Contribute Materials
Your contribution can guide someone’s learning journey. Share your
documents today.

ECONOMIC PRINCIPLES
STUDENT ID:
[Pick the date]
STUDENT ID:
[Pick the date]
Secure Best Marks with AI Grader
Need help grading? Try our AI Grader for instant feedback on your assignments.

TASK 2: Elasticity
1) The higher price elasticity of demand would be observed for ‘overseas trip’. This is
because price elasticity tends to be higher for luxury goods and lower for necessity goods.
‘Overseas trip’ is a luxury item owing to which in case of price hike there would be a host
of cheaper alternatives or the trip can be deferred. However, this is not possible for
prescription medicines.
2) ‘Coffee’ sold in a cafe would have higher elasticity in comparison to the ‘hotel
accommodation’ during Sydney Olympics. The key determinant is number of substitutes
available which is higher for coffee owing to existence of close substitutes. This is not true
for hotel since limited accommodation would be available in Sydney in the vicinity of the
events during Olympics.
3) The relevant diagram capturing the situation is shown below.
In the given case, the original equilibrium existed at q1 quantity with P1 price. However,
owing to destruction of pineapple crop for some farmers, there is a reduction in supply
causing a shift in the supply curve from S1 to S2. The demand curve remains constant owing
to which prices have increased to P2 from P1. Even though quantity demanded has decreased
but the decrease is much lower than the increase in prices. As a result, the pineapple farmers
as a whole would be better off because of the floods (Samuelson & Marks 2013, p. 201).

Task 3: Costs of Production
1) The application of license fee would lead to an increase in the fixed cost as the quantum of
fee is the same for each of the networks irrespective of the number of viewers that each
network has.
2) The new contract would change the variable costs as the ‘camera lens’ is used in mobile
phones owing to which the impact would depend on the number of mobile phones
produced.
3) The relevant diagram for minimum efficient scale is indicated below.
The minimum efficient scale may be defined as the lowest production level which a business
would have to achieve in order to ensure that long run average cost is minimum. For the firms
that are not able to reach the minimum efficient scale, it is highly likely that such firms would
have to close down in case of competitive markets as the other producers in the long run
would produce at MES. However, a monopolist can operate in the long run without achieving
MES so as to maximise profits (Arnold 2017, p. 145).

4) Explicit costs are out of the pocket expenses that are actually incurred by the business
unlike implicit costs which do not involve an actual cash outflow and are usually in
the form of opportunity costs. Three examples of explicit cost are electricity cost, raw
material cost along with interest cost. All these costs are actually paid and reflected in
the income statement. Three examples of implicit cost are the returns earned on
alternative use of capital, alternative use of premises for rent income and alternative
use of equipments (Pindyck & Rubinfeld 2016, p. 174).
Task 4: Market Power
1) Theoretically the given statement seems true owing to absence of any competition,
however, it is noteworthy that the demand curve and MR curve in a monopoly is
downwards sloping and if the prices are increased too high the demand would be too less
owing to which profits would not be maximised. The relevant diagram for equilibrium in
case of a monopoly is shown below (Paul & Wells 2017, p. 301).
Based on the above diagram, it is apparent that the quantity produced at equilibrium for a
monopolist is based on MR=MC. Based on this quantity, the equilibrium price is decided
which is marked as P. It is noteworthy that monopolist can charge more than P but it would
reduce demand and lead to lower profits. As a result, the given statement is false since
monopolist also makes attempt to maximise profits (Mankiw 2014, p. 213).
Secure Best Marks with AI Grader
Need help grading? Try our AI Grader for instant feedback on your assignments.

1) In the given case owing to the development of the new set of clubs, Callaway is able to
behave like a monopoly. This situation is captured through the following figure.
It is evident that quantity of production is based on MR=MC. Further the price charges is
dependent on the demand curve which outlines the maximum price that can be charged which
is P. It is evident that the company is able to make super-normal profits which would
continue if the monopoly of Callaway continues (Samuelson & Marks 2013, p. 201).
However, in the long run if more players enter the market with same set of clubs, then the
underlying market would get transformed into a perfectly competitive market. In this market,
the economic profit would be zero for all the players since MC would be equal to price as is
indicated in the diagram above (Paul & Wells 2017, p. 301).
Task 5: Business Strategy and Market Failure
1) The negative eternality addressed in the given article relates to higher fuel price and
time consumption on account of congestion which would also cause additional
pollution. The various negative effects of congestion are not reflected in the prices
owing to which a vast majority to people tend to use their own cars instead of using
public transport system. The issue can be represented using the graph below (Arnold
2017, p. 145).

Under the current system, the various social costs related to driving are not reflected owing to
which there is a large amount of people who tend to drive using their vehicles which leads to
the issue of congestion and negative externality in the form of higher time, cost and pollution.
One of the key ways in which this issue can be addressed is through the imposition f
congestion charges which are levied on the car owners who tend to drive their cars during the
peak hours when there is high congestion. Imposition of these charges would ensure that
some of people would not drive in peak hours and hence some congestion is lowered. Also, it
is expected that the money that the government collects through imposition of these charges
would be used in the development of public transport system (Pindyck & Rubinfeld 2016, p.
174).
Another measure which the government can potentially implement is for odd and even
system whereby on a given day only cars with odd number plates are to be allowed while on
the other days cars with even number plates are allowed to drive. In due course of time, it
may happen that people tend to buy multiple cars to have both even and odd numbers. Hence,
it is imperative that the formula should be changed by the government periodically. In the
meantime, the available road infrastructure along with public transport system needs to be
ramped up (Mankiw 2014, p. 213).
2) Nash equilibrium refers to a stable state in game theory where a given players would not
be able to increase the payoff by a unilateral change in strategy or decision. This would exist
only when the underlying players involved in the game tend to have dominant strategies.

3) There is only one Nash equilibrium in the given game which exists when the strategy of
both the players is to choose R & D. The expected payoff for AMD is $ 3 million while that
for Intel is $ 5 million. If AMD wants to make a unilateral shift to no R &D , then the payoff
would reduce to $ 1 million. As a result, there is no incentive for AMD to make the shift.
Now consider, that the shift is made by Intel unilaterally. In this shift, the payoff for Intel
would get reduced to $ 3 million from $ 5 million currently. As a result, the decision to invest
in R&D for both is Nash equilibrium as if any of the players make a unilateral shift in
strategy and decide not to invest in R&D, then their payoffs would reduce owing to which teh
stability of the system is ensured with the current strategy (Pindyck & Rubinfeld 2016, p.
174).
Paraphrase This Document
Need a fresh take? Get an instant paraphrase of this document with our AI Paraphraser

References
Arnold, A.R. 2017, Microeconomics, 9th edn, Cengage Learning, Sydney.
Mankiw, G. 2014, Microeconomics, 6th edn, Worth Publishers, London.
Nicholson, W. & Snyder, C. 2015, Fundamentals of Microeconomics, 11th edn, Cengage
Learning, New York.
Paul, K. & Wells, R. 2017, Microeconomics, 2nd edn, Worth Publishers, London.
Pindyck, R. & Rubinfeld, D. 2016, Microeconomics, 5th edn, Prentice-Hall Publications,
London.
Samuelson, W. & Marks, S. 2013, Managerial Economics, 4th edn, Wiley Publications, New
York.
1 out of 8

Your All-in-One AI-Powered Toolkit for Academic Success.
+13062052269
info@desklib.com
Available 24*7 on WhatsApp / Email
Unlock your academic potential
© 2024 | Zucol Services PVT LTD | All rights reserved.