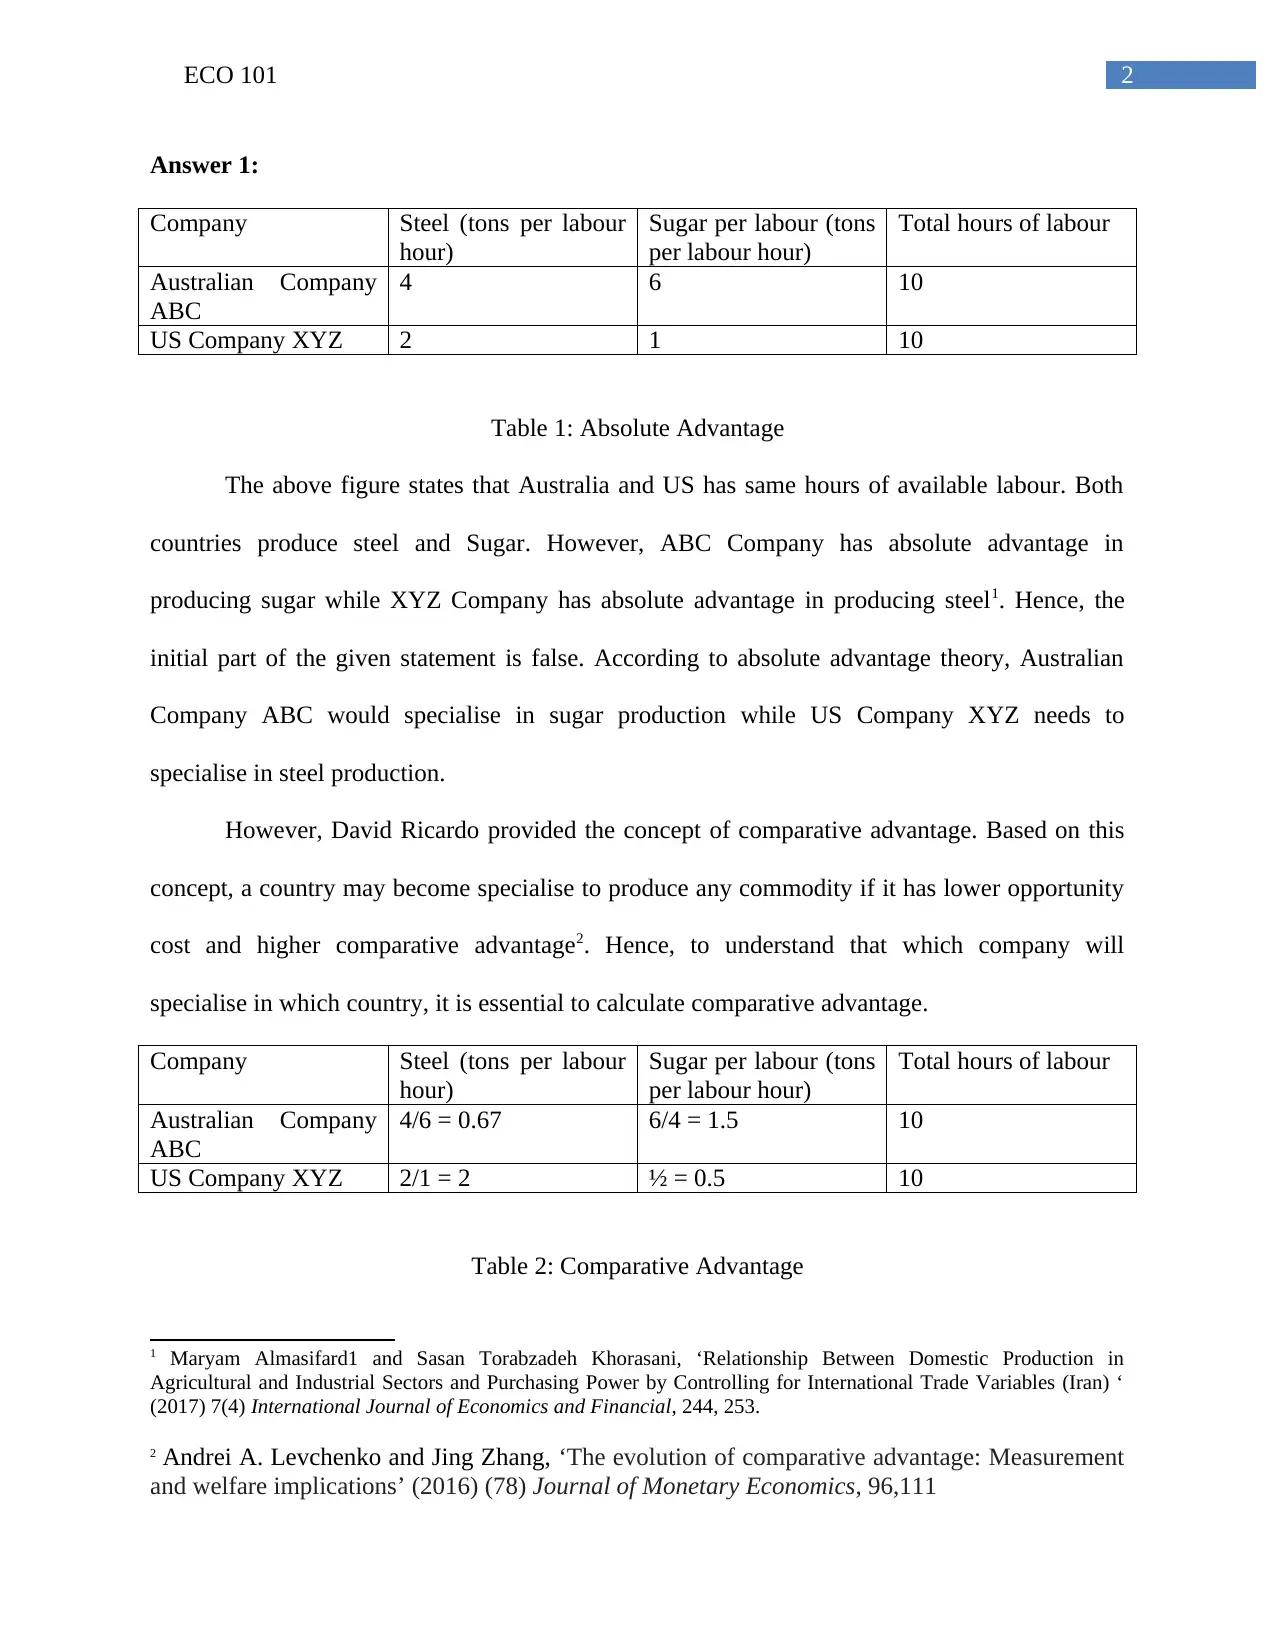
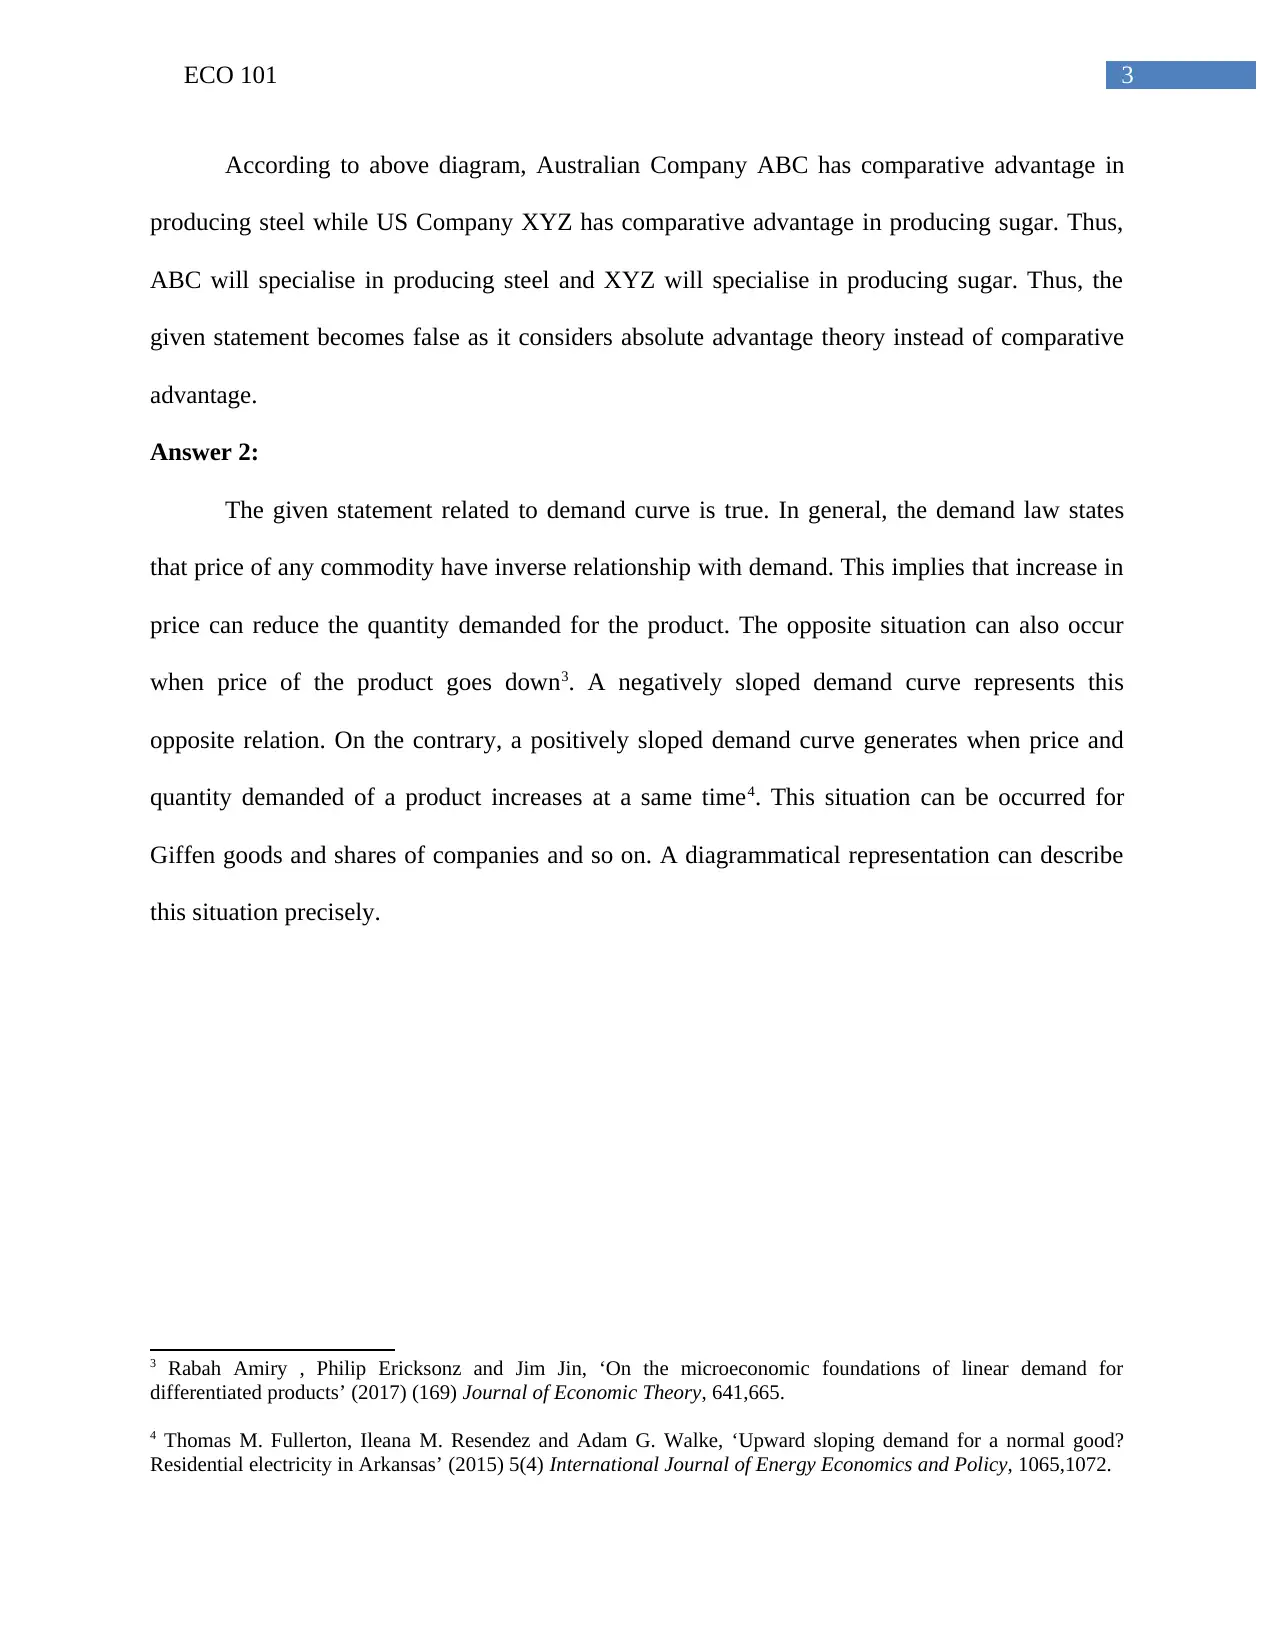
ECO 101 Microeconomics Assignment: True/False Analysis and Discussion
VerifiedAdded on 2023/06/03
|10
|1708
|209
Homework Assignment
AI Summary
This ECO 101 Microeconomics assignment presents a detailed analysis of four True/False statements covering topics such as absolute and comparative advantage, demand curves, marginal and average product relationships, and firm profit conditions. The first statement is refuted by demonstrating that comparative advantage, not absolute advantage, determines specialization in international trade. The second statement is validated by explaining the inverse relationship between price and quantity demanded, while also acknowledging exceptions like Giffen goods. The third statement is confirmed using the law of diminishing returns to illustrate the relationship between marginal and average product. Finally, the fourth statement is disproved by clarifying that zero profit does not necessitate a firm's exit from an industry, especially in a perfectly competitive market where firms operate efficiently at the minimum point of the long-run average cost curve. The assignment is supported by relevant diagrams and references.

Running head: ECO 101
Eco 101
Name of the Student
Name of the University
Author Note+
Eco 101
Name of the Student
Name of the University
Author Note+
Paraphrase This Document
Need a fresh take? Get an instant paraphrase of this document with our AI Paraphraser

1ECO 101
Table of Contents
Answer 1:.........................................................................................................................................2
Answer 2:.........................................................................................................................................3
Answer 3:.........................................................................................................................................4
Answer 4:.........................................................................................................................................6
References:......................................................................................................................................8

2ECO 101
Answer 1:
Company Steel (tons per labour
hour)
Sugar per labour (tons
per labour hour)
Total hours of labour
Australian Company
ABC
4 6 10
US Company XYZ 2 1 10
Table 1: Absolute Advantage
The above figure states that Australia and US has same hours of available labour. Both
countries produce steel and Sugar. However, ABC Company has absolute advantage in
producing sugar while XYZ Company has absolute advantage in producing steel1. Hence, the
initial part of the given statement is false. According to absolute advantage theory, Australian
Company ABC would specialise in sugar production while US Company XYZ needs to
specialise in steel production.
However, David Ricardo provided the concept of comparative advantage. Based on this
concept, a country may become specialise to produce any commodity if it has lower opportunity
cost and higher comparative advantage2. Hence, to understand that which company will
specialise in which country, it is essential to calculate comparative advantage.
Company Steel (tons per labour
hour)
Sugar per labour (tons
per labour hour)
Total hours of labour
Australian Company
ABC
4/6 = 0.67 6/4 = 1.5 10
US Company XYZ 2/1 = 2 ½ = 0.5 10
Table 2: Comparative Advantage
1 Maryam Almasifard1 and Sasan Torabzadeh Khorasani, ‘Relationship Between Domestic Production in
Agricultural and Industrial Sectors and Purchasing Power by Controlling for International Trade Variables (Iran) ‘
(2017) 7(4) International Journal of Economics and Financial, 244, 253.
2 Andrei A. Levchenko and Jing Zhang, ‘The evolution of comparative advantage: Measurement
and welfare implications’ (2016) (78) Journal of Monetary Economics, 96,111
⊘ This is a preview!⊘
Do you want full access?
Subscribe today to unlock all pages.

Trusted by 1+ million students worldwide

3ECO 101
According to above diagram, Australian Company ABC has comparative advantage in
producing steel while US Company XYZ has comparative advantage in producing sugar. Thus,
ABC will specialise in producing steel and XYZ will specialise in producing sugar. Thus, the
given statement becomes false as it considers absolute advantage theory instead of comparative
advantage.
Answer 2:
The given statement related to demand curve is true. In general, the demand law states
that price of any commodity have inverse relationship with demand. This implies that increase in
price can reduce the quantity demanded for the product. The opposite situation can also occur
when price of the product goes down3. A negatively sloped demand curve represents this
opposite relation. On the contrary, a positively sloped demand curve generates when price and
quantity demanded of a product increases at a same time4. This situation can be occurred for
Giffen goods and shares of companies and so on. A diagrammatical representation can describe
this situation precisely.
3 Rabah Amiry , Philip Ericksonz and Jim Jin, ‘On the microeconomic foundations of linear demand for
differentiated products’ (2017) (169) Journal of Economic Theory, 641,665.
4 Thomas M. Fullerton, Ileana M. Resendez and Adam G. Walke, ‘Upward sloping demand for a normal good?
Residential electricity in Arkansas’ (2015) 5(4) International Journal of Energy Economics and Policy, 1065,1072.
Paraphrase This Document
Need a fresh take? Get an instant paraphrase of this document with our AI Paraphraser

4ECO 101
Price
O
P0
P1
Q0 Q1
Quantity demanded
D
Source: (created by author)
In the above diagram, price of a product increases from P0 to P1 and consequently
demand for the product also increases from Q0 to Q1. This positive relation between price and
quantity demanded generates an upward rising demand curve, D, which has positive slope.
Answer 3:
The statement is true that if the marginal product decreases, the average product should
decrease. This statement can be described with the law of diminishing returns.
The law related to diminishing marginal return can establish the relation between
marginal product and average product. Marginal product of any input implies the increase of
total product due to one unit increase of this input while other inputs are remained constant.
Average product related to any input, one the other side, represents total product divided by the
Figure 1: Positively sloped demand curve

5ECO 101
MP
AP
Marginal product and Average product
Quantity of input
O
A
amount of this input employed5. Based on the diminishing law, average product and marginal
product increase at the initial phase. However, marginal product reaches to its maximum point at
first and then it starts to decline. Average product reaches to its highest point later and at that
point it intersects with diminishing portion of marginal product curve6. After this point average
product curve also starts to decrease. This relation can be described with the help of following
diagram.
Source: (created by author)
Figure 2 represents that after point A, both average product curve and marginal product
curve has declined together. Furthermore, marginal product curve starts to decline before average
5 Ballard Timothy, Gillian Yeo, Andrew Neal, and Simon Farrell. ‘Departures from optimality when pursuing
multiple approach or avoidance goals’ (2016) 101(7) Journal of Applied Psychology, 1056.
6 Eckel Carsten, Leonardo Iacovone, Beata Javorcik, and Peter Neary. ‘Multi-product firms at home and away: Cost-
versus quality-based competence’ (2015) 95(2) Journal of International Economics, 216,232.
Figure 2: Marginal Product and Average Product
⊘ This is a preview!⊘
Do you want full access?
Subscribe today to unlock all pages.

Trusted by 1+ million students worldwide

6ECO 101
product curve. Hence, from there it can be stated that if marginal product decreases, average
product should decrease.
Answer 4:
The given statement states that a firm, which is making zero profits, should leave the
industry. This statement is false.
Zero profit occurs when total revenue and total cost of a firm becomes equal. Hence,
normal profit represents the minimum profit level that a company needs to sustain within the
industry. Zero profit of the firm arises when firm uses its resources efficiently. During this
situation, a firm operates at the minimum point of long run average cost curve. However, zero
profit does not imply that the firm earns no money7. In a perfectly competitive market, firms can
earn zero economic profit during short-run and long-run. During short–run, firms earn excess
profit and this attracts other firms to enter into the market. On the contrary, if firms incur loss in
short-run then some of them can leave the market8. Thus, in long-run, all existing firms earn zero
profits only. Hence, this means that these firms efficiently utilise resources. Thus, they will not
leave the industry.
7 Simshauser Paul, and Jude Ariyaratnam. ‘What is normal profit for power generation?’ (2014) 6(2) Journal of
Financial Economic Policy, 152,178.
8 Shirai Kenji, and Yoshinori Amano. ‘CHARACTERISTIC SIMILARITY OF PRODUCTION KEY ELEMENTS
GREATLY AFFECTING PROFIT OF A PRODUCTIVE BUSINESS’ (2018) 14(5) INTERNATIONAL JOURNAL
OF INNOVATIVE COMPUTING INFORMATION AND CONTROL, 1929,1946.
Paraphrase This Document
Need a fresh take? Get an instant paraphrase of this document with our AI Paraphraser

7ECO 101
MC
AC
AR=MR= P
Revenues and Costs
QuantityO
Zero Profit
Source: (created by author)
The above diagram represents the condition of zero profit. In this situation, the average
total cost curve intersects with average total revenue and marginal revenue curve. Thus, cost
equates with revenue and the firm does not earn any excess profit or incurs any cost. Hence, it
can efficiently perform in the industry.
Figure 3: Zero profit condition

8ECO 101
References:
Andrei A. Levchenko and Jing Zhang, ‘The evolution of comparative advantage: Measurement
and welfare implications’ (2016) (78) Journal of Monetary Economics, 96,111.
Ballard Timothy, Gillian Yeo, Andrew Neal, and Simon Farrell. ‘Departures from optimality
when pursuing multiple approach or avoidance goals’ (2016) 101(7) Journal of Applied
Psychology, 1056.
Eckel Carsten, Leonardo Iacovone, Beata Javorcik, and Peter Neary. ‘Multi-product firms at
home and away: Cost-versus quality-based competence’ (2015) 95(2) Journal of International
Economics, 216,232.
Maryam Almasifard1 and Sasan Torabzadeh Khorasani, ‘Relationship Between Domestic
Production in Agricultural and Industrial Sectors and Purchasing Power by Controlling for
International Trade Variables (Iran) ‘ (2017) 7(4) International Journal of Economics and
Financial, 244, 253.
Rabah Amiry , Philip Ericksonz and Jim Jin, ‘On the microeconomic foundations of linear
demand for differentiated products’ (2017) (169) Journal of Economic Theory, 641,665.
Shirai Kenji, and Yoshinori Amano. ‘CHARACTERISTIC SIMILARITY OF PRODUCTION
KEY ELEMENTS GREATLY AFFECTING PROFIT OF A PRODUCTIVE BUSINESS’
(2018) 14(5) INTERNATIONAL JOURNAL OF INNOVATIVE COMPUTING INFORMATION
AND CONTROL, 1929,1946.
Simshauser Paul, and Jude Ariyaratnam. ‘What is normal profit for power generation?’ (2014)
6(2) Journal of Financial Economic Policy, 152,178.
⊘ This is a preview!⊘
Do you want full access?
Subscribe today to unlock all pages.

Trusted by 1+ million students worldwide

9ECO 101
Thomas M. Fullerton, Ileana M. Resendez and Adam G. Walke, ‘Upward sloping demand for a
normal good? Residential electricity in Arkansas’ (2015) 5(4) International Journal of Energy
Economics and Policy, 1065,1072.
Thomas M. Fullerton, Ileana M. Resendez and Adam G. Walke, ‘Upward sloping demand for a
normal good? Residential electricity in Arkansas’ (2015) 5(4) International Journal of Energy
Economics and Policy, 1065,1072.
1 out of 10
Related Documents

Your All-in-One AI-Powered Toolkit for Academic Success.
+13062052269
info@desklib.com
Available 24*7 on WhatsApp / Email
Unlock your academic potential
Copyright © 2020–2025 A2Z Services. All Rights Reserved. Developed and managed by ZUCOL.