ECO10250 Microeconomics: S2 2018 Assignment 1 - Market Analysis

Verified

Added on  2023/06/10

|12
|1914
|262
Homework Assignment
AI Summary
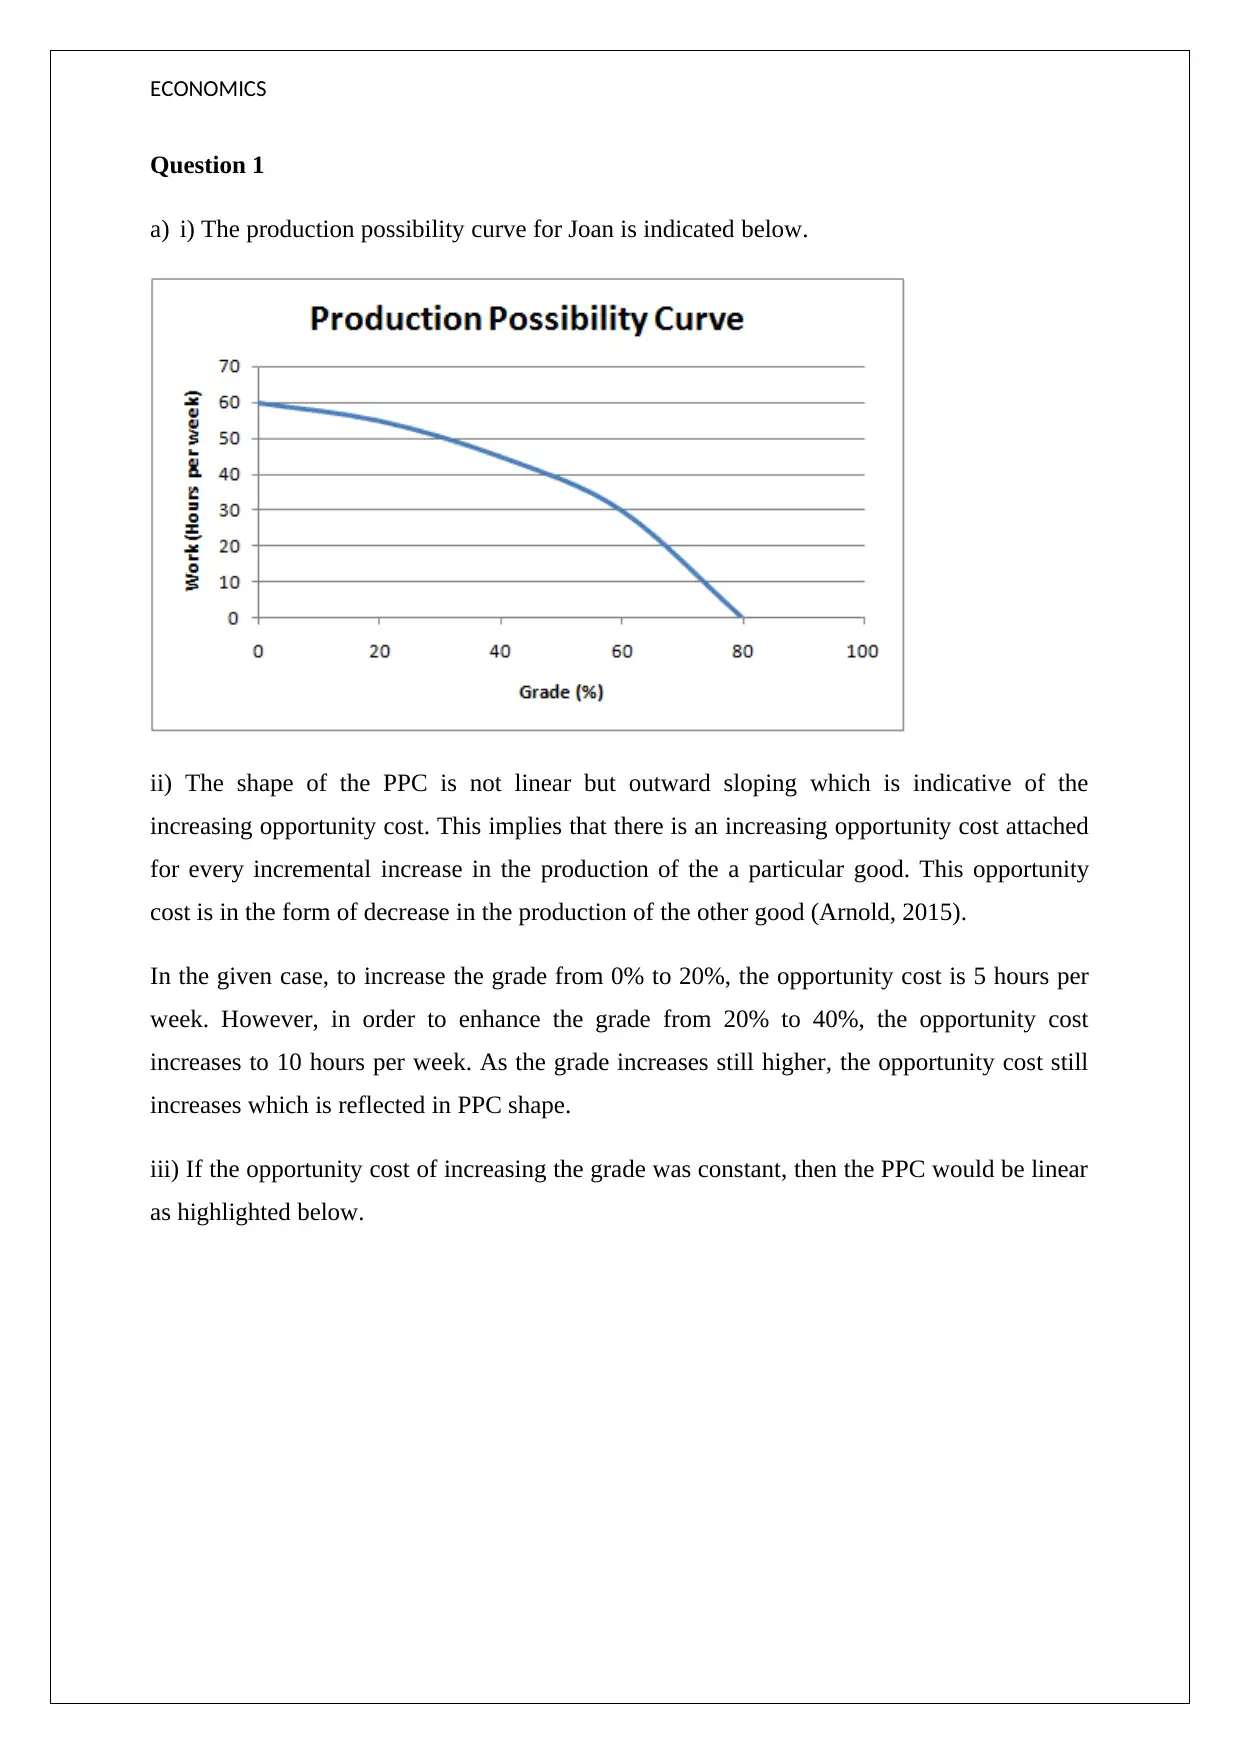
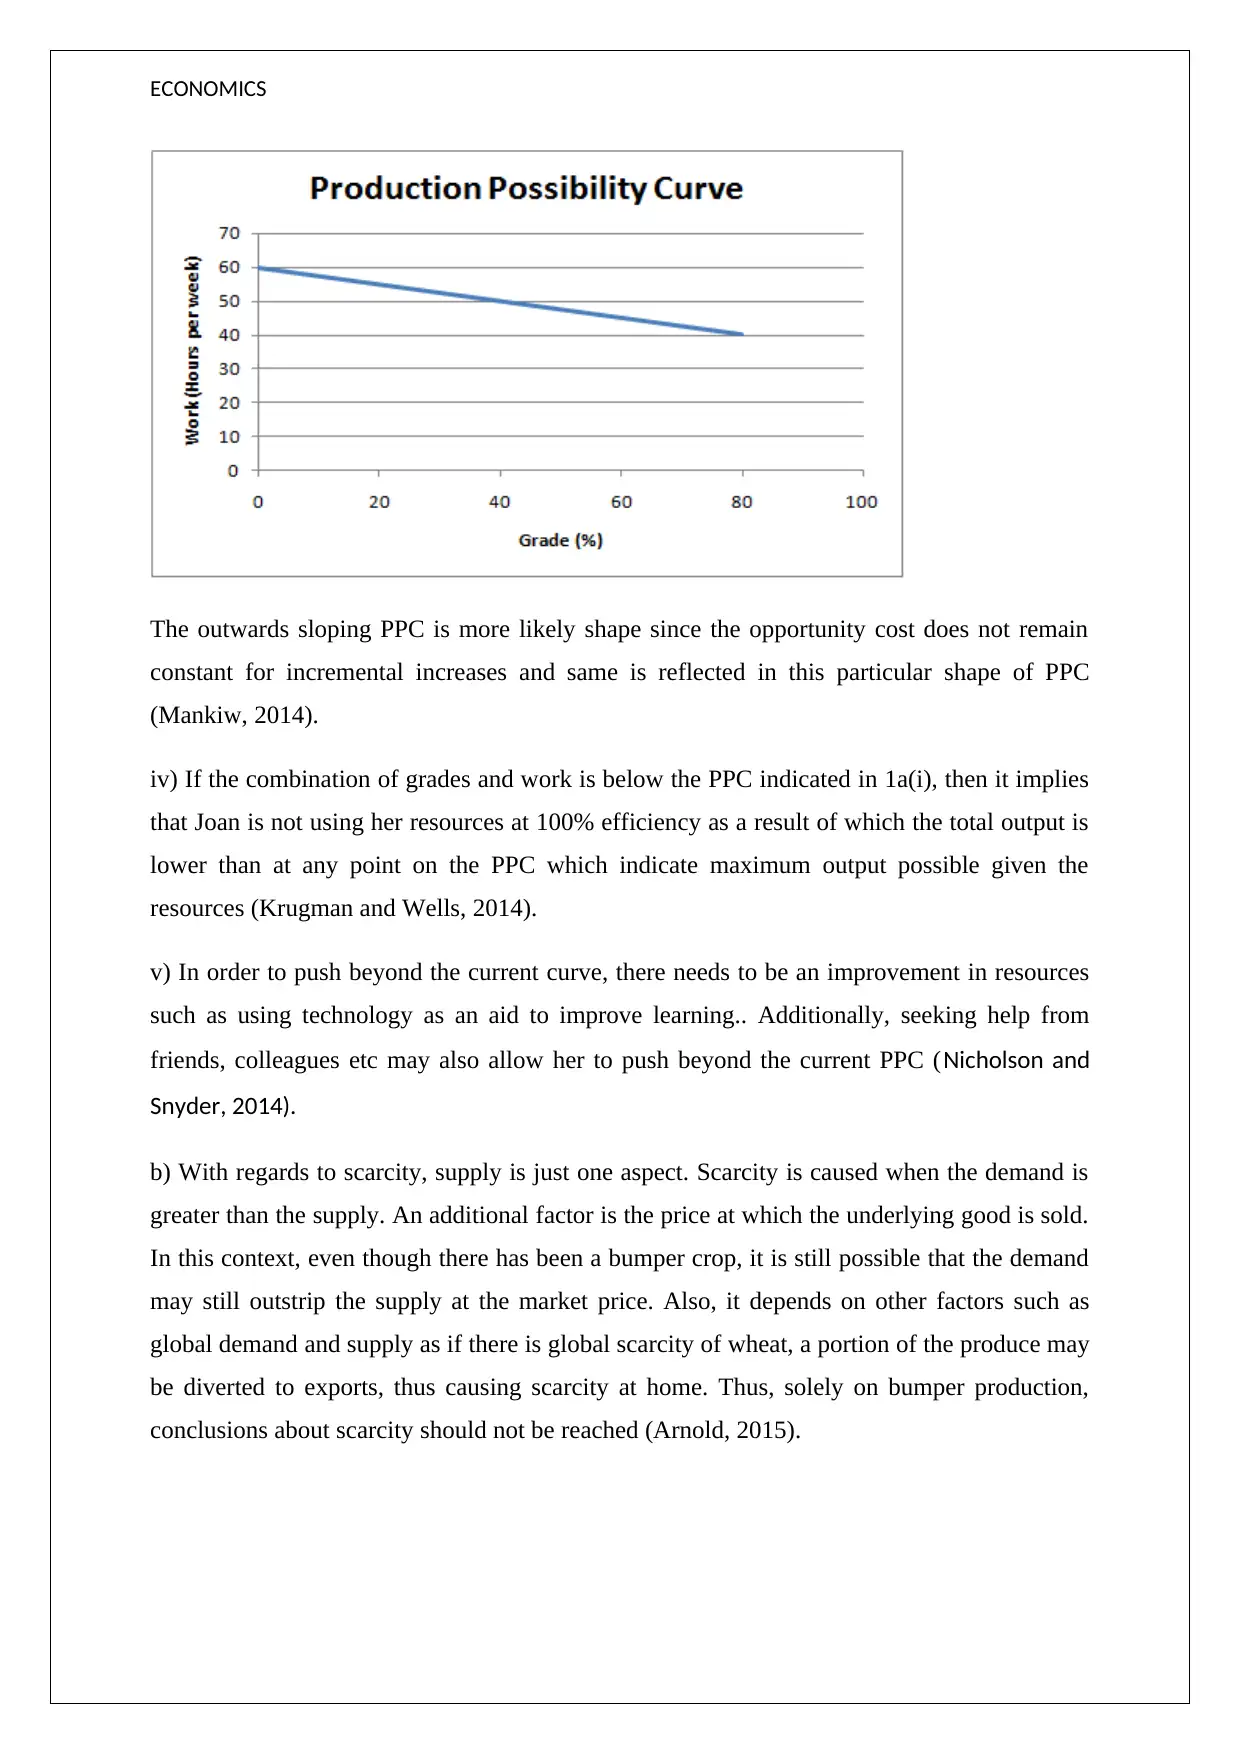
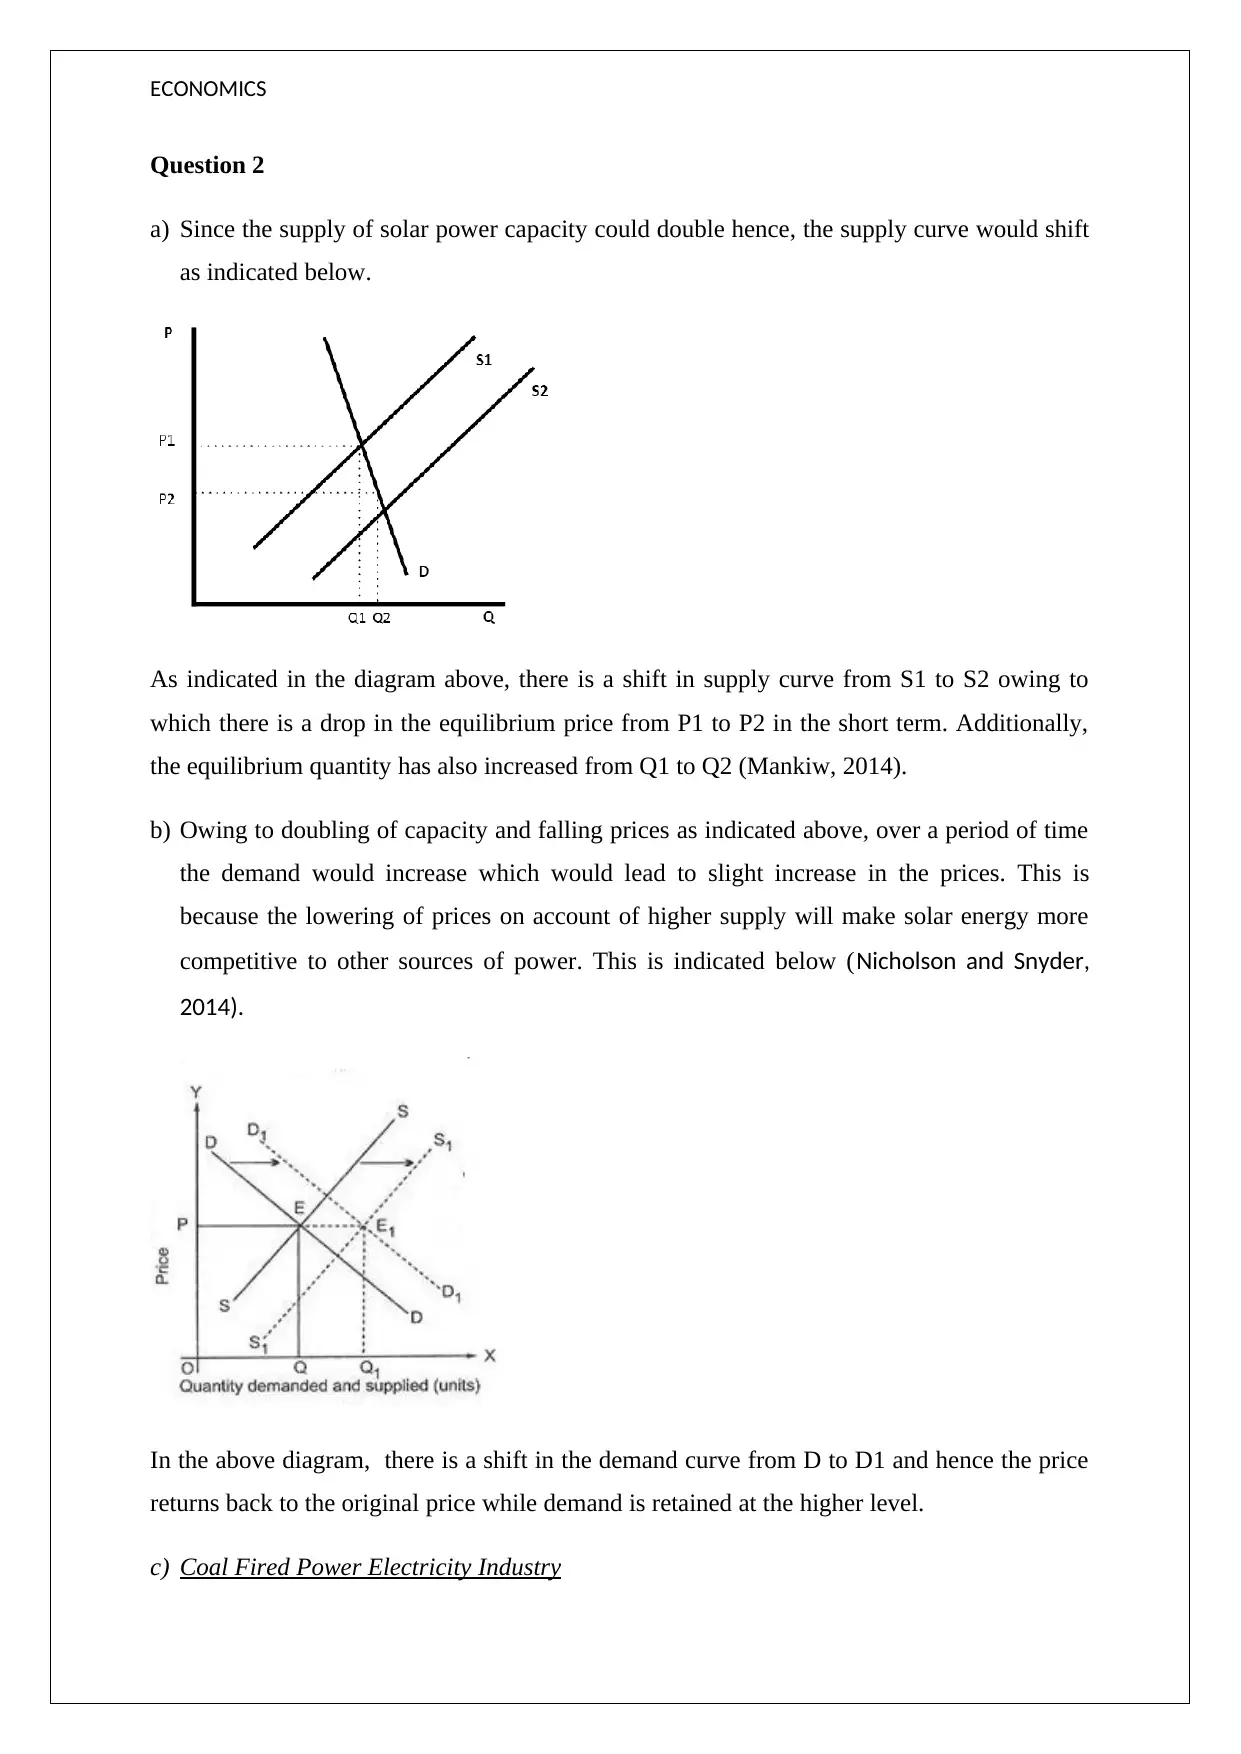
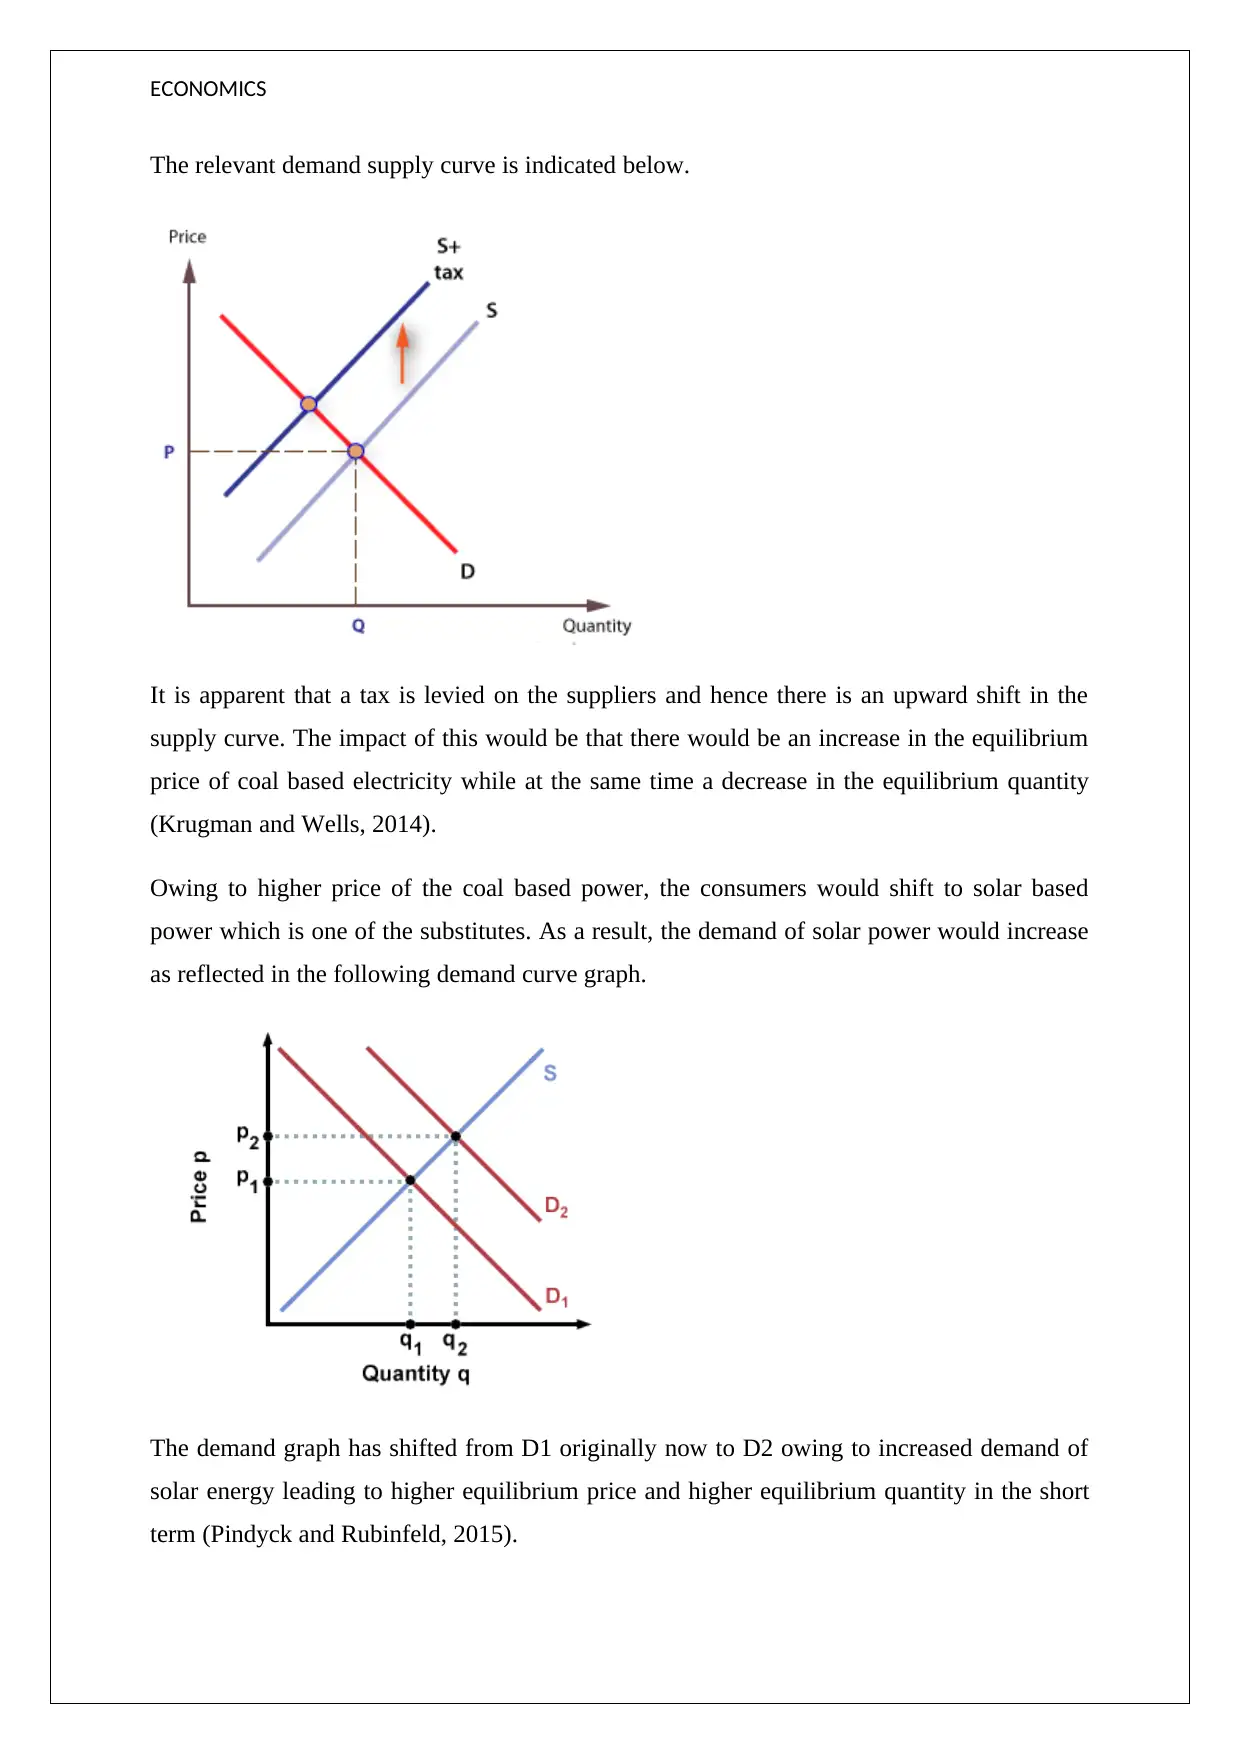
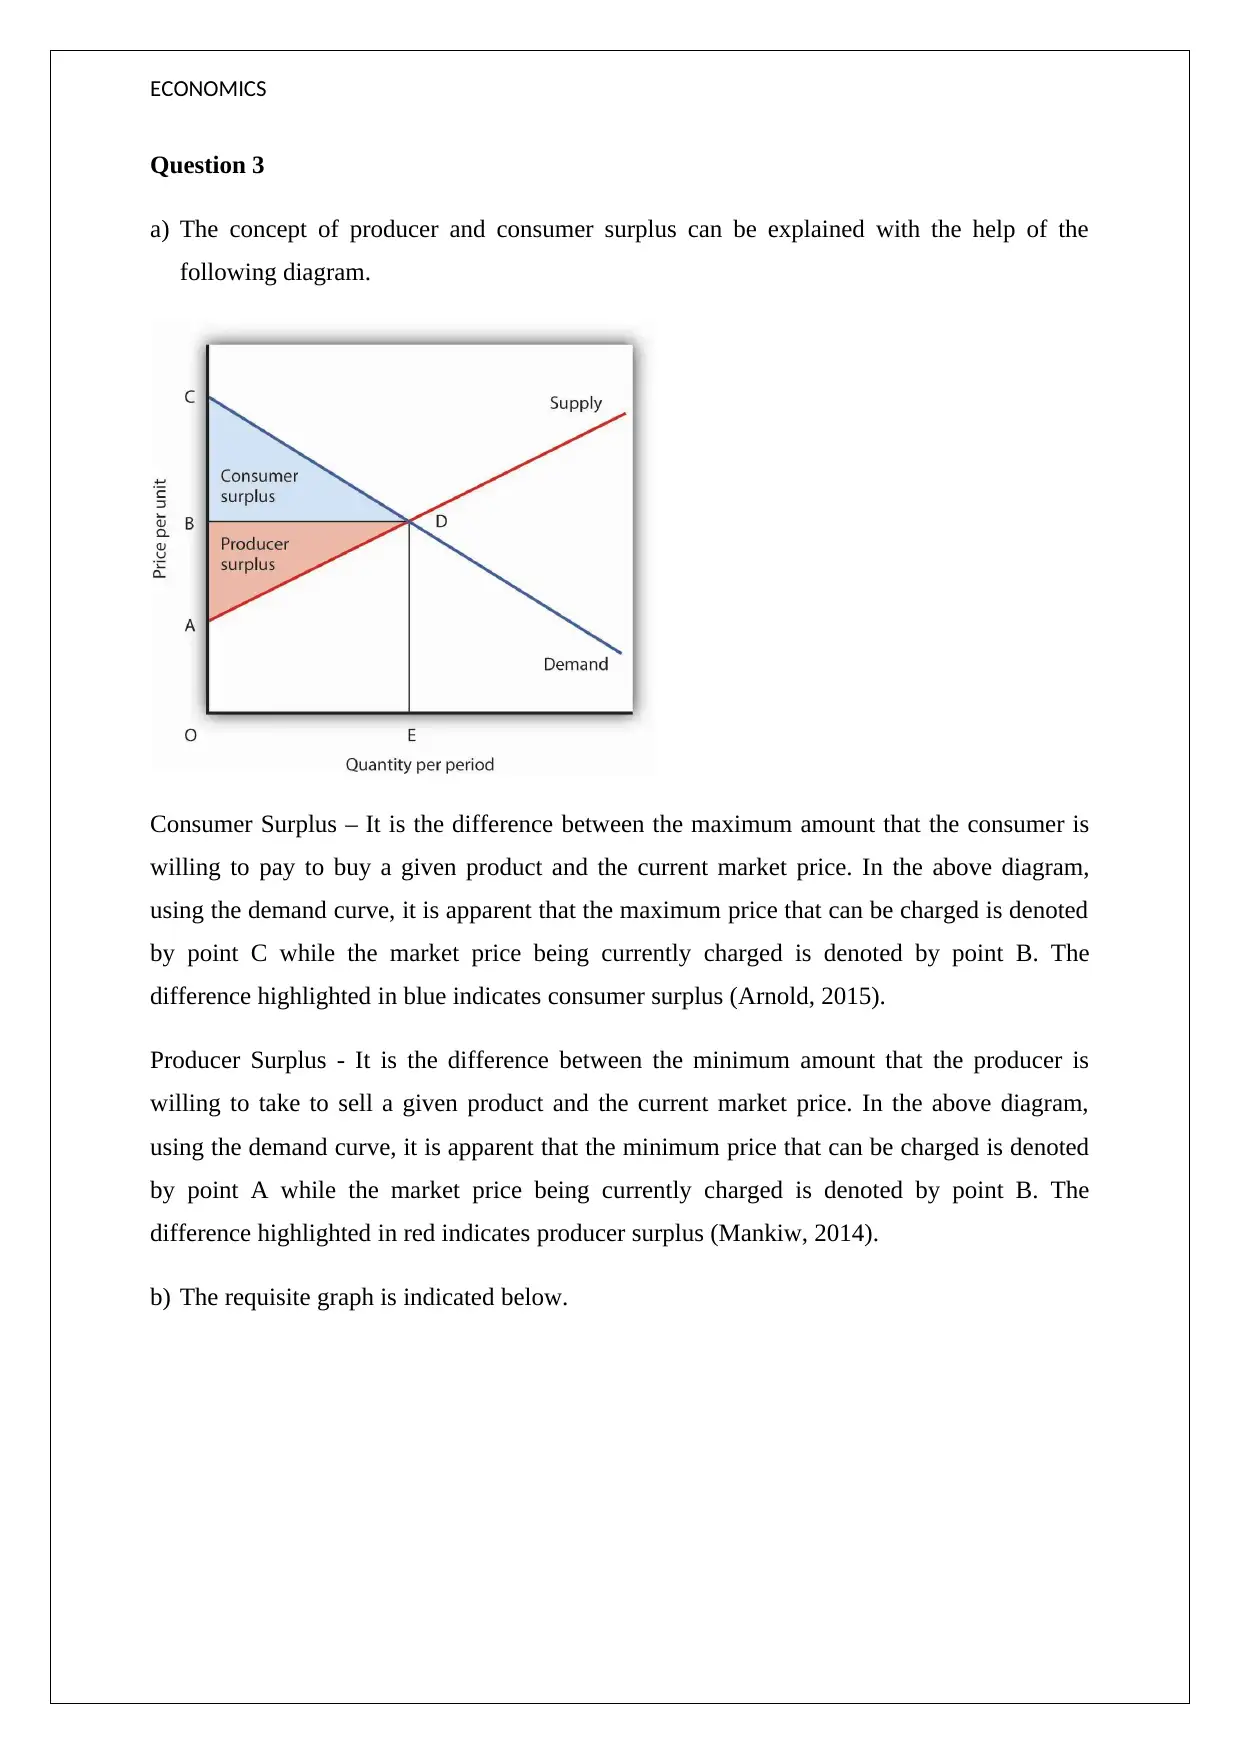
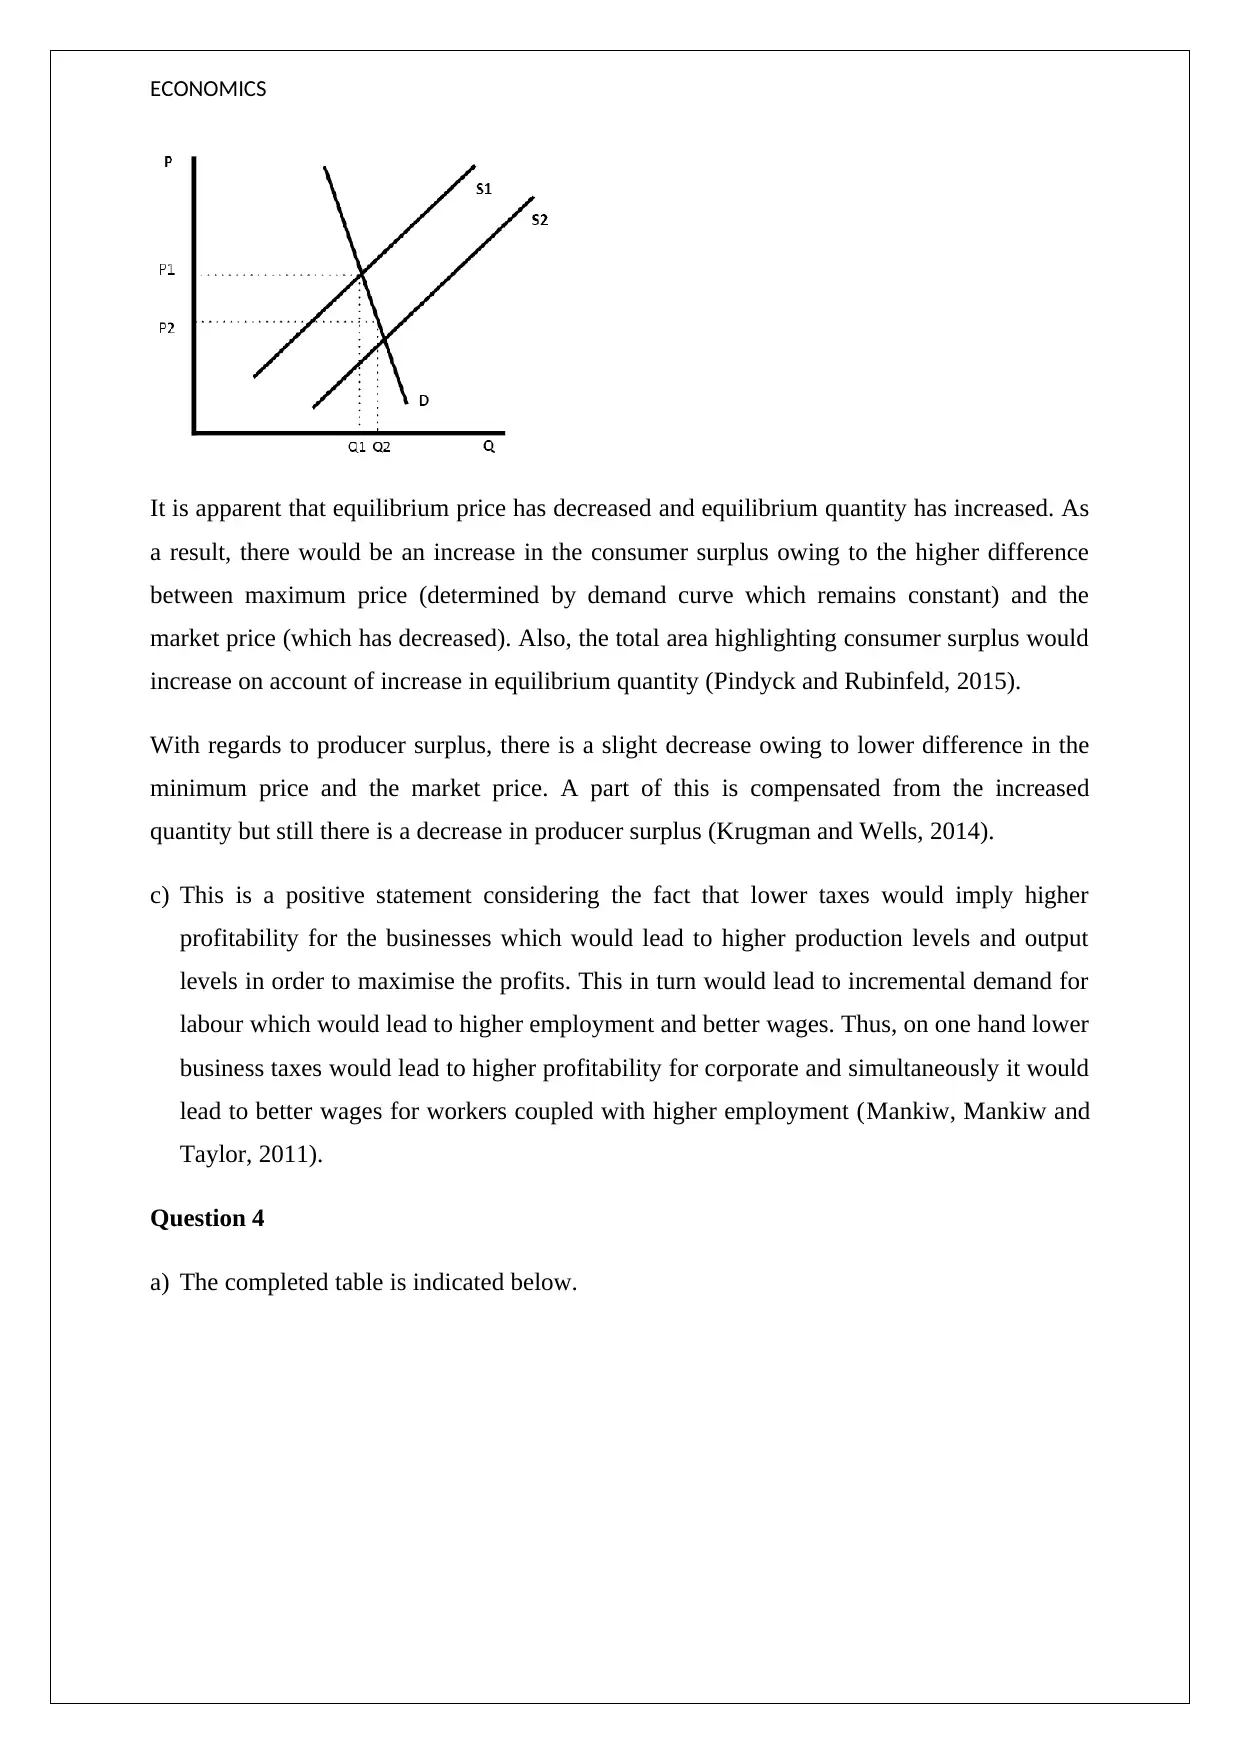
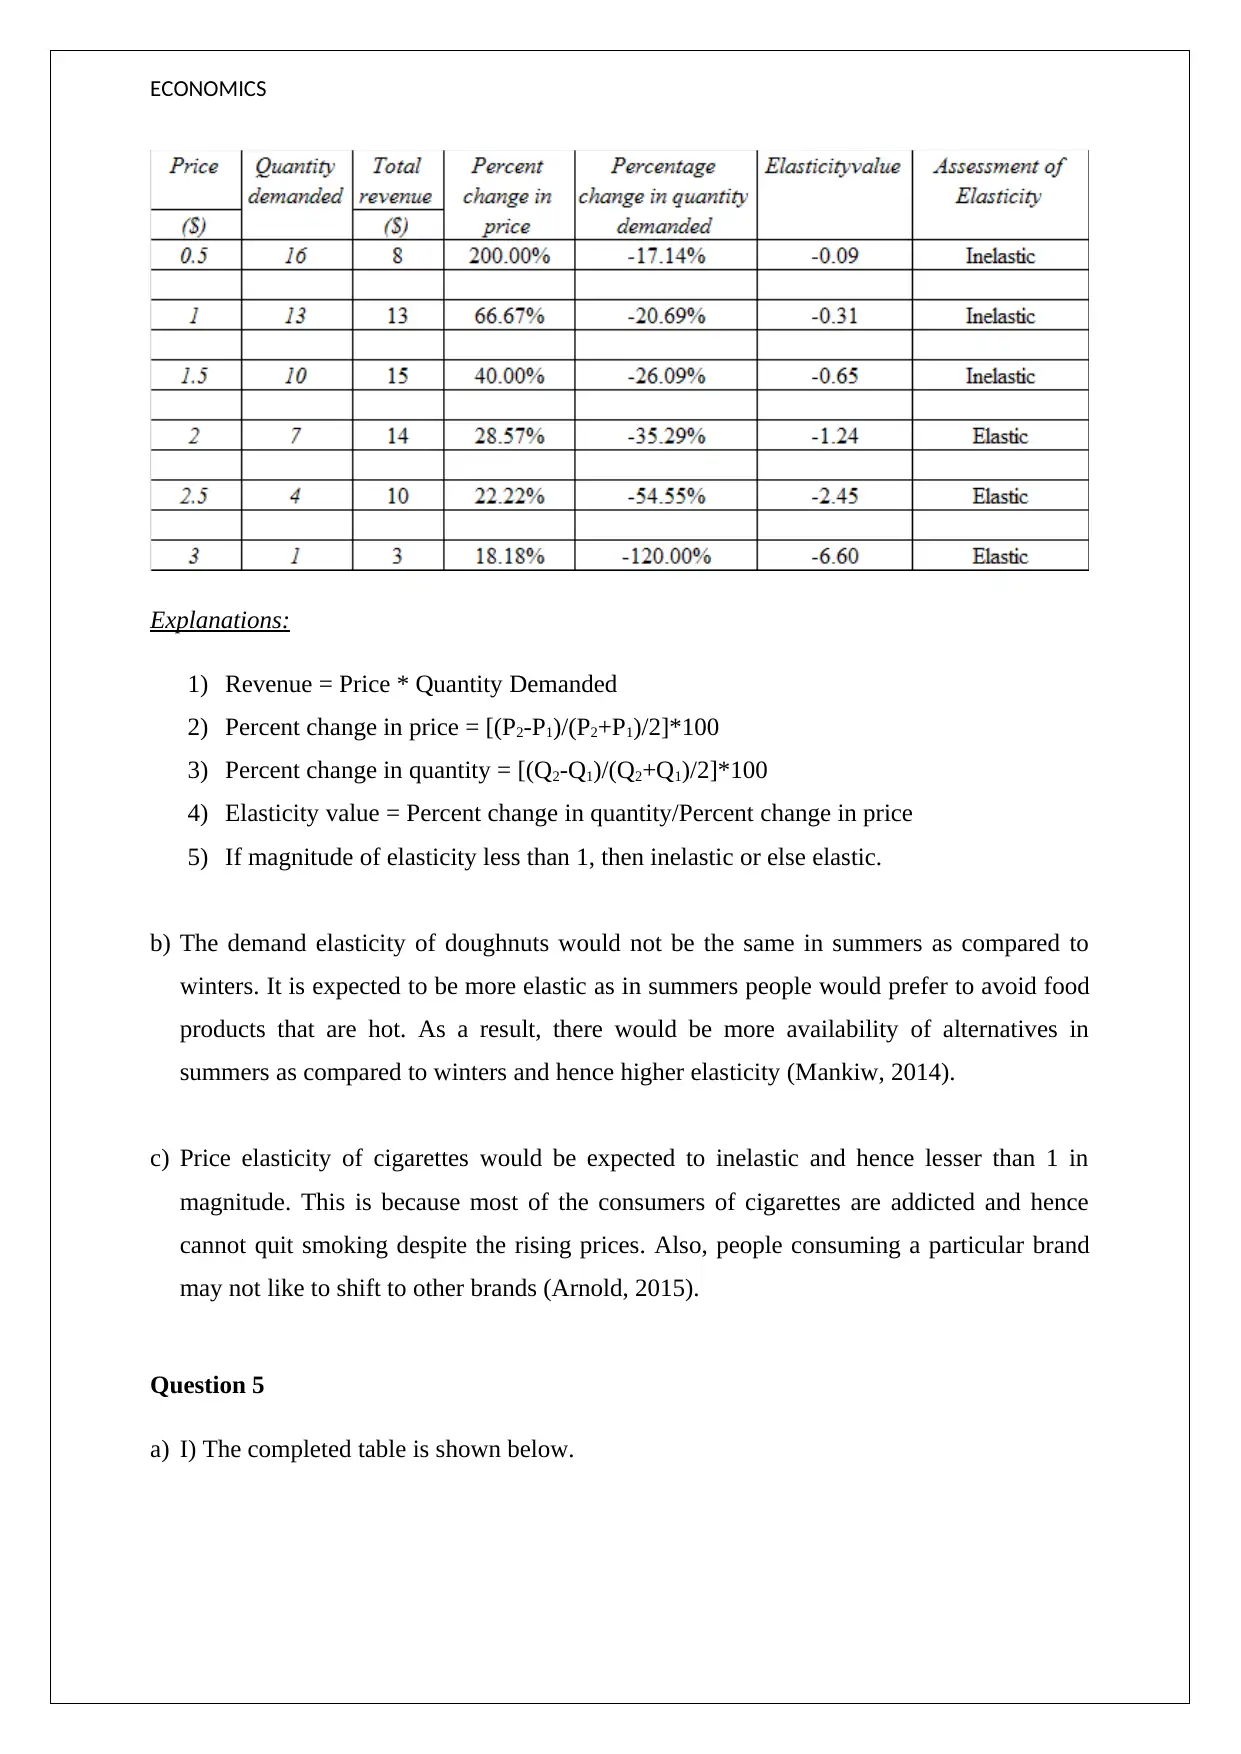
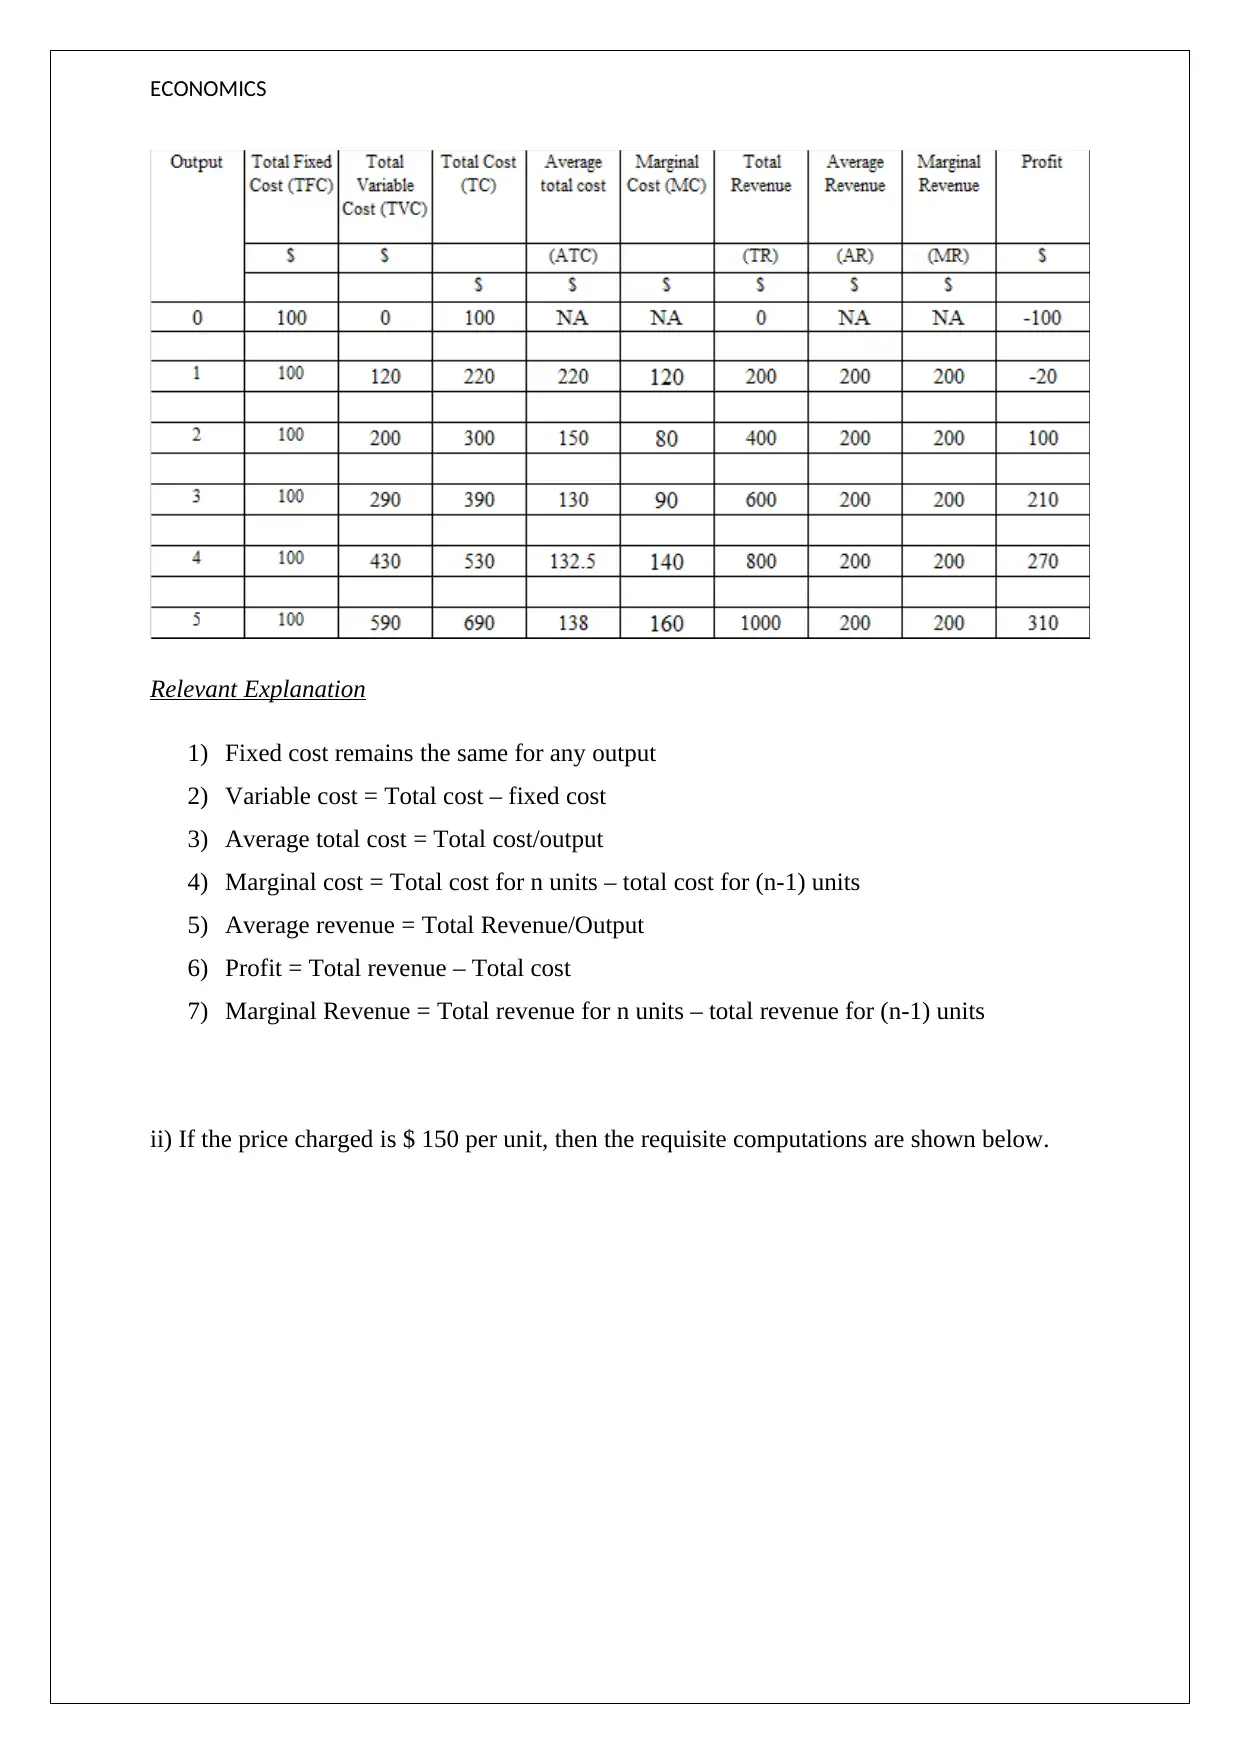
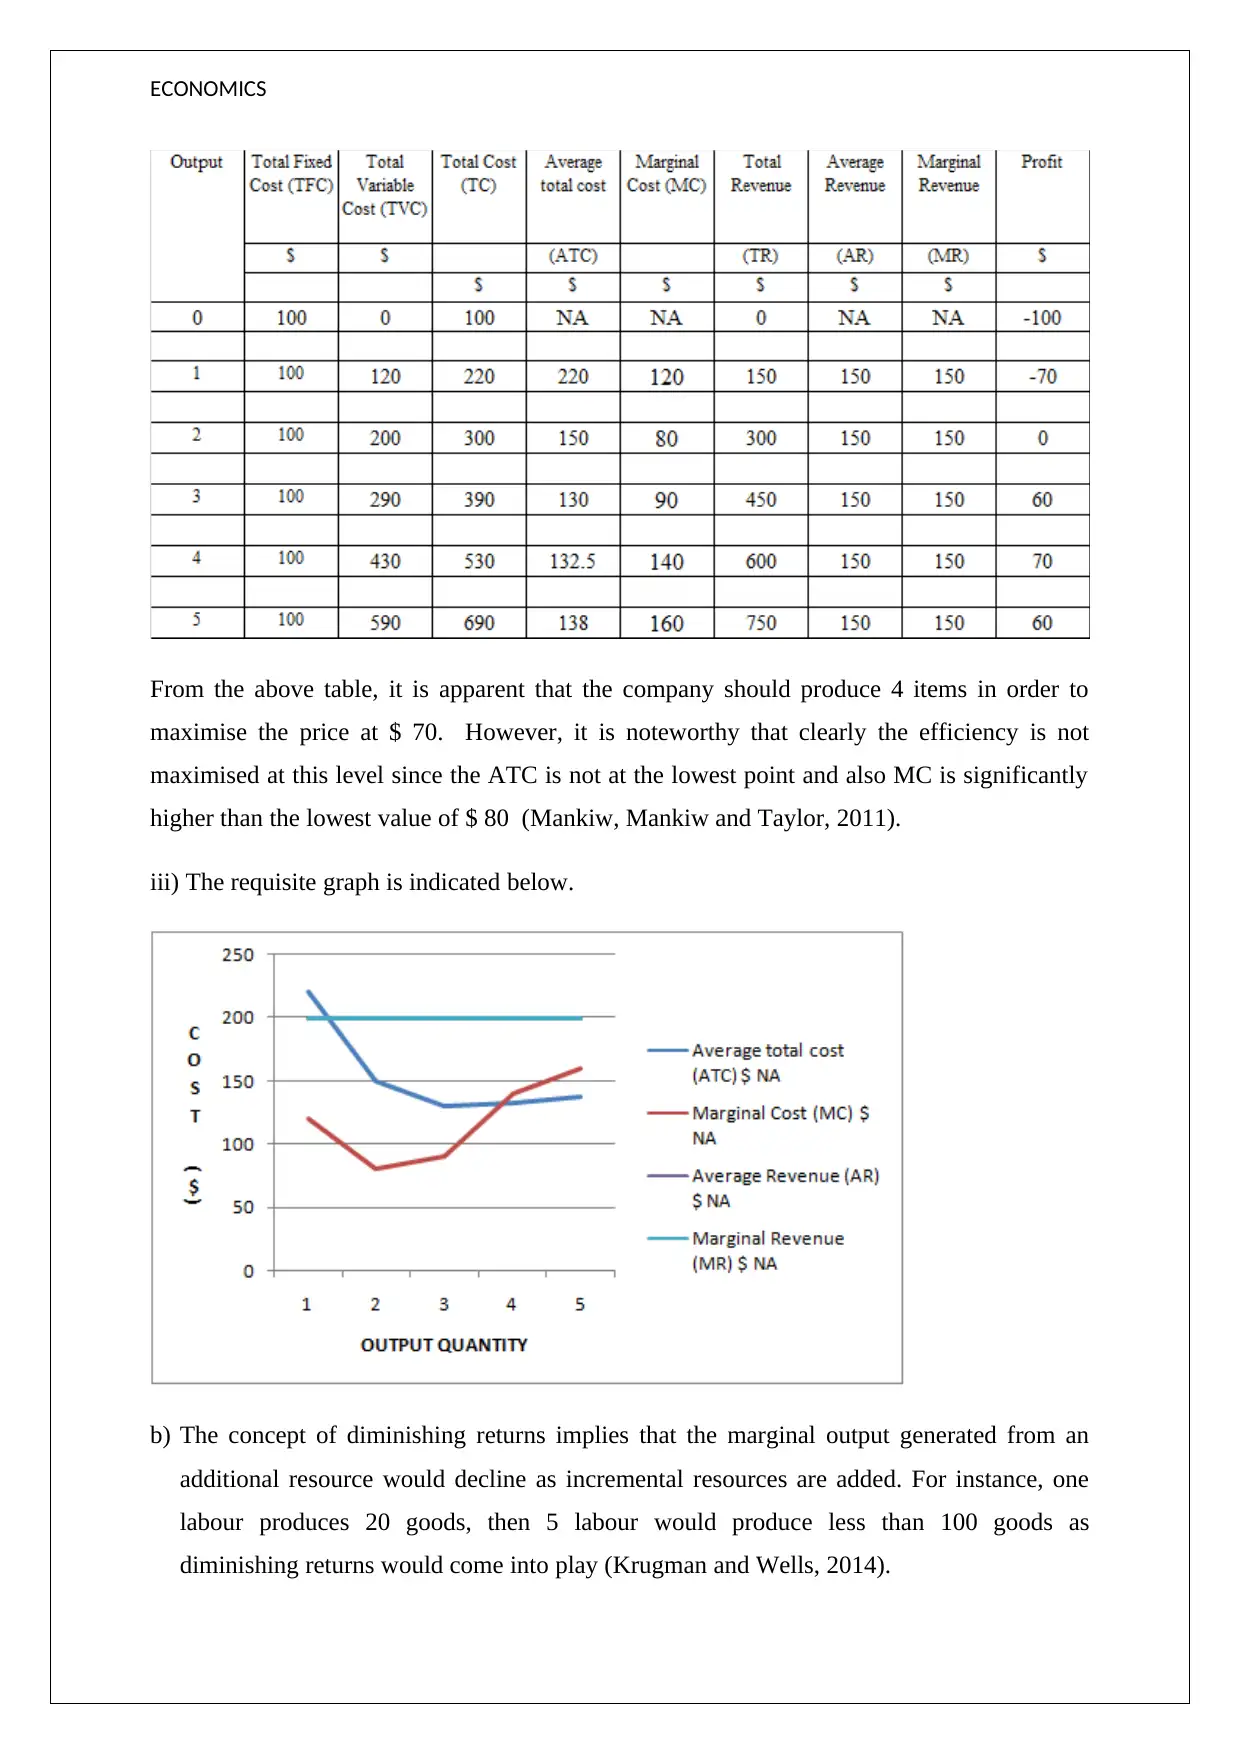
This assignment solution covers fundamental microeconomic concepts, including production possibility curves, scarcity, supply and demand analysis, elasticity, and cost analysis. It examines the impact of shifts in supply and demand on market equilibrium, consumer and producer surplus, and the effects of government policies like taxes. The solution also includes detailed explanations of elasticity calculations, cost curves, and profit maximization strategies for firms. Practical examples, such as the solar power industry and cigarette demand, illustrate the application of economic principles.
tabler-icon-diamond-filled.svg

Contribute Materials

Your contribution can guide someone’s learning journey. Share your documents today.
Document Page
ECONOMICS
STUDENT ID:
[Pick the date]
tabler-icon-diamond-filled.svg

Secure Best Marks with AI Grader

Need help grading? Try our AI Grader for instant feedback on your assignments.
Document Page
ECONOMICS
Question 1
a) i) The production possibility curve for Joan is indicated below.
ii) The shape of the PPC is not linear but outward sloping which is indicative of the
increasing opportunity cost. This implies that there is an increasing opportunity cost attached
for every incremental increase in the production of the a particular good. This opportunity
cost is in the form of decrease in the production of the other good (Arnold, 2015).
In the given case, to increase the grade from 0% to 20%, the opportunity cost is 5 hours per
week. However, in order to enhance the grade from 20% to 40%, the opportunity cost
increases to 10 hours per week. As the grade increases still higher, the opportunity cost still
increases which is reflected in PPC shape.
iii) If the opportunity cost of increasing the grade was constant, then the PPC would be linear
as highlighted below.
Document Page
ECONOMICS
The outwards sloping PPC is more likely shape since the opportunity cost does not remain
constant for incremental increases and same is reflected in this particular shape of PPC
(Mankiw, 2014).
iv) If the combination of grades and work is below the PPC indicated in 1a(i), then it implies
that Joan is not using her resources at 100% efficiency as a result of which the total output is
lower than at any point on the PPC which indicate maximum output possible given the
resources (Krugman and Wells, 2014).
v) In order to push beyond the current curve, there needs to be an improvement in resources
such as using technology as an aid to improve learning.. Additionally, seeking help from
friends, colleagues etc may also allow her to push beyond the current PPC (Nicholson and
Snyder, 2014).
b) With regards to scarcity, supply is just one aspect. Scarcity is caused when the demand is
greater than the supply. An additional factor is the price at which the underlying good is sold.
In this context, even though there has been a bumper crop, it is still possible that the demand
may still outstrip the supply at the market price. Also, it depends on other factors such as
global demand and supply as if there is global scarcity of wheat, a portion of the produce may
be diverted to exports, thus causing scarcity at home. Thus, solely on bumper production,
conclusions about scarcity should not be reached (Arnold, 2015).
Document Page
ECONOMICS
Question 2
a) Since the supply of solar power capacity could double hence, the supply curve would shift
as indicated below.
As indicated in the diagram above, there is a shift in supply curve from S1 to S2 owing to
which there is a drop in the equilibrium price from P1 to P2 in the short term. Additionally,
the equilibrium quantity has also increased from Q1 to Q2 (Mankiw, 2014).
b) Owing to doubling of capacity and falling prices as indicated above, over a period of time
the demand would increase which would lead to slight increase in the prices. This is
because the lowering of prices on account of higher supply will make solar energy more
competitive to other sources of power. This is indicated below (Nicholson and Snyder,
2014).
In the above diagram, there is a shift in the demand curve from D to D1 and hence the price
returns back to the original price while demand is retained at the higher level.
c) Coal Fired Power Electricity Industry
tabler-icon-diamond-filled.svg

Secure Best Marks with AI Grader

Need help grading? Try our AI Grader for instant feedback on your assignments.
Document Page
ECONOMICS
The relevant demand supply curve is indicated below.
It is apparent that a tax is levied on the suppliers and hence there is an upward shift in the
supply curve. The impact of this would be that there would be an increase in the equilibrium
price of coal based electricity while at the same time a decrease in the equilibrium quantity
(Krugman and Wells, 2014).
Owing to higher price of the coal based power, the consumers would shift to solar based
power which is one of the substitutes. As a result, the demand of solar power would increase
as reflected in the following demand curve graph.
The demand graph has shifted from D1 originally now to D2 owing to increased demand of
solar energy leading to higher equilibrium price and higher equilibrium quantity in the short
term (Pindyck and Rubinfeld, 2015).
Document Page
ECONOMICS
Question 3
a) The concept of producer and consumer surplus can be explained with the help of the
following diagram.
Consumer Surplus – It is the difference between the maximum amount that the consumer is
willing to pay to buy a given product and the current market price. In the above diagram,
using the demand curve, it is apparent that the maximum price that can be charged is denoted
by point C while the market price being currently charged is denoted by point B. The
difference highlighted in blue indicates consumer surplus (Arnold, 2015).
Producer Surplus - It is the difference between the minimum amount that the producer is
willing to take to sell a given product and the current market price. In the above diagram,
using the demand curve, it is apparent that the minimum price that can be charged is denoted
by point A while the market price being currently charged is denoted by point B. The
difference highlighted in red indicates producer surplus (Mankiw, 2014).
b) The requisite graph is indicated below.
Document Page
ECONOMICS
It is apparent that equilibrium price has decreased and equilibrium quantity has increased. As
a result, there would be an increase in the consumer surplus owing to the higher difference
between maximum price (determined by demand curve which remains constant) and the
market price (which has decreased). Also, the total area highlighting consumer surplus would
increase on account of increase in equilibrium quantity (Pindyck and Rubinfeld, 2015).
With regards to producer surplus, there is a slight decrease owing to lower difference in the
minimum price and the market price. A part of this is compensated from the increased
quantity but still there is a decrease in producer surplus (Krugman and Wells, 2014).
c) This is a positive statement considering the fact that lower taxes would imply higher
profitability for the businesses which would lead to higher production levels and output
levels in order to maximise the profits. This in turn would lead to incremental demand for
labour which would lead to higher employment and better wages. Thus, on one hand lower
business taxes would lead to higher profitability for corporate and simultaneously it would
lead to better wages for workers coupled with higher employment (Mankiw, Mankiw and
Taylor, 2011).
Question 4
a) The completed table is indicated below.
tabler-icon-diamond-filled.svg

Paraphrase This Document

Need a fresh take? Get an instant paraphrase of this document with our AI Paraphraser
Document Page
ECONOMICS
Explanations:
1) Revenue = Price * Quantity Demanded
2) Percent change in price = [(P2-P1)/(P2+P1)/2]*100
3) Percent change in quantity = [(Q2-Q1)/(Q2+Q1)/2]*100
4) Elasticity value = Percent change in quantity/Percent change in price
5) If magnitude of elasticity less than 1, then inelastic or else elastic.
b) The demand elasticity of doughnuts would not be the same in summers as compared to
winters. It is expected to be more elastic as in summers people would prefer to avoid food
products that are hot. As a result, there would be more availability of alternatives in
summers as compared to winters and hence higher elasticity (Mankiw, 2014).
c) Price elasticity of cigarettes would be expected to inelastic and hence lesser than 1 in
magnitude. This is because most of the consumers of cigarettes are addicted and hence
cannot quit smoking despite the rising prices. Also, people consuming a particular brand
may not like to shift to other brands (Arnold, 2015).
Question 5
a) I) The completed table is shown below.
Document Page
ECONOMICS
Relevant Explanation
1) Fixed cost remains the same for any output
2) Variable cost = Total cost – fixed cost
3) Average total cost = Total cost/output
4) Marginal cost = Total cost for n units – total cost for (n-1) units
5) Average revenue = Total Revenue/Output
6) Profit = Total revenue – Total cost
7) Marginal Revenue = Total revenue for n units – total revenue for (n-1) units
ii) If the price charged is $ 150 per unit, then the requisite computations are shown below.
Document Page
ECONOMICS
From the above table, it is apparent that the company should produce 4 items in order to
maximise the price at $ 70. However, it is noteworthy that clearly the efficiency is not
maximised at this level since the ATC is not at the lowest point and also MC is significantly
higher than the lowest value of $ 80 (Mankiw, Mankiw and Taylor, 2011).
iii) The requisite graph is indicated below.
b) The concept of diminishing returns implies that the marginal output generated from an
additional resource would decline as incremental resources are added. For instance, one
labour produces 20 goods, then 5 labour would produce less than 100 goods as
diminishing returns would come into play (Krugman and Wells, 2014).
tabler-icon-diamond-filled.svg

Secure Best Marks with AI Grader

Need help grading? Try our AI Grader for instant feedback on your assignments.
Document Page
ECONOMICS
Due to diminishing returns the marginal product would lower as every additional resource
would produce lower incremental output than previous addition. The total output would
continue to go up unless the marginal product becomes negative however the rate of increase
of total output would slow down. The marginal cost would start increasing as higher cost
would be required for producing additional good owing to lowering efficiency (Arnold,
2015).
Document Page
ECONOMICS
References
Arnold, A.R. (2015) Microeconomics. 9th ed. Sydney: Cengage Learning.
Mankiw, G. (2014) Microeconomics. 6th ed. London: Worth Publishers.
Mankiw, G.N., Mankiw, G.N. and Taylor, P. (2011) Microeconomics. 5th ed. Sydney:
Cengage Learning.
Nicholson, W. and Snyder, C. (2014) Fundamentals of Microeconomics.11th ed. New York:
Cengage Learning.
Krugman, P and Wells, R. (2014) Microeconomics. 2nd ed. London: Worth Publishers.
Pindyck, R and Rubinfeld, D. (2015) Microeconomics. 5th ed. London: Prentice-Hall
Publications.
chevron_up_icon
1 out of 12
circle_padding
hide_on_mobile
zoom_out_icon
logo.png

Your All-in-One AI-Powered Toolkit for Academic Success.

Available 24*7 on WhatsApp / Email

[object Object]