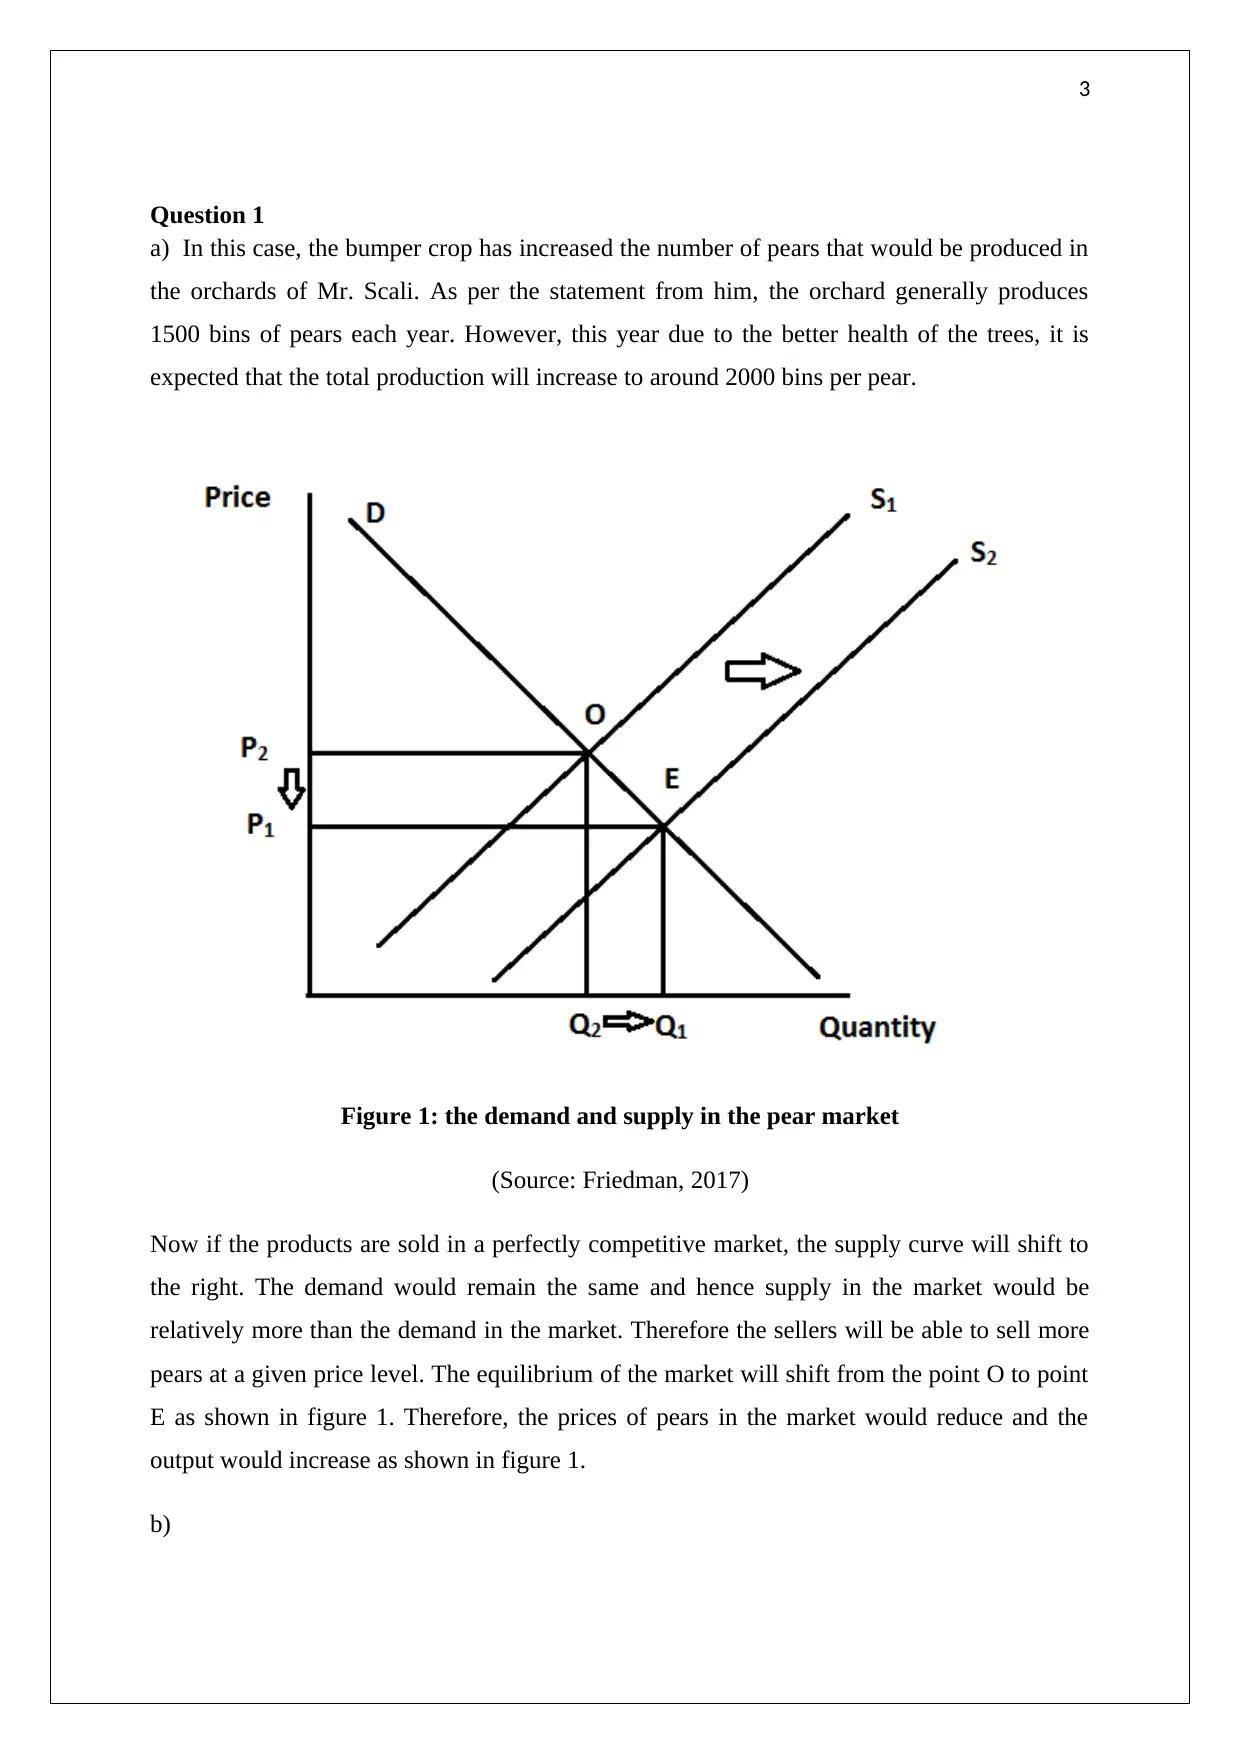
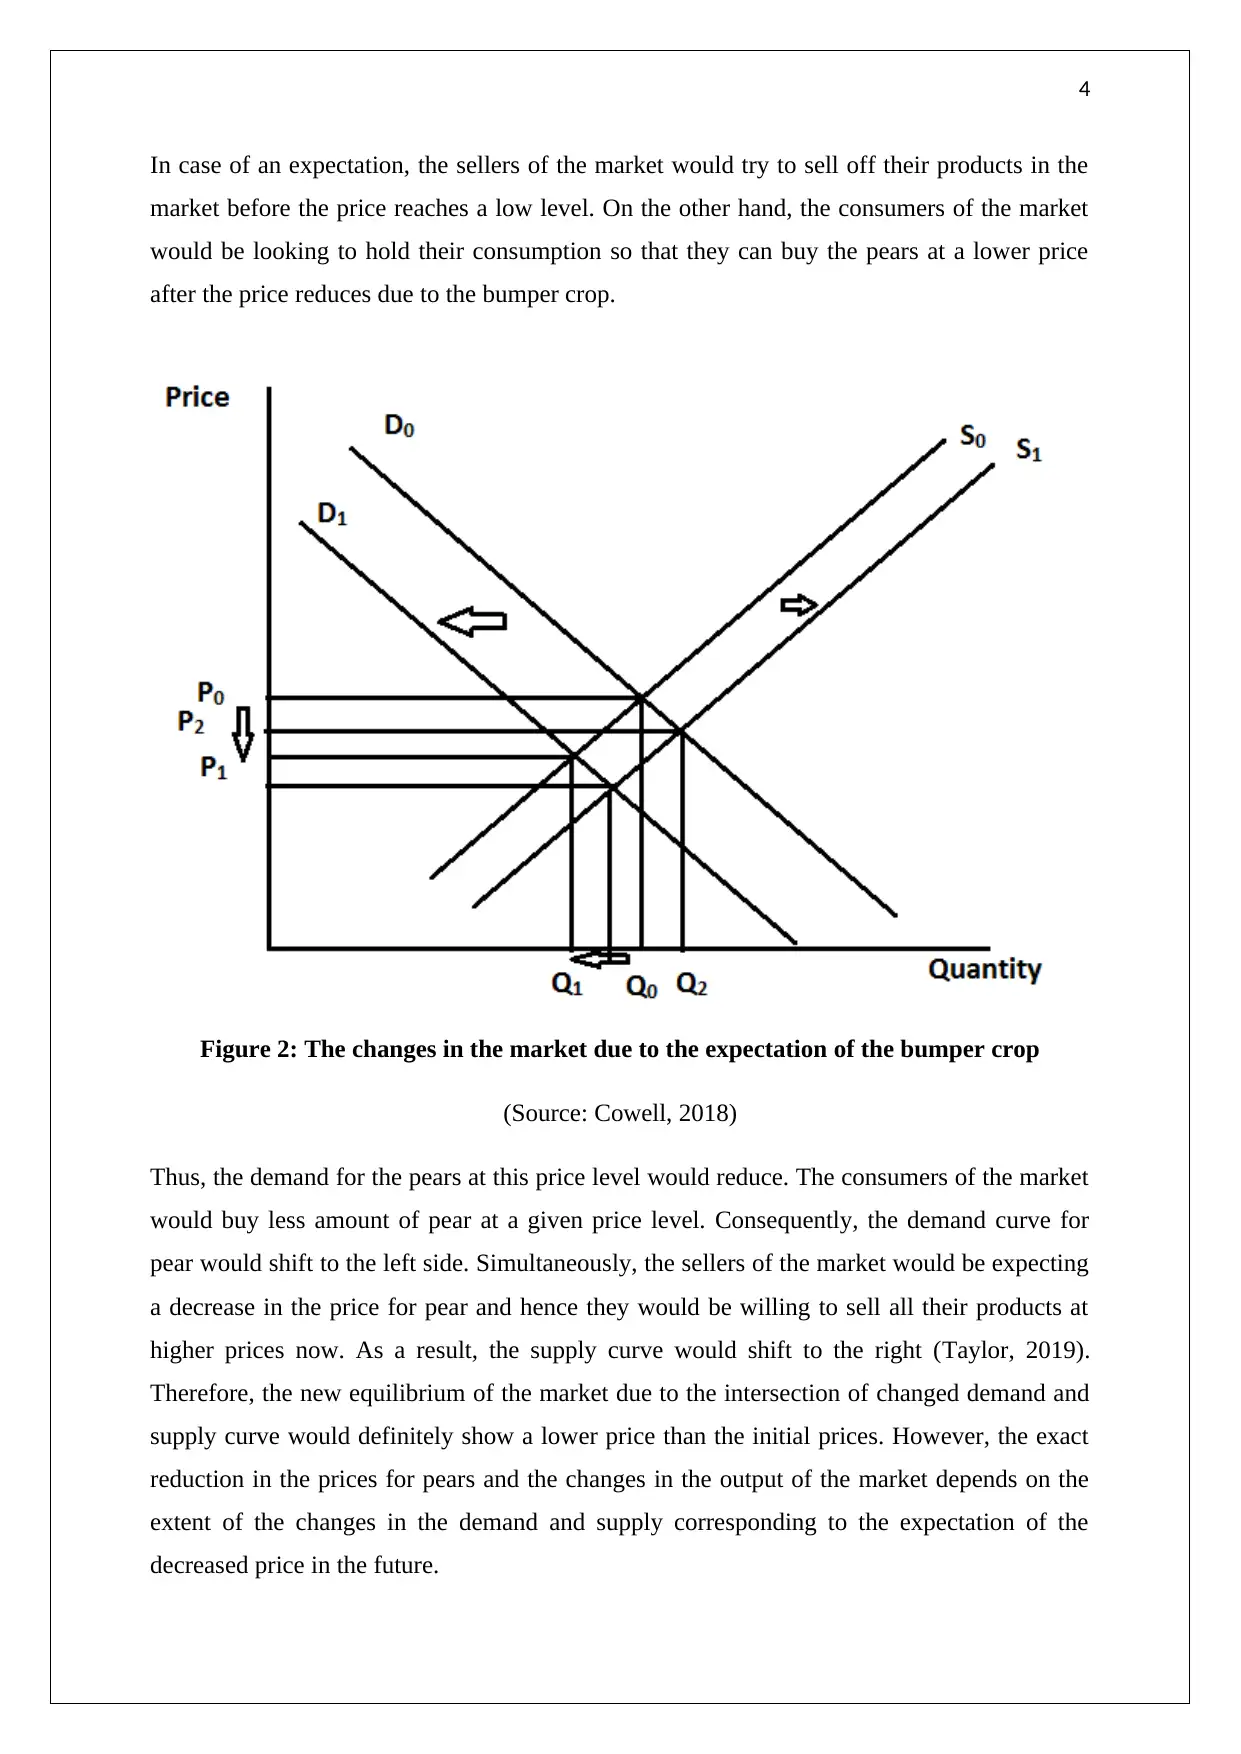
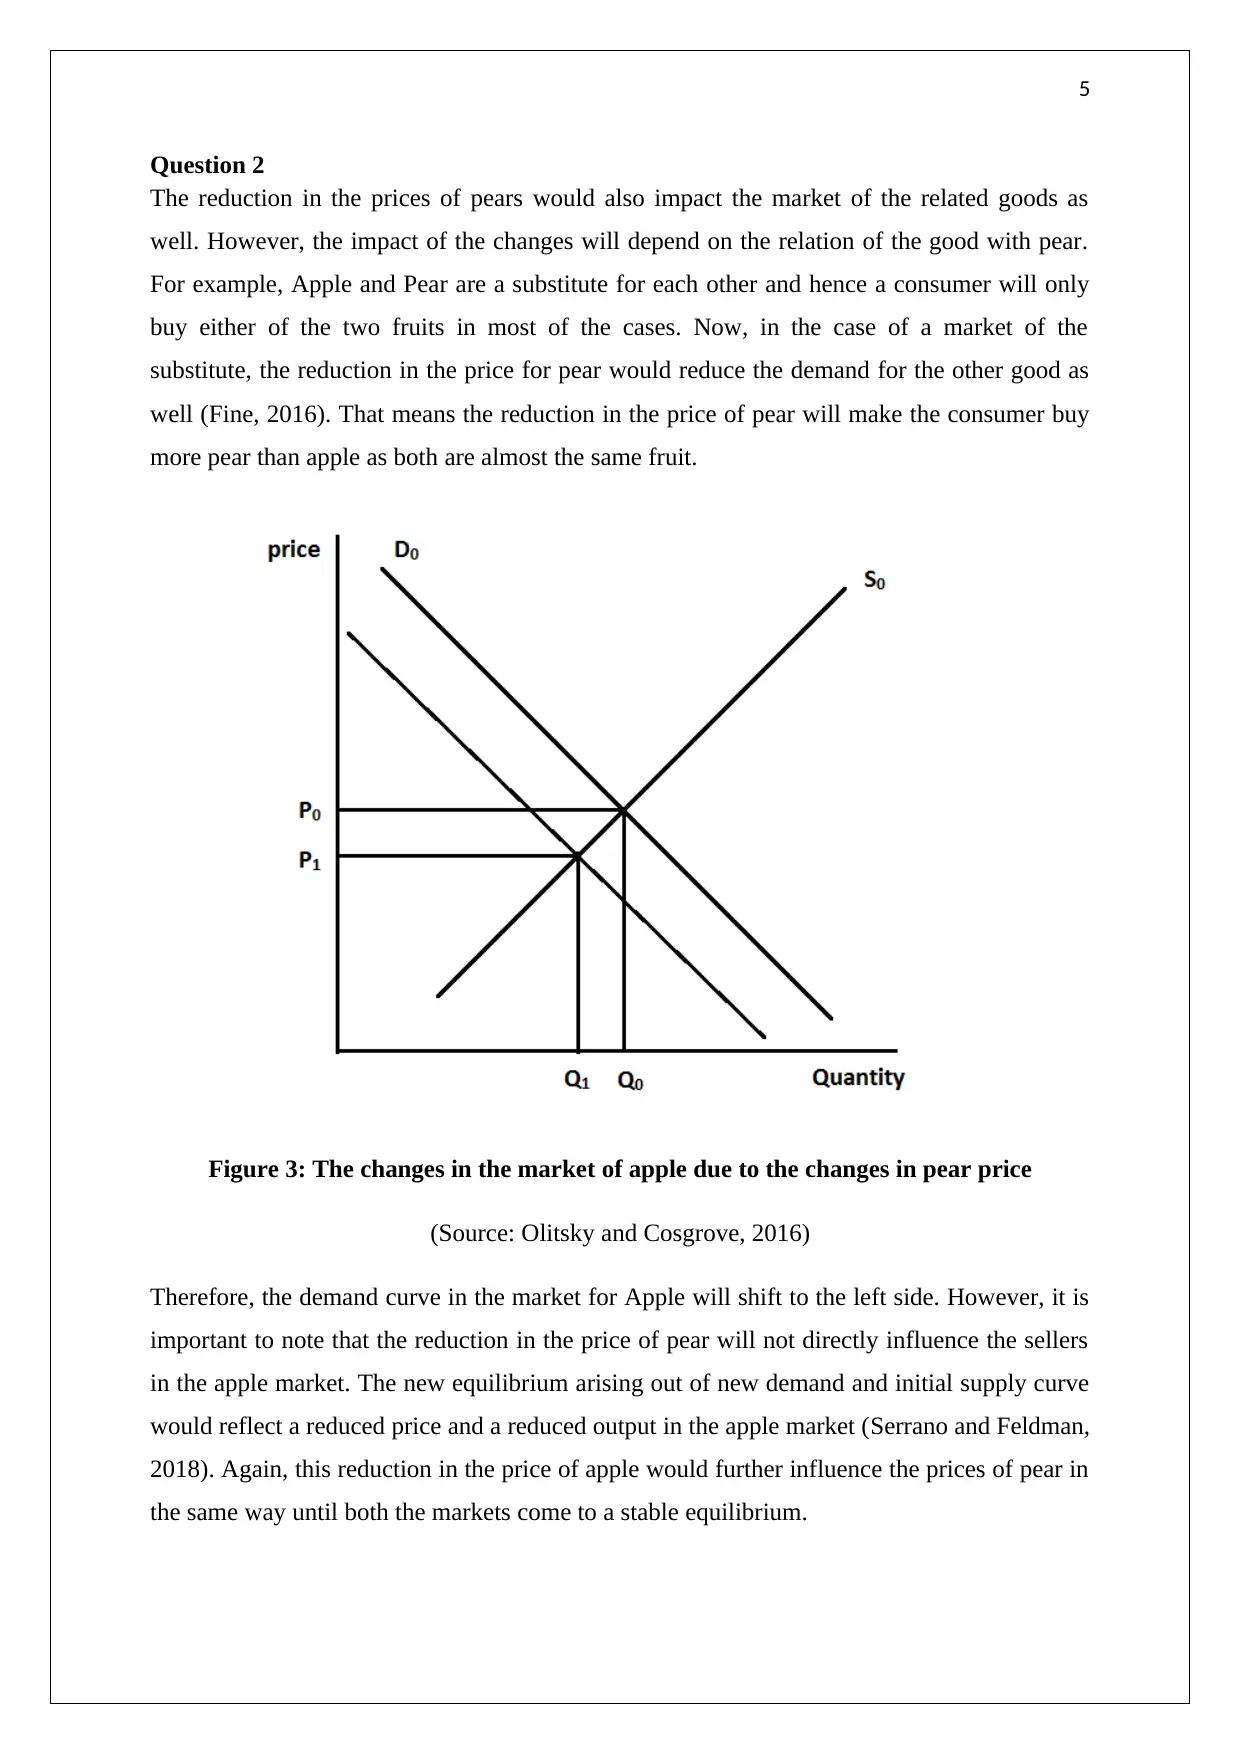
ECO11 Principles of Economics: Analyzing Market Forces and Impacts

Verified

Added on  2023/04/23

|9
|1653
|257
Homework Assignment
AI Summary
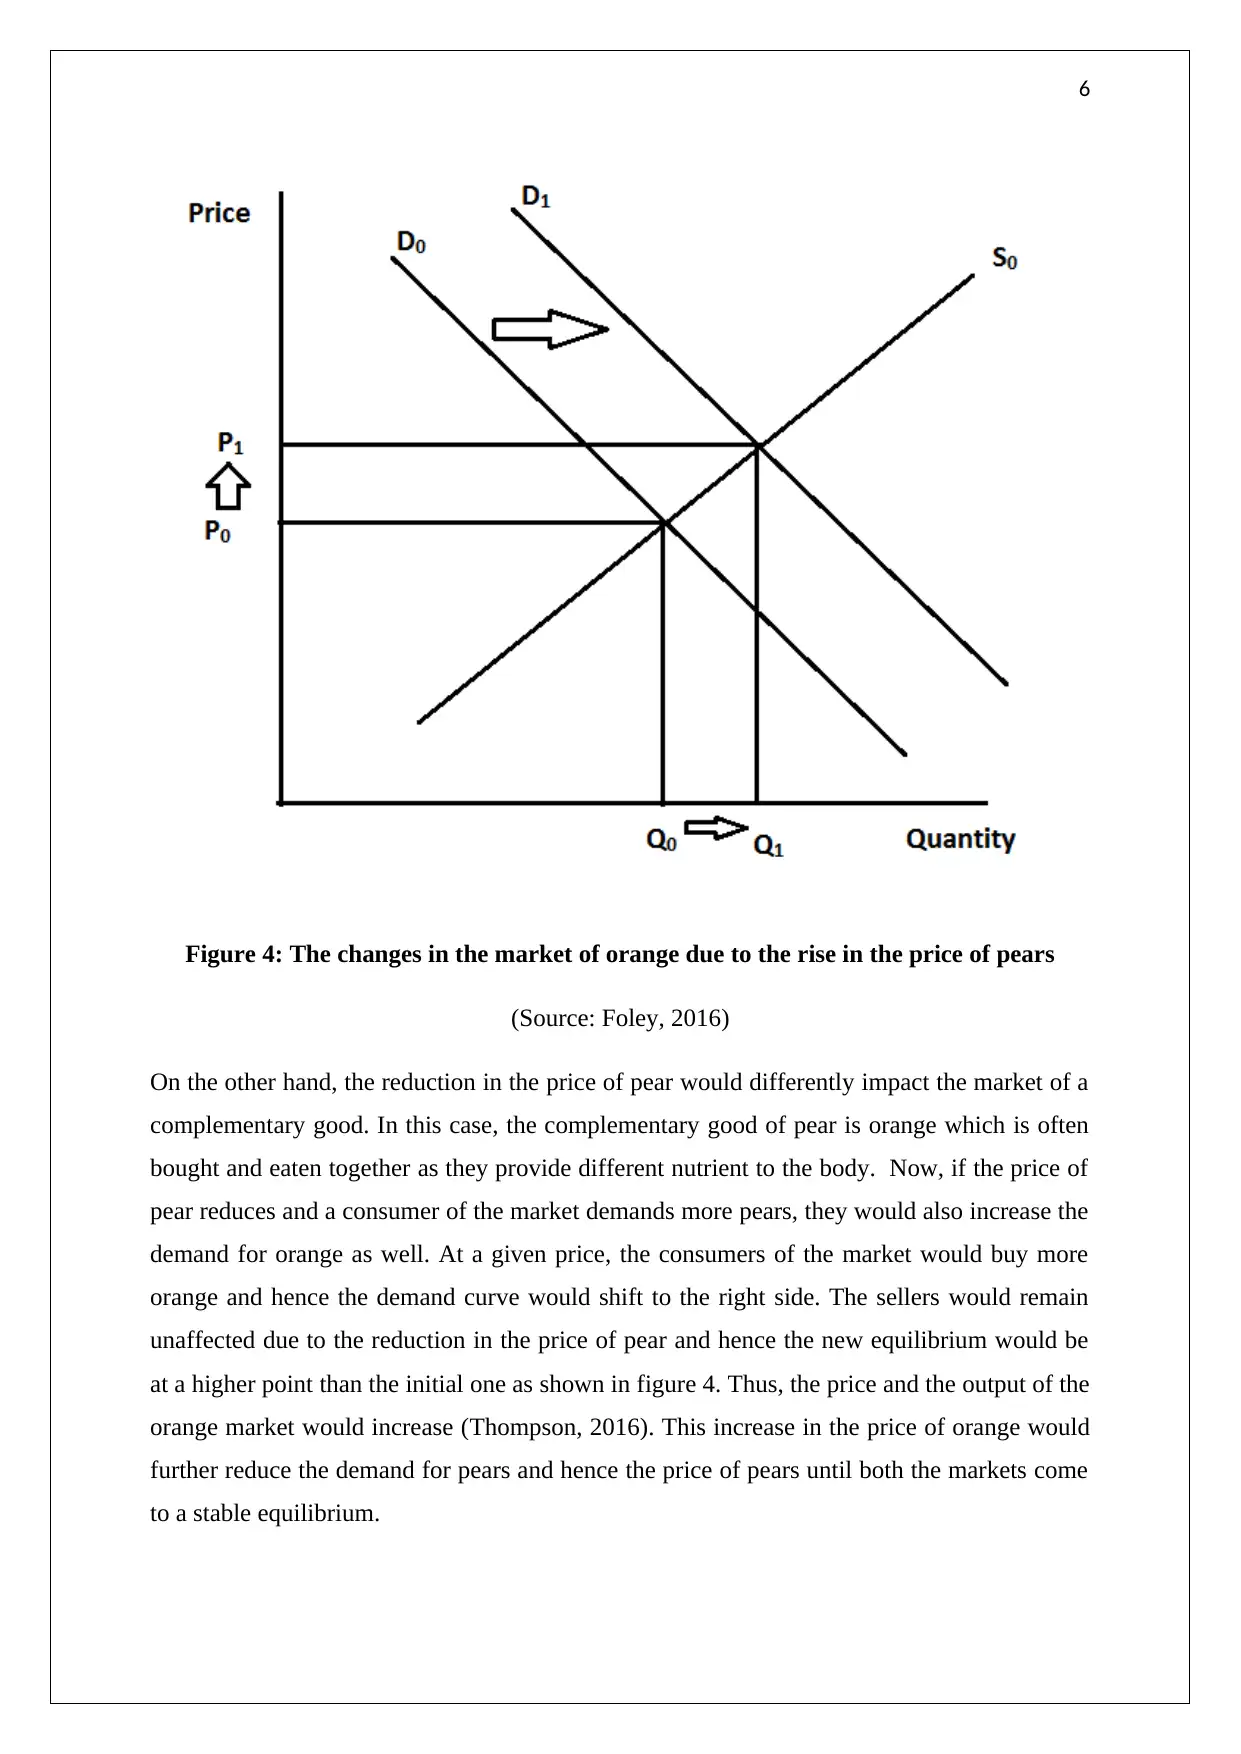
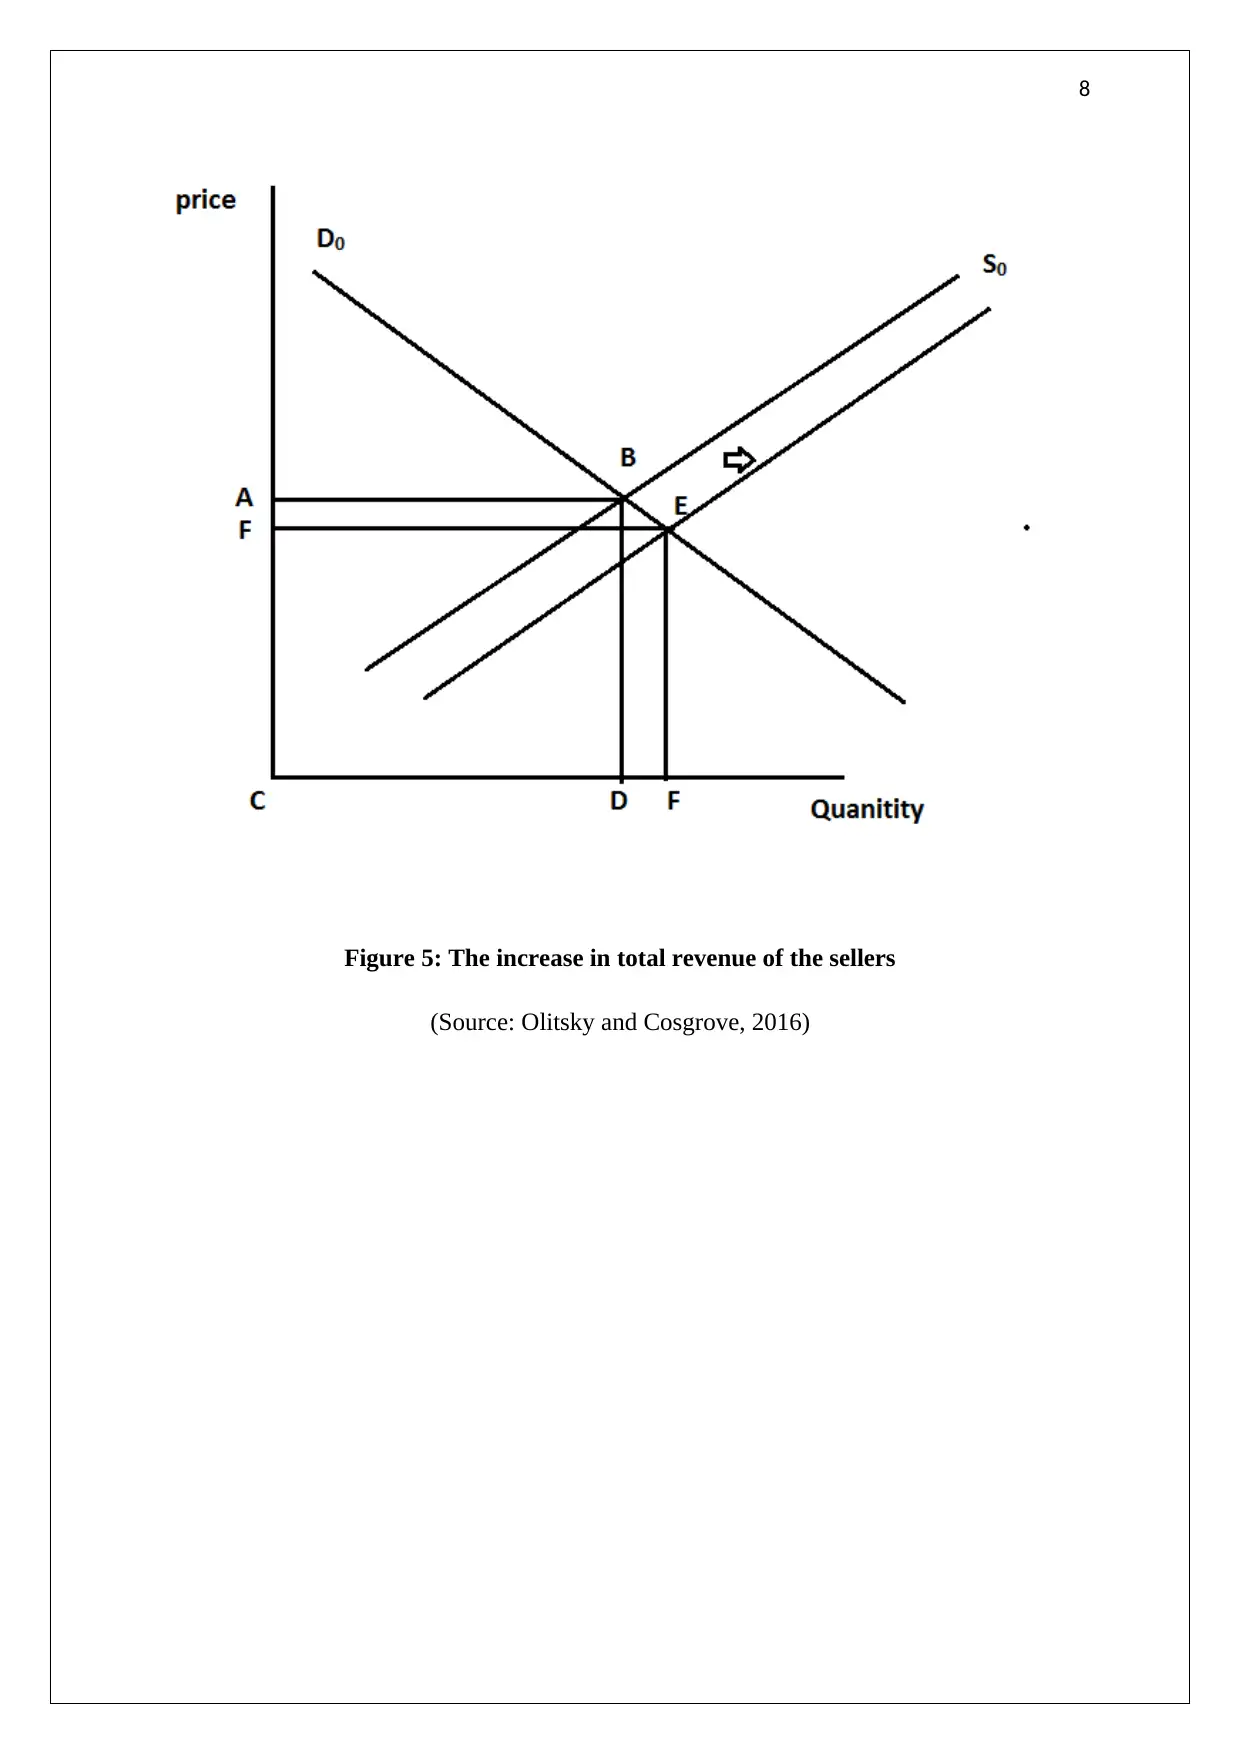
This economics assignment delves into the principles of supply and demand, analyzing market equilibrium shifts caused by events like bumper crops and consumer expectations. It examines how changes in the price of one good (e.g., pears) impact the markets for related goods, specifically substitutes (apples) and complements (oranges). Furthermore, the assignment discusses the factors influencing the price elasticity of demand for a product like pears, considering the availability of substitutes, the proportion of income spent, and the variety of uses. It explains how the elasticity of demand affects total revenue when prices change, demonstrating that for elastic goods, a price decrease leads to a proportionally larger increase in quantity demanded, ultimately increasing total revenue. Desklib offers a wealth of similar solved assignments and study materials to aid students in their academic pursuits.
Document Page
1
ECONOMICS ASSIGNMENT
tabler-icon-diamond-filled.svg

Paraphrase This Document

Need a fresh take? Get an instant paraphrase of this document with our AI Paraphraser
Document Page
2
Table of contents
Question 1..................................................................................................................................3
Question 2..................................................................................................................................5
Question 3..................................................................................................................................7
Reference....................................................................................................................................9
Document Page
3
Question 1
a) In this case, the bumper crop has increased the number of pears that would be produced in
the orchards of Mr. Scali. As per the statement from him, the orchard generally produces
1500 bins of pears each year. However, this year due to the better health of the trees, it is
expected that the total production will increase to around 2000 bins per pear.
Figure 1: the demand and supply in the pear market
(Source: Friedman, 2017)
Now if the products are sold in a perfectly competitive market, the supply curve will shift to
the right. The demand would remain the same and hence supply in the market would be
relatively more than the demand in the market. Therefore the sellers will be able to sell more
pears at a given price level. The equilibrium of the market will shift from the point O to point
E as shown in figure 1. Therefore, the prices of pears in the market would reduce and the
output would increase as shown in figure 1.
b)
Document Page
4
In case of an expectation, the sellers of the market would try to sell off their products in the
market before the price reaches a low level. On the other hand, the consumers of the market
would be looking to hold their consumption so that they can buy the pears at a lower price
after the price reduces due to the bumper crop.
Figure 2: The changes in the market due to the expectation of the bumper crop
(Source: Cowell, 2018)
Thus, the demand for the pears at this price level would reduce. The consumers of the market
would buy less amount of pear at a given price level. Consequently, the demand curve for
pear would shift to the left side. Simultaneously, the sellers of the market would be expecting
a decrease in the price for pear and hence they would be willing to sell all their products at
higher prices now. As a result, the supply curve would shift to the right (Taylor, 2019).
Therefore, the new equilibrium of the market due to the intersection of changed demand and
supply curve would definitely show a lower price than the initial prices. However, the exact
reduction in the prices for pears and the changes in the output of the market depends on the
extent of the changes in the demand and supply corresponding to the expectation of the
decreased price in the future.
tabler-icon-diamond-filled.svg

Paraphrase This Document

Need a fresh take? Get an instant paraphrase of this document with our AI Paraphraser
Document Page
5
Question 2
The reduction in the prices of pears would also impact the market of the related goods as
well. However, the impact of the changes will depend on the relation of the good with pear.
For example, Apple and Pear are a substitute for each other and hence a consumer will only
buy either of the two fruits in most of the cases. Now, in the case of a market of the
substitute, the reduction in the price for pear would reduce the demand for the other good as
well (Fine, 2016). That means the reduction in the price of pear will make the consumer buy
more pear than apple as both are almost the same fruit.
Figure 3: The changes in the market of apple due to the changes in pear price
(Source: Olitsky and Cosgrove, 2016)
Therefore, the demand curve in the market for Apple will shift to the left side. However, it is
important to note that the reduction in the price of pear will not directly influence the sellers
in the apple market. The new equilibrium arising out of new demand and initial supply curve
would reflect a reduced price and a reduced output in the apple market (Serrano and Feldman,
2018). Again, this reduction in the price of apple would further influence the prices of pear in
the same way until both the markets come to a stable equilibrium.
Document Page
6
Figure 4: The changes in the market of orange due to the rise in the price of pears
(Source: Foley, 2016)
On the other hand, the reduction in the price of pear would differently impact the market of a
complementary good. In this case, the complementary good of pear is orange which is often
bought and eaten together as they provide different nutrient to the body. Now, if the price of
pear reduces and a consumer of the market demands more pears, they would also increase the
demand for orange as well. At a given price, the consumers of the market would buy more
orange and hence the demand curve would shift to the right side. The sellers would remain
unaffected due to the reduction in the price of pear and hence the new equilibrium would be
at a higher point than the initial one as shown in figure 4. Thus, the price and the output of the
orange market would increase (Thompson, 2016). This increase in the price of orange would
further reduce the demand for pears and hence the price of pears until both the markets come
to a stable equilibrium.
Document Page
7
Question 3
a)
There are number factors that determine the price elasticity of demand for a product. First and
the important one is the number of substitute of that product. Pear is a fruit that is somewhat
close to apple in appearance and the composition. Pears provide almost the same nutrients
provided by Apple. Apart from that, there are many other fruits in the market which meets the
demand of the customer very closely as pear does. Therefore, in terms of the substitute
available the demand for pears is much elastic. Now, as the price of a unit of pear is very low
compared to the complete salary of an average consumer, the changes in the price of pear
influence the demand by a bit (Stoneman, Bartoloni and Baussola, 2018). Therefore, in terms
of the share of income spent on the product the demand for pear inelastic. Now, the last factor
that determines the elasticity of the product is the number of uses of the product. Pear is a
fruit which is also used in many of the dishes as well; however, other similar fruits can also
be used in place of pears in these cases. Therefore, depending on the three factors that
determine the elasticity of demand, the demand for pear is slightly elastic. That means the
responsiveness of the change in the demand for pears is slightly high corresponding to the
change in the price of pears.
b)
Now, as the demand for the pears is elastic, the responsiveness of the quantity demanded
following the changes in price is proportionately more. For example, for a 5% increase in the
price of the product, the demand would reduce by more than 5%. Now, in the case of pear,
the reduction in the price would increase the demand for pear. The percentage increase in the
quantity demand for pear would be more than the percentage decrease in the price of pears as
the demand for pears is elastic. Therefore, at this reduced price more and more consumers of
the market would buy pears from the market and the total revenue, which is the product of
price and the quantity sold, would increase (Guiso, 2017). Figure 5 shows that as the price
level reduces the revenue changes from the rectangle ABCD to FECD where the area of
FECD is more than ABCD.
Total revenue= price * quantity
Price↓* quantity ↑↑= Total revenue↑↑
tabler-icon-diamond-filled.svg

Paraphrase This Document

Need a fresh take? Get an instant paraphrase of this document with our AI Paraphraser
Document Page
8
Figure 5: The increase in total revenue of the sellers
(Source: Olitsky and Cosgrove, 2016)
Document Page
9
Reference
Cowell, F., 2018. Microeconomics: principles and analysis. Oxford University Press.
Fine, B., 2016. Microeconomics. University of Chicago Press Economics Books.
Foley, D.K., 2016. Keynes’ Microeconomics of Output and Labor Markets. In Dynamic
Modeling, Empirical Macroeconomics, and Finance (pp. 183-194). Springer, Cham.
Friedman, L.S., 2017. The microeconomics of public policy analysis. Princeton University
Press.
Guiso, L., 2017. The Microeconomics of Trust. Social Economics: Current and Emerging
Avenues, p.109.
Olitsky, N.H. and Cosgrove, S.B., 2016. The better blend? Flipping the principles of
microeconomics classroom. International Review of Economics Education, 21, pp.1-11.
Serrano, R. and Feldman, A.M., 2018. A short course in intermediate microeconomics with
calculus. Cambridge University Press.
Stoneman, P., Bartoloni, E. and Baussola, M., 2018. The Microeconomics of Product
Innovation. Oxford University Press.
Taylor, J.E., 2019. Deconstructing the Monolith: The Microeconomics of the National
Industrial Recovery Act. University of Chicago Press.
Thompson, G.E., 2016. Microeconomics: A Computational Approach: A Computational
Approach. Routledge.
chevron_up_icon
1 out of 9
circle_padding
hide_on_mobile
zoom_out_icon
[object Object]