Semester 2 ECO3018 Financial Economics Assignment Solution
VerifiedAdded on 2022/11/28
|12
|3219
|437
Homework Assignment
AI Summary
This document presents a comprehensive solution to an ECO3018 Financial Economics assignment. The solution addresses various financial concepts, including portfolio management, calculation of standard deviation, expected rate of return, and the application of the Capital Asset Pricing Model (CAPM). It analyzes bond valuation, including bond value at maturity, realized coupon yield, and yield to maturity. The assignment further delves into option pricing, exploring put-call parity, future pricing, and the binomial option pricing model. The solution also covers Sharpe ratios and investment strategies, providing a detailed breakdown of each question with relevant formulas, calculations, and explanations to facilitate a thorough understanding of the subject matter.
ECO3018 – FINANCIAL
ECONOMICS
ECONOMICS
Paraphrase This Document
Need a fresh take? Get an instant paraphrase of this document with our AI Paraphraser

TABLE OF CONTENTS
INTRODUCTION...........................................................................................................................3
QUESTION 1...................................................................................................................................3
QUESTION 2...................................................................................................................................3
QUESTION 3...................................................................................................................................4
QUESTION 4...................................................................................................................................4
QUESTION 5...................................................................................................................................4
QUESTION 6...................................................................................................................................4
QUESTION 7...................................................................................................................................4
QUESTION 8...................................................................................................................................4
QUESTION 9...................................................................................................................................4
QUESTION 10.................................................................................................................................4
QUESTION 11.................................................................................................................................5
QUESTION 12.................................................................................................................................5
QUESTION 13.................................................................................................................................5
QUESTION 14.................................................................................................................................6
CONCLUSION................................................................................................................................9
REFERENCES..............................................................................................................................10
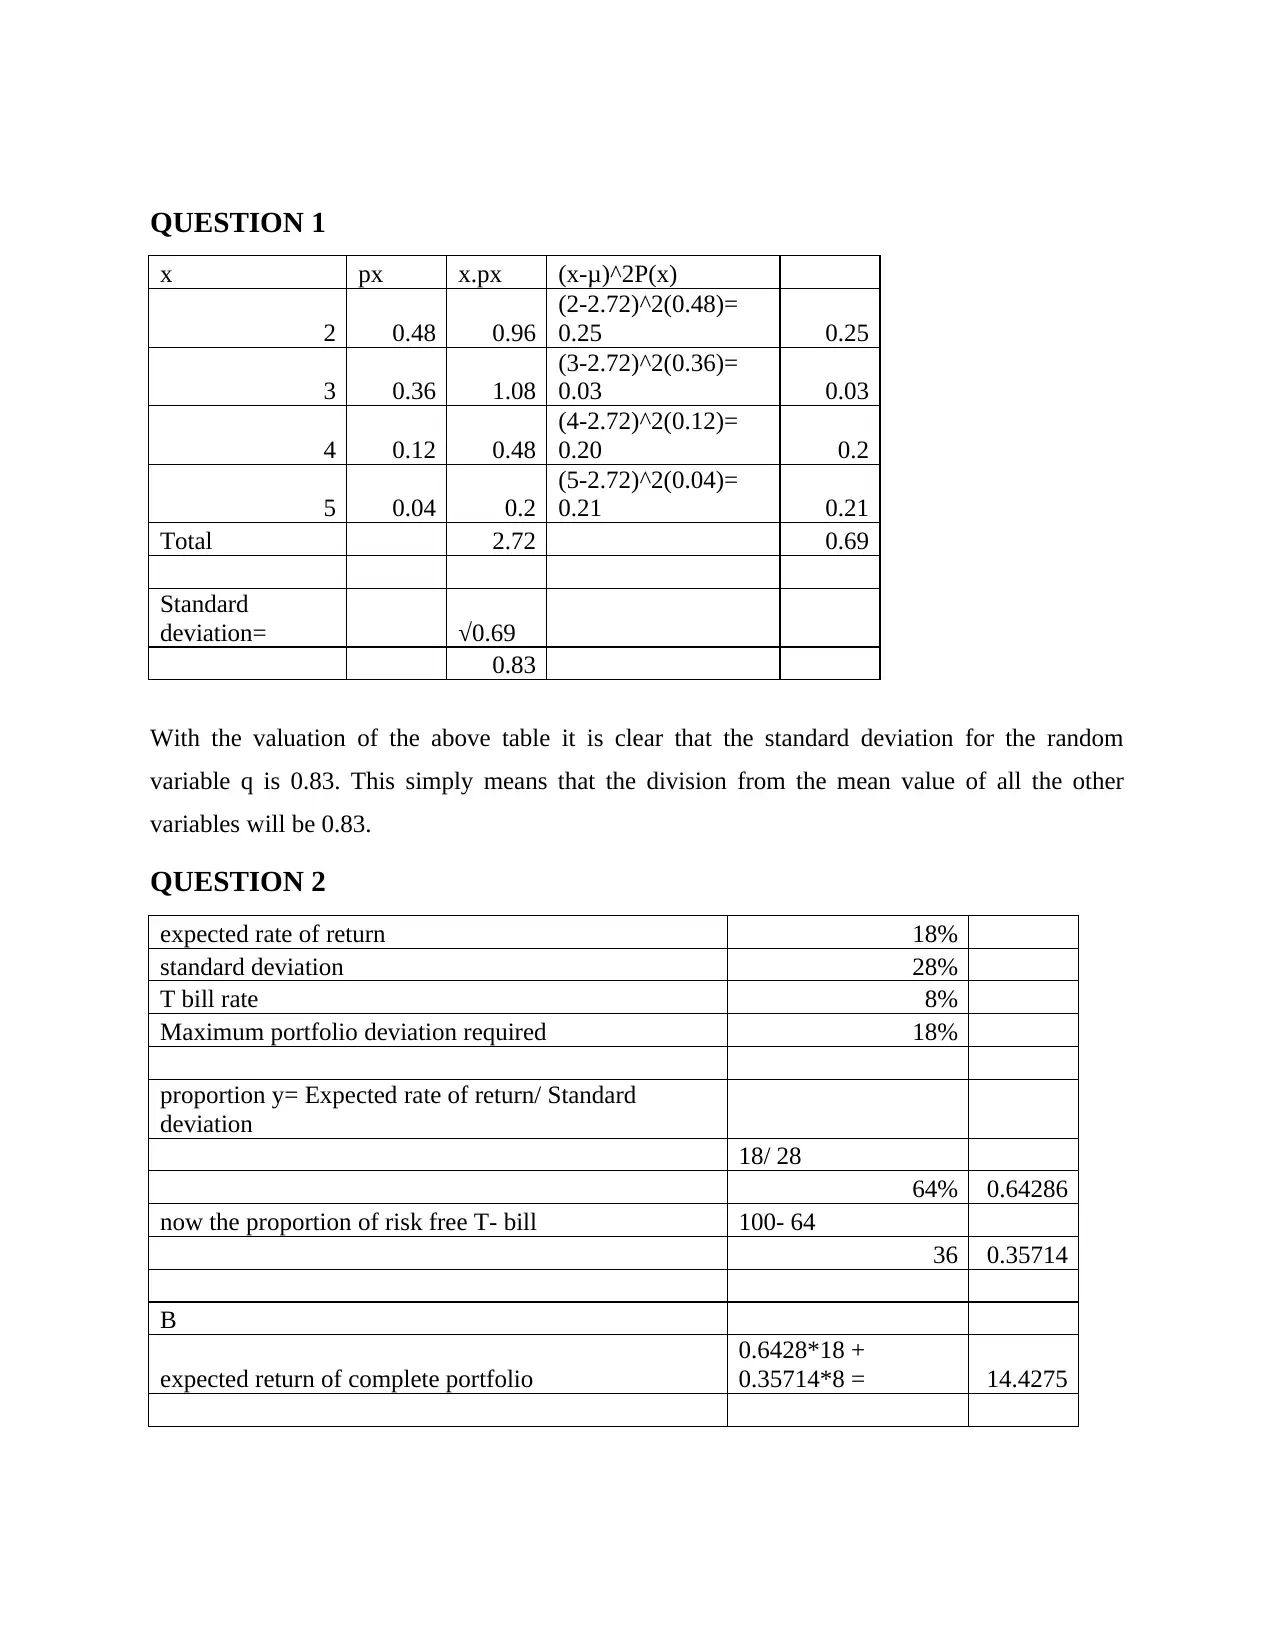
QUESTION 1
x px x.px (x-μ)^2P(x)
2 0.48 0.96
(2-2.72)^2(0.48)=
0.25 0.25
3 0.36 1.08
(3-2.72)^2(0.36)=
0.03 0.03
4 0.12 0.48
(4-2.72)^2(0.12)=
0.20 0.2
5 0.04 0.2
(5-2.72)^2(0.04)=
0.21 0.21
Total 2.72 0.69
Standard
deviation= √0.69
0.83
With the valuation of the above table it is clear that the standard deviation for the random
variable q is 0.83. This simply means that the division from the mean value of all the other
variables will be 0.83.
QUESTION 2
expected rate of return 18%
standard deviation 28%
T bill rate 8%
Maximum portfolio deviation required 18%
proportion y= Expected rate of return/ Standard
deviation
18/ 28
64% 0.64286
now the proportion of risk free T- bill 100- 64
36 0.35714
B
expected return of complete portfolio
0.6428*18 +
0.35714*8 = 14.4275
⊘ This is a preview!⊘
Do you want full access?
Subscribe today to unlock all pages.
Trusted by 1+ million students worldwide
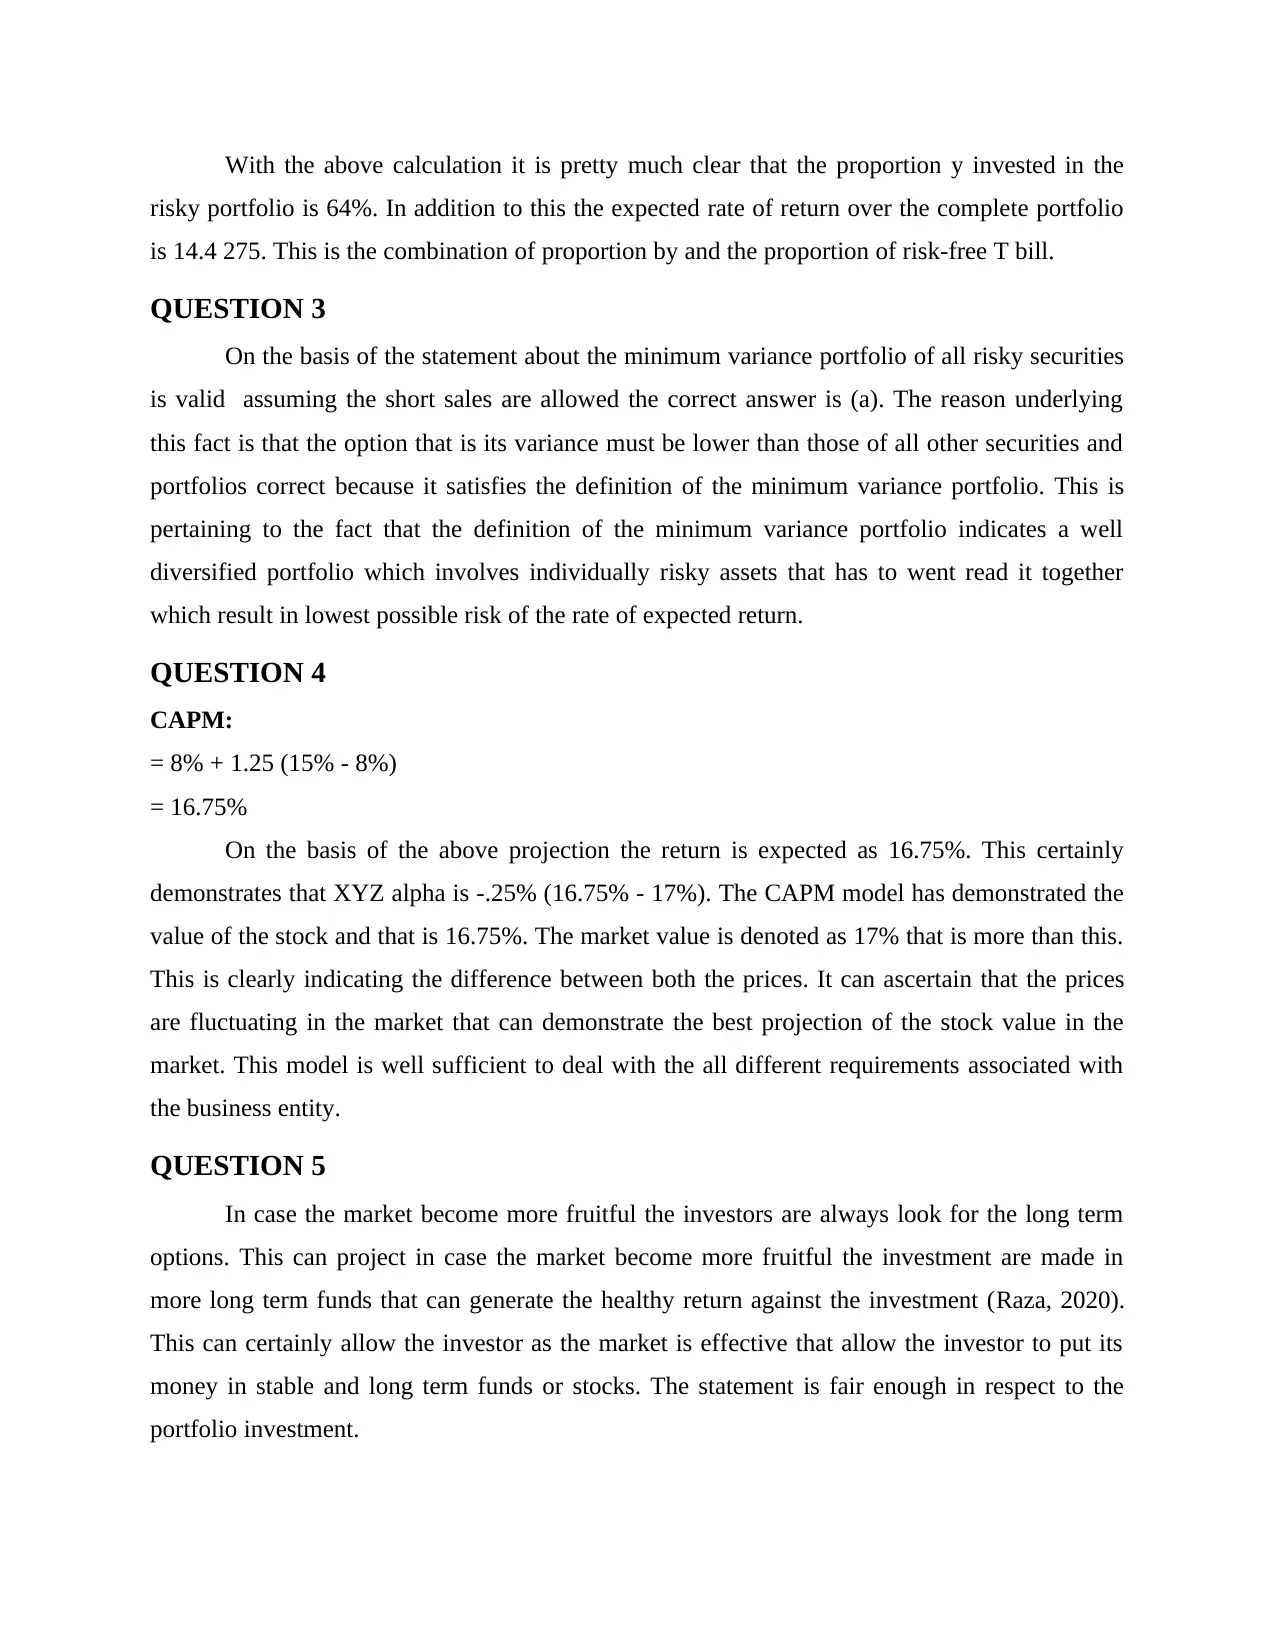
With the above calculation it is pretty much clear that the proportion y invested in the
risky portfolio is 64%. In addition to this the expected rate of return over the complete portfolio
is 14.4 275. This is the combination of proportion by and the proportion of risk-free T bill.
QUESTION 3
On the basis of the statement about the minimum variance portfolio of all risky securities
is valid assuming the short sales are allowed the correct answer is (a). The reason underlying
this fact is that the option that is its variance must be lower than those of all other securities and
portfolios correct because it satisfies the definition of the minimum variance portfolio. This is
pertaining to the fact that the definition of the minimum variance portfolio indicates a well
diversified portfolio which involves individually risky assets that has to went read it together
which result in lowest possible risk of the rate of expected return.
QUESTION 4
CAPM:
= 8% + 1.25 (15% - 8%)
= 16.75%
On the basis of the above projection the return is expected as 16.75%. This certainly
demonstrates that XYZ alpha is -.25% (16.75% - 17%). The CAPM model has demonstrated the
value of the stock and that is 16.75%. The market value is denoted as 17% that is more than this.
This is clearly indicating the difference between both the prices. It can ascertain that the prices
are fluctuating in the market that can demonstrate the best projection of the stock value in the
market. This model is well sufficient to deal with the all different requirements associated with
the business entity.
QUESTION 5
In case the market become more fruitful the investors are always look for the long term
options. This can project in case the market become more fruitful the investment are made in
more long term funds that can generate the healthy return against the investment (Raza, 2020).
This can certainly allow the investor as the market is effective that allow the investor to put its
money in stable and long term funds or stocks. The statement is fair enough in respect to the
portfolio investment.
Paraphrase This Document
Need a fresh take? Get an instant paraphrase of this document with our AI Paraphraser
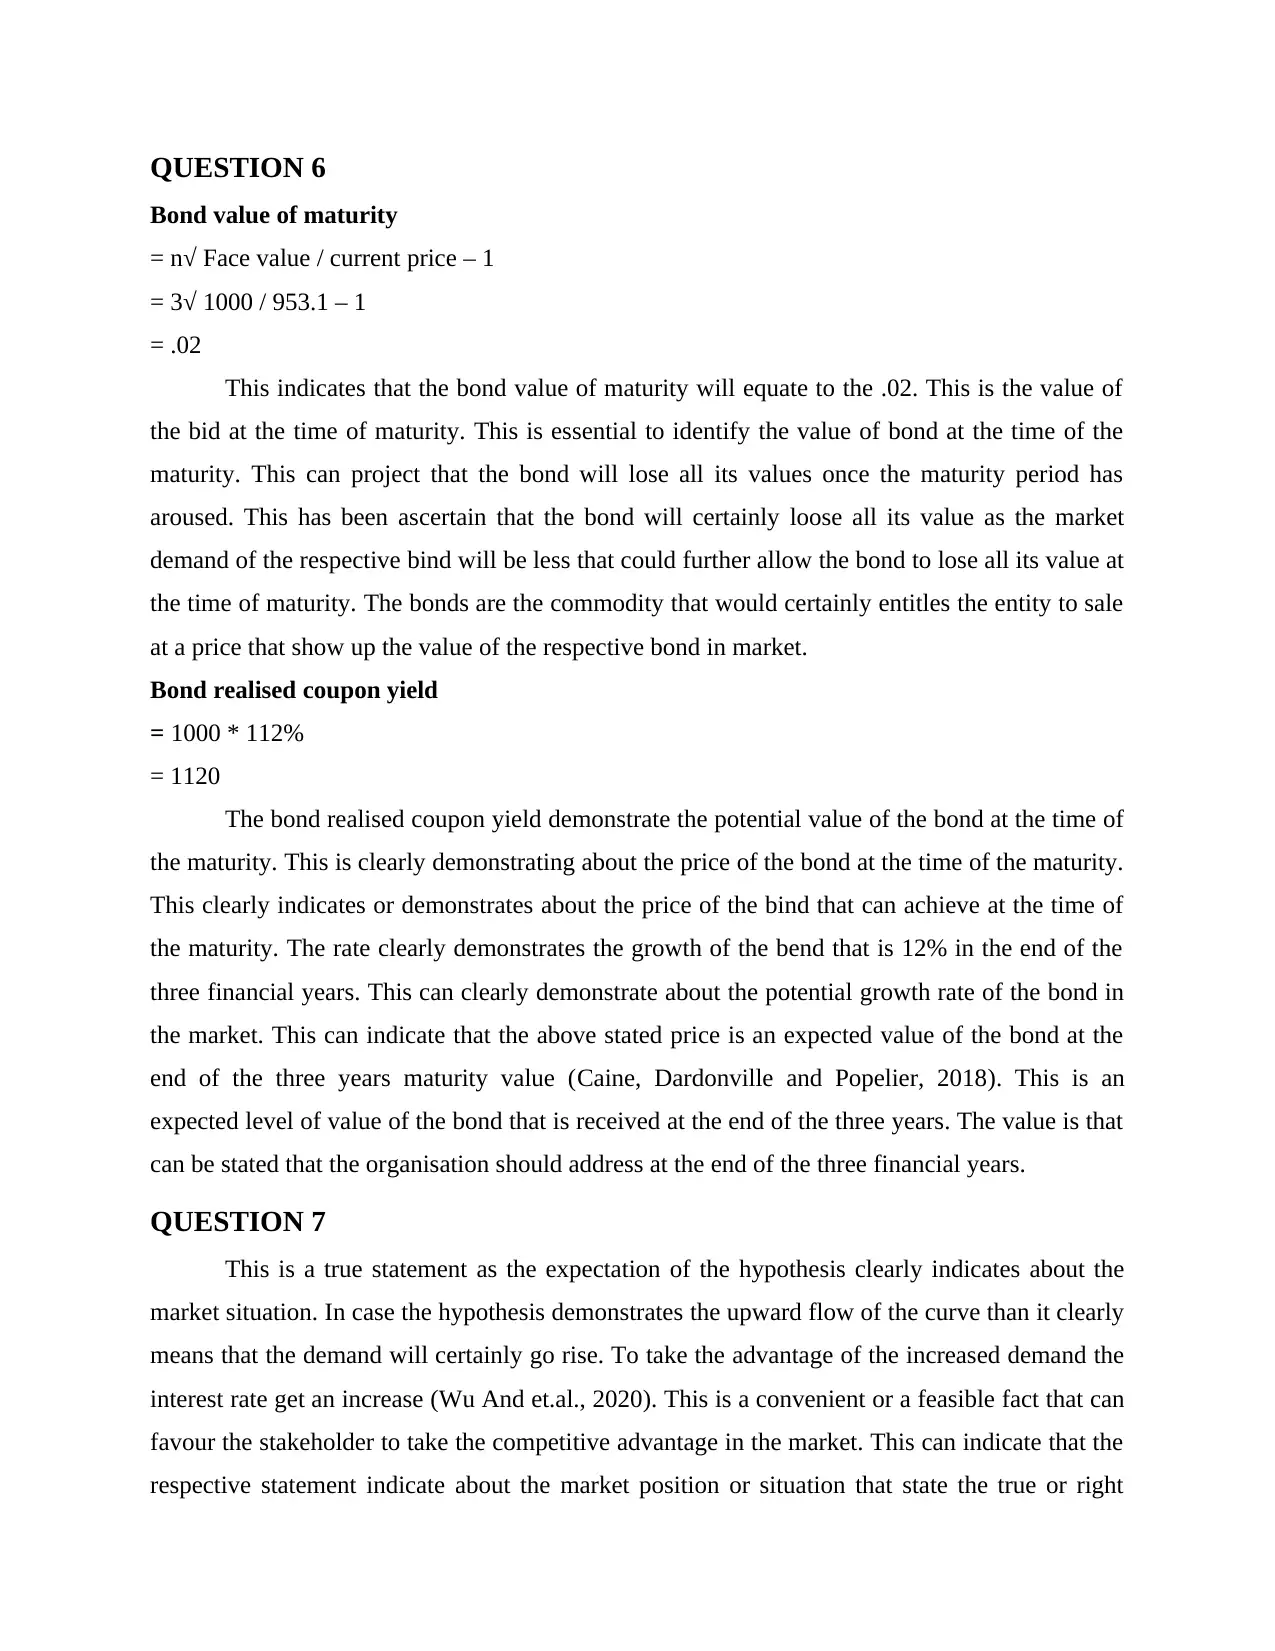
QUESTION 6
Bond value of maturity
= n√ Face value / current price – 1
= 3√ 1000 / 953.1 – 1
= .02
This indicates that the bond value of maturity will equate to the .02. This is the value of
the bid at the time of maturity. This is essential to identify the value of bond at the time of the
maturity. This can project that the bond will lose all its values once the maturity period has
aroused. This has been ascertain that the bond will certainly loose all its value as the market
demand of the respective bind will be less that could further allow the bond to lose all its value at
the time of maturity. The bonds are the commodity that would certainly entitles the entity to sale
at a price that show up the value of the respective bond in market.
Bond realised coupon yield
= 1000 * 112%
= 1120
The bond realised coupon yield demonstrate the potential value of the bond at the time of
the maturity. This is clearly demonstrating about the price of the bond at the time of the maturity.
This clearly indicates or demonstrates about the price of the bind that can achieve at the time of
the maturity. The rate clearly demonstrates the growth of the bend that is 12% in the end of the
three financial years. This can clearly demonstrate about the potential growth rate of the bond in
the market. This can indicate that the above stated price is an expected value of the bond at the
end of the three years maturity value (Caine, Dardonville and Popelier, 2018). This is an
expected level of value of the bond that is received at the end of the three years. The value is that
can be stated that the organisation should address at the end of the three financial years.
QUESTION 7
This is a true statement as the expectation of the hypothesis clearly indicates about the
market situation. In case the hypothesis demonstrates the upward flow of the curve than it clearly
means that the demand will certainly go rise. To take the advantage of the increased demand the
interest rate get an increase (Wu And et.al., 2020). This is a convenient or a feasible fact that can
favour the stakeholder to take the competitive advantage in the market. This can indicate that the
respective statement indicate about the market position or situation that state the true or right
position or the behaviour of the market. This is a basic nature of the market as the demand
increases the prices go high as all stakeholder groups try to take the competitive advantage of the
respective market situation.
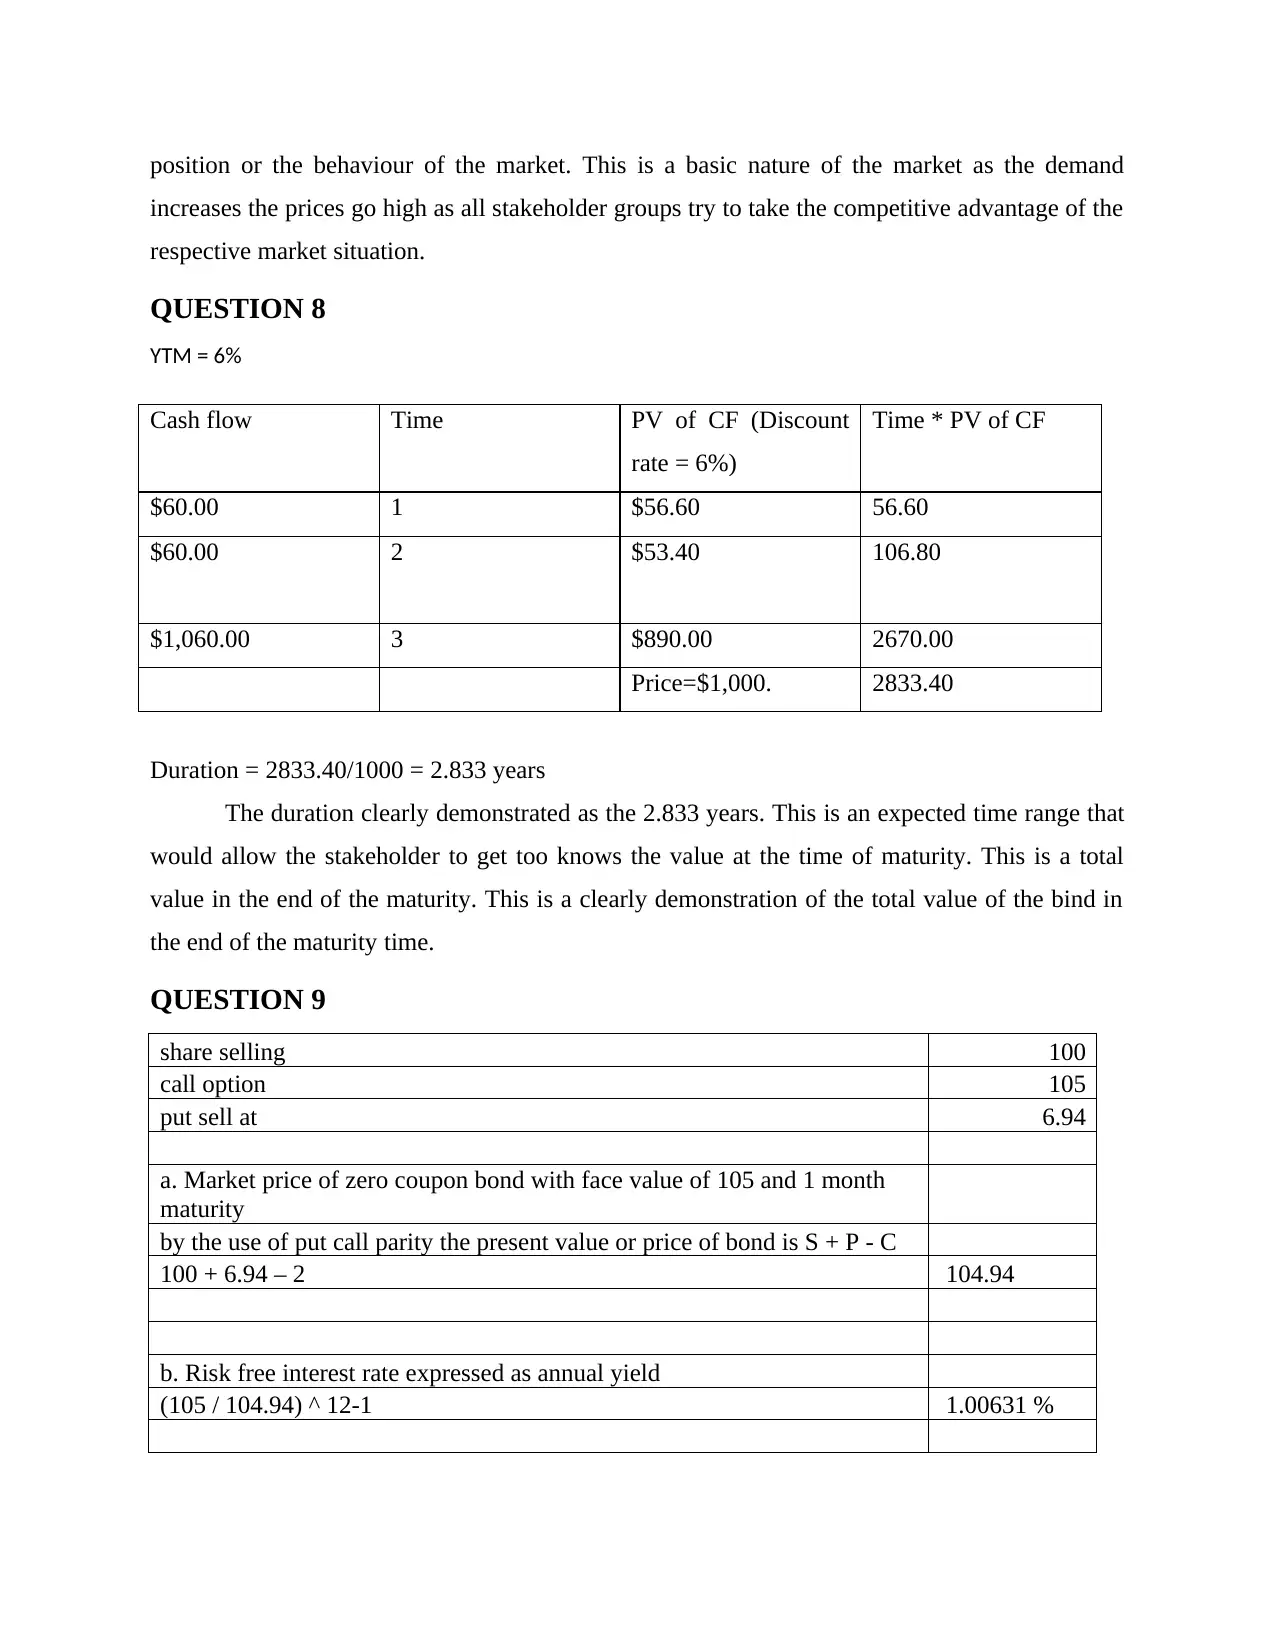
QUESTION 8
YTM = 6%
Cash flow Time PV of CF (Discount
rate = 6%)
Time * PV of CF
$60.00 1 $56.60 56.60
$60.00 2 $53.40 106.80
$1,060.00 3 $890.00 2670.00
Price=$1,000. 2833.40
Duration = 2833.40/1000 = 2.833 years
The duration clearly demonstrated as the 2.833 years. This is an expected time range that
would allow the stakeholder to get too knows the value at the time of maturity. This is a total
value in the end of the maturity. This is a clearly demonstration of the total value of the bind in
the end of the maturity time.
QUESTION 9
share selling 100
call option 105
put sell at 6.94
a. Market price of zero coupon bond with face value of 105 and 1 month
maturity
by the use of put call parity the present value or price of bond is S + P - C
100 + 6.94 – 2 104.94
b. Risk free interest rate expressed as annual yield
(105 / 104.94) ^ 12-1 1.00631 %
increases the prices go high as all stakeholder groups try to take the competitive advantage of the
respective market situation.
QUESTION 8
YTM = 6%
Cash flow Time PV of CF (Discount
rate = 6%)
Time * PV of CF
$60.00 1 $56.60 56.60
$60.00 2 $53.40 106.80
$1,060.00 3 $890.00 2670.00
Price=$1,000. 2833.40
Duration = 2833.40/1000 = 2.833 years
The duration clearly demonstrated as the 2.833 years. This is an expected time range that
would allow the stakeholder to get too knows the value at the time of maturity. This is a total
value in the end of the maturity. This is a clearly demonstration of the total value of the bind in
the end of the maturity time.
QUESTION 9
share selling 100
call option 105
put sell at 6.94
a. Market price of zero coupon bond with face value of 105 and 1 month
maturity
by the use of put call parity the present value or price of bond is S + P - C
100 + 6.94 – 2 104.94
b. Risk free interest rate expressed as annual yield
(105 / 104.94) ^ 12-1 1.00631 %
⊘ This is a preview!⊘
Do you want full access?
Subscribe today to unlock all pages.
Trusted by 1+ million students worldwide
With the valuation of the above calculation it is clear that the market price of the zero
coupon bond having face value of 105 and 1 month maturity is 10 4.94. Further with the
evaluation of risk free rate calculation it was analysed that the risk-free interest rate is 1.00631 %
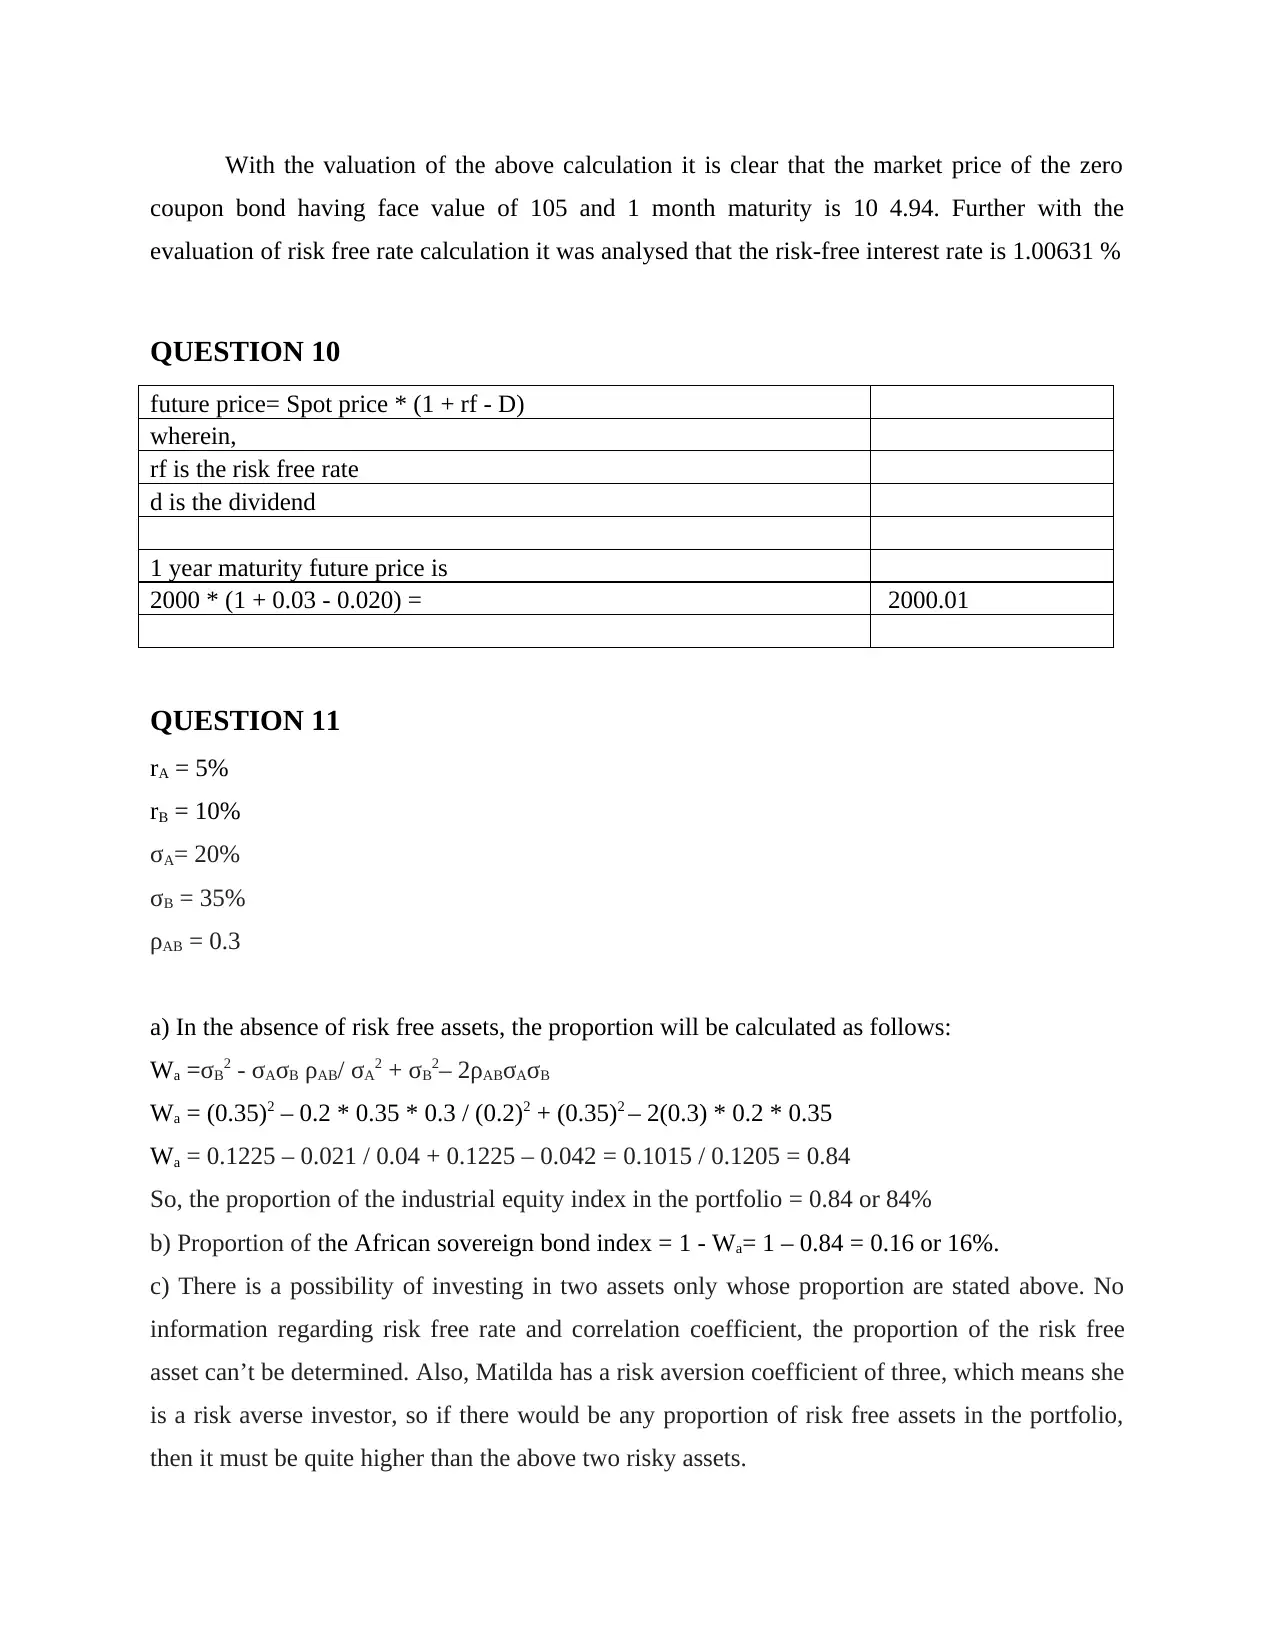
QUESTION 10
future price= Spot price * (1 + rf - D)
wherein,
rf is the risk free rate
d is the dividend
1 year maturity future price is
2000 * (1 + 0.03 - 0.020) = 2000.01
QUESTION 11
rA = 5%
rB = 10%
σA= 20%
σB = 35%
ρAB = 0.3
a) In the absence of risk free assets, the proportion will be calculated as follows:
Wa =σB2 - σAσB ρAB/ σA2 + σB2– 2ρABσAσB
Wa = (0.35)2 – 0.2 * 0.35 * 0.3 / (0.2)2 + (0.35)2 – 2(0.3) * 0.2 * 0.35
Wa = 0.1225 – 0.021 / 0.04 + 0.1225 – 0.042 = 0.1015 / 0.1205 = 0.84
So, the proportion of the industrial equity index in the portfolio = 0.84 or 84%
b) Proportion of the African sovereign bond index = 1 - Wa= 1 – 0.84 = 0.16 or 16%.
c) There is a possibility of investing in two assets only whose proportion are stated above. No
information regarding risk free rate and correlation coefficient, the proportion of the risk free
asset can’t be determined. Also, Matilda has a risk aversion coefficient of three, which means she
is a risk averse investor, so if there would be any proportion of risk free assets in the portfolio,
then it must be quite higher than the above two risky assets.
coupon bond having face value of 105 and 1 month maturity is 10 4.94. Further with the
evaluation of risk free rate calculation it was analysed that the risk-free interest rate is 1.00631 %
QUESTION 10
future price= Spot price * (1 + rf - D)
wherein,
rf is the risk free rate
d is the dividend
1 year maturity future price is
2000 * (1 + 0.03 - 0.020) = 2000.01
QUESTION 11
rA = 5%
rB = 10%
σA= 20%
σB = 35%
ρAB = 0.3
a) In the absence of risk free assets, the proportion will be calculated as follows:
Wa =σB2 - σAσB ρAB/ σA2 + σB2– 2ρABσAσB
Wa = (0.35)2 – 0.2 * 0.35 * 0.3 / (0.2)2 + (0.35)2 – 2(0.3) * 0.2 * 0.35
Wa = 0.1225 – 0.021 / 0.04 + 0.1225 – 0.042 = 0.1015 / 0.1205 = 0.84
So, the proportion of the industrial equity index in the portfolio = 0.84 or 84%
b) Proportion of the African sovereign bond index = 1 - Wa= 1 – 0.84 = 0.16 or 16%.
c) There is a possibility of investing in two assets only whose proportion are stated above. No
information regarding risk free rate and correlation coefficient, the proportion of the risk free
asset can’t be determined. Also, Matilda has a risk aversion coefficient of three, which means she
is a risk averse investor, so if there would be any proportion of risk free assets in the portfolio,
then it must be quite higher than the above two risky assets.
Paraphrase This Document
Need a fresh take? Get an instant paraphrase of this document with our AI Paraphraser
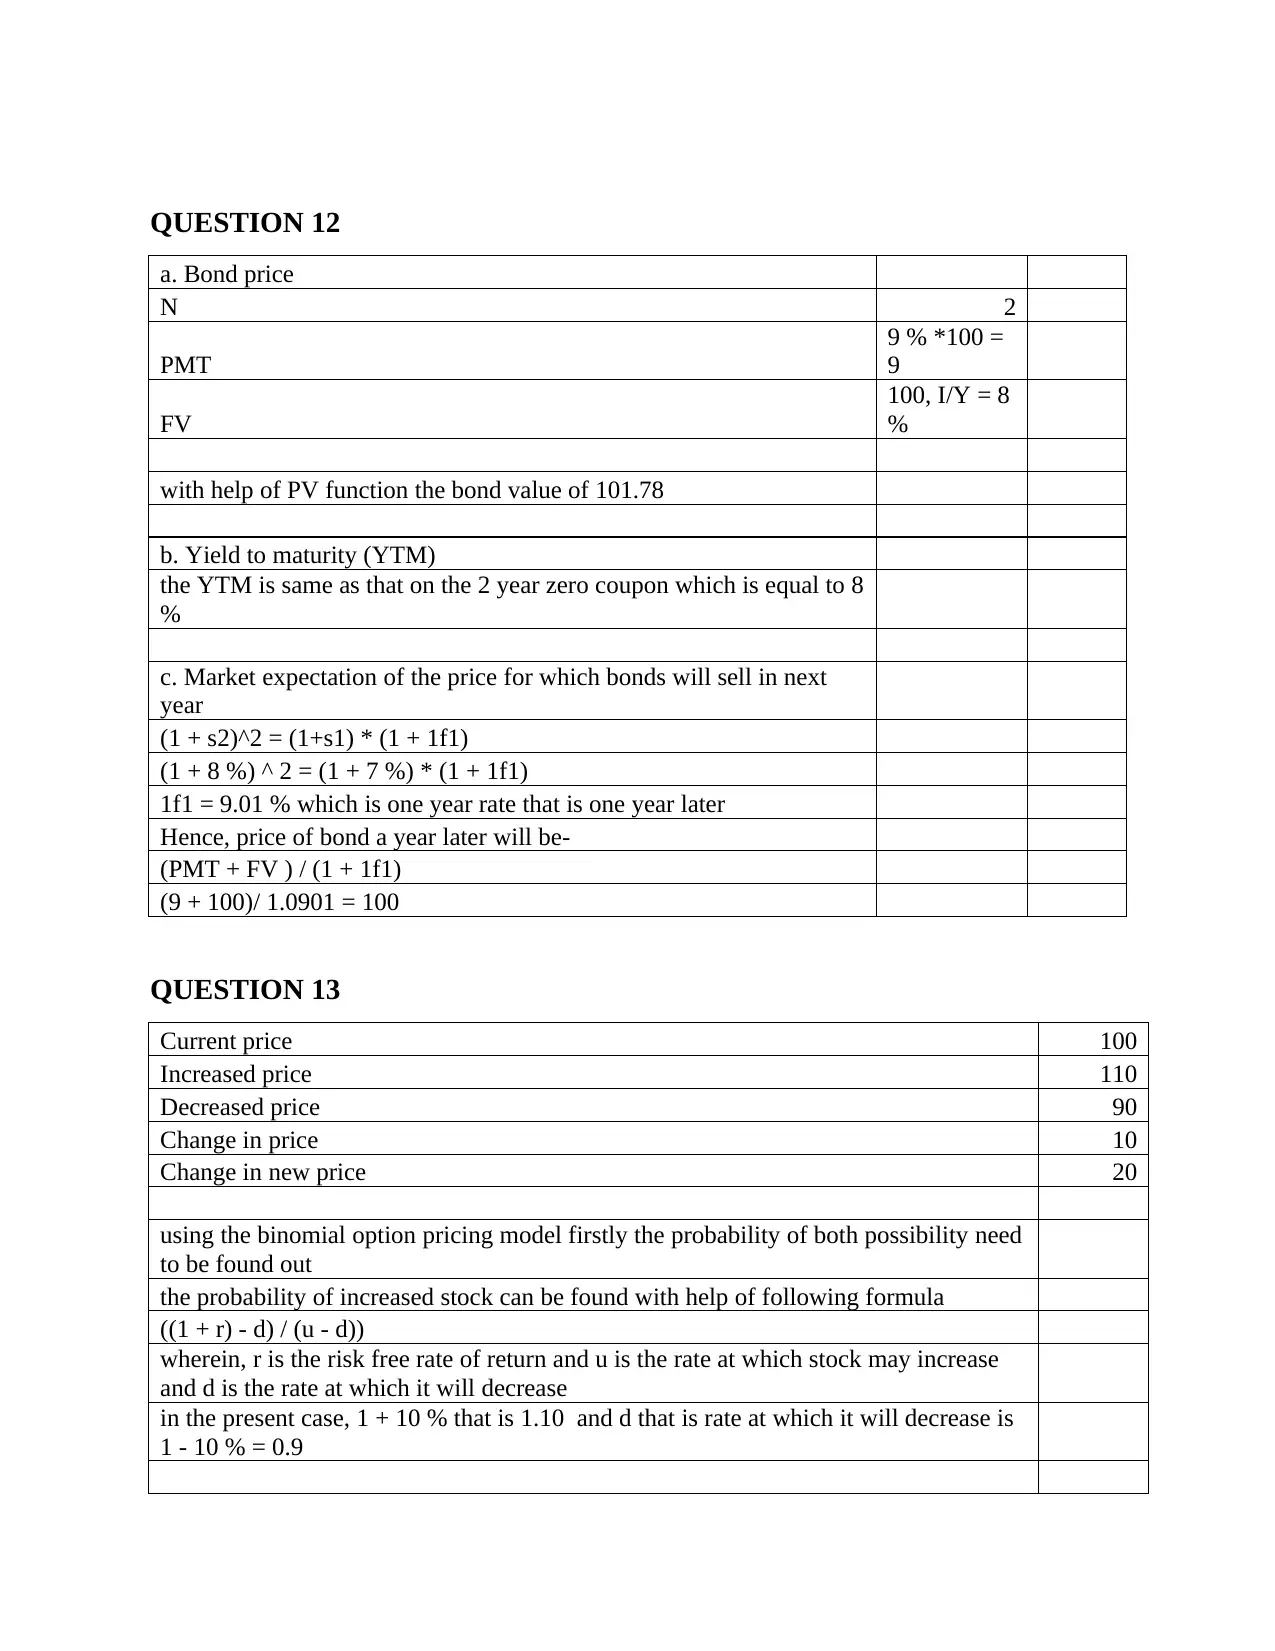
QUESTION 12
a. Bond price
N 2
PMT
9 % *100 =
9
FV
100, I/Y = 8
%
with help of PV function the bond value of 101.78
b. Yield to maturity (YTM)
the YTM is same as that on the 2 year zero coupon which is equal to 8
%
c. Market expectation of the price for which bonds will sell in next
year
(1 + s2)^2 = (1+s1) * (1 + 1f1)
(1 + 8 %) ^ 2 = (1 + 7 %) * (1 + 1f1)
1f1 = 9.01 % which is one year rate that is one year later
Hence, price of bond a year later will be-
(PMT + FV ) / (1 + 1f1)
(9 + 100)/ 1.0901 = 100
QUESTION 13
Current price 100
Increased price 110
Decreased price 90
Change in price 10
Change in new price 20
using the binomial option pricing model firstly the probability of both possibility need
to be found out
the probability of increased stock can be found with help of following formula
((1 + r) - d) / (u - d))
wherein, r is the risk free rate of return and u is the rate at which stock may increase
and d is the rate at which it will decrease
in the present case, 1 + 10 % that is 1.10 and d that is rate at which it will decrease is
1 - 10 % = 0.9
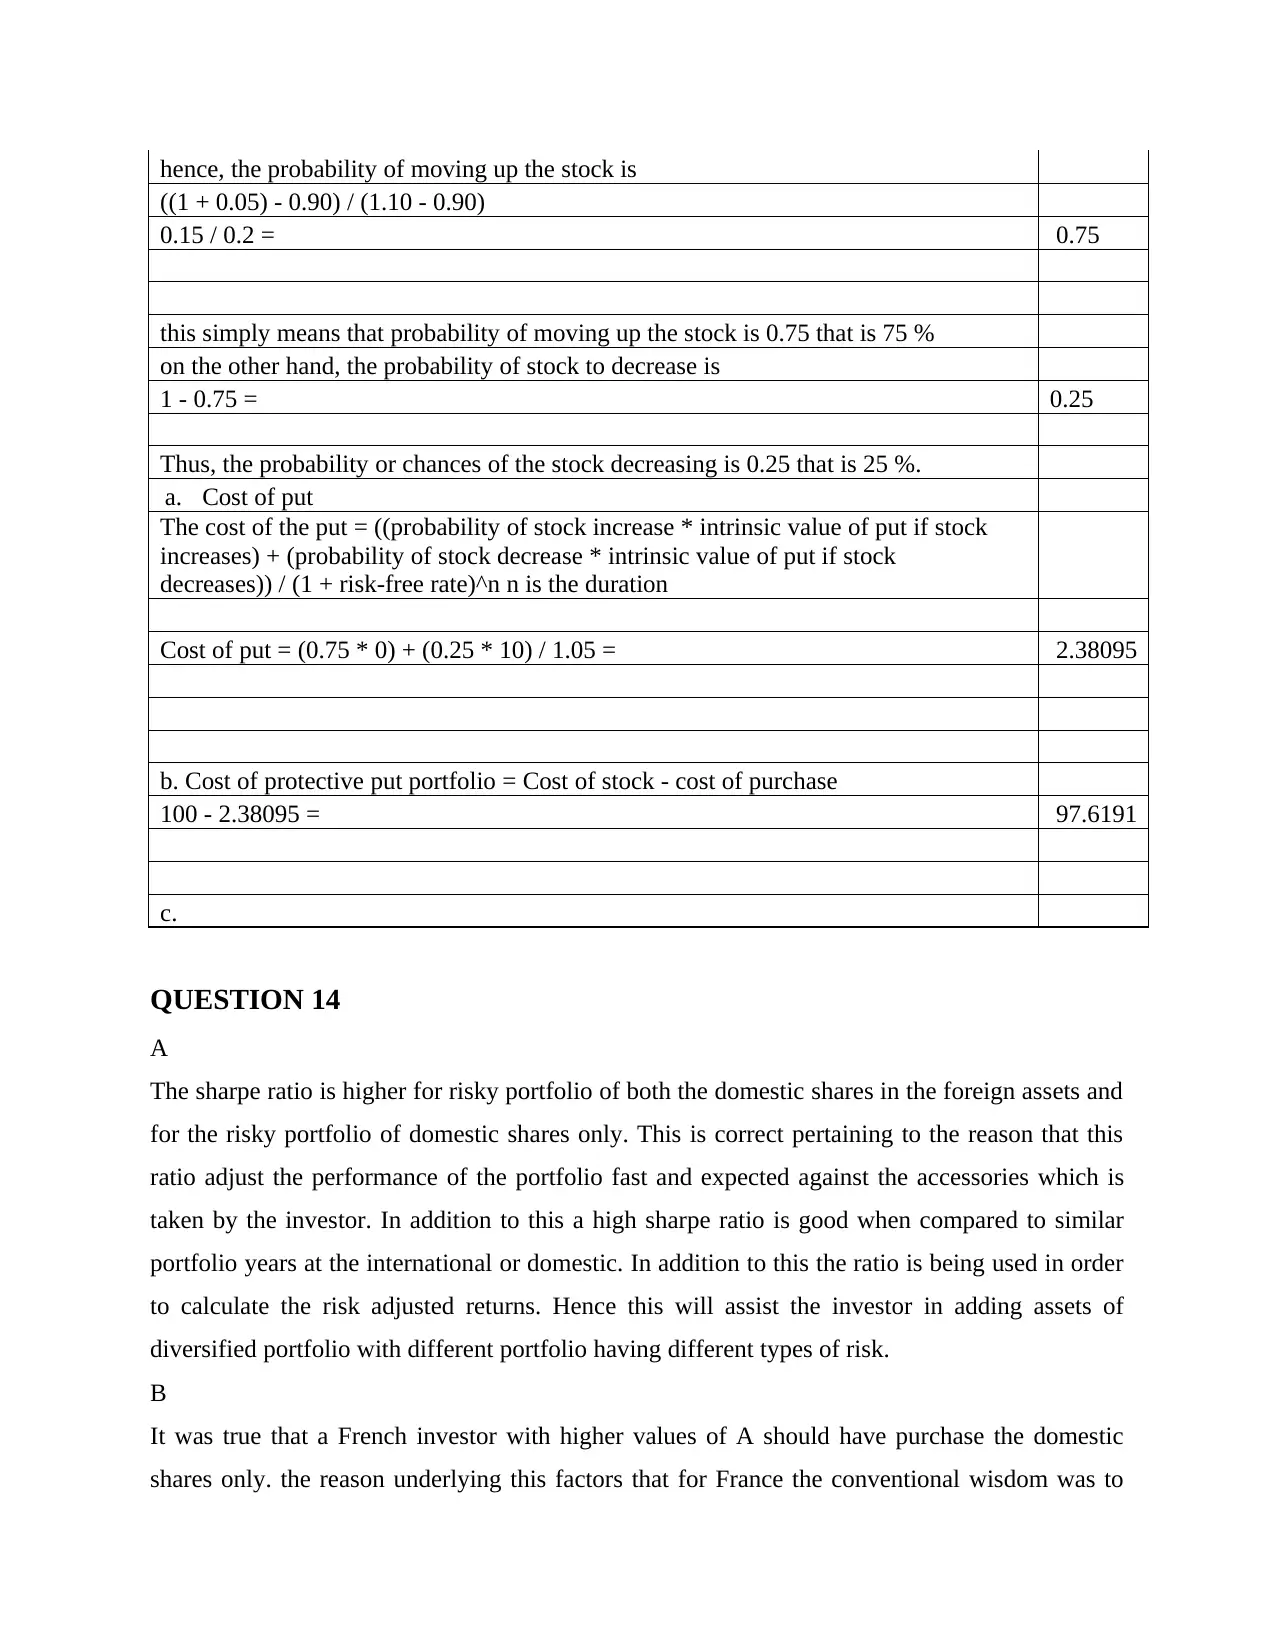
hence, the probability of moving up the stock is
((1 + 0.05) - 0.90) / (1.10 - 0.90)
0.15 / 0.2 = 0.75
this simply means that probability of moving up the stock is 0.75 that is 75 %
on the other hand, the probability of stock to decrease is
1 - 0.75 = 0.25
Thus, the probability or chances of the stock decreasing is 0.25 that is 25 %.
a. Cost of put
The cost of the put = ((probability of stock increase * intrinsic value of put if stock
increases) + (probability of stock decrease * intrinsic value of put if stock
decreases)) / (1 + risk-free rate)^n n is the duration
Cost of put = (0.75 * 0) + (0.25 * 10) / 1.05 = 2.38095
b. Cost of protective put portfolio = Cost of stock - cost of purchase
100 - 2.38095 = 97.6191
c.
QUESTION 14
A
The sharpe ratio is higher for risky portfolio of both the domestic shares in the foreign assets and
for the risky portfolio of domestic shares only. This is correct pertaining to the reason that this
ratio adjust the performance of the portfolio fast and expected against the accessories which is
taken by the investor. In addition to this a high sharpe ratio is good when compared to similar
portfolio years at the international or domestic. In addition to this the ratio is being used in order
to calculate the risk adjusted returns. Hence this will assist the investor in adding assets of
diversified portfolio with different portfolio having different types of risk.
B
It was true that a French investor with higher values of A should have purchase the domestic
shares only. the reason underlying this factors that for France the conventional wisdom was to
⊘ This is a preview!⊘
Do you want full access?
Subscribe today to unlock all pages.
Trusted by 1+ million students worldwide
consider that the foreign investment were over committed to European countries only (Harvey,
2017). and because of this day over the political and diplomatic considerations and due to this
should purchase the domestic shares only and not invest within the international funds or the
investments in other countries.
C
In the present given scenario the share of a complete portfolio investors and metallurgy
sector will be almost around 20%. The remaining share of the investment will be within the risk
free friends acids and some to the optimal risky portfolio which involves domestic shares and
foreign assets. This fact is that the major share held by the French investor within the foreign
asset is between 23% to 25%. And because of this reason the investment and metallurgy sector
will be around 25%. In addition to this it also seems that with respect to the modern portfolio
theory and financial analysis statistics the French investors widely or inclined with foreign
investment. This is particularly because of the reason that the view of French investors
conservative and cautious and because of this state is not investing much within the foreign
investments. Hence the major preference of the French investor is to allocate the capital to the
risk-free French assets only and a little portion to the optimal risky portfolio which involves both
domestic and foreign assets.
Along with this it was also proved that the French investors I'm find more opportunities
available on the Paris stock exchange. The reason underlying this practice of the French
investment abroad improves the portfolio efficiency but this is more interesting that French
investors could have endured the bias against the domestic investment. Hence the structure of
French portfolio corroborates the rationality of the reference of an investor for the European
investments only and not the foreign investments. This seems that there is an existence of
domestic buyers at the time of investment and because of this the investor does not invest within
the international or other countries investment (Harvey and Liu, 2020). The reason underlying
this fact is that there is always a risk being attached and because of this the French investors does
not like to invest much more international investments. This is the only reason why the ratio of
the domestic investment compared with the foreign investment is low. The French investors like
to invest more within theme domestic investment rather than the foreign.
D
Paraphrase This Document
Need a fresh take? Get an instant paraphrase of this document with our AI Paraphraser
With the aznalysis of the article it was evaluated that the investors must have done the
investments with London stock exchange rather than Paris stock exchange. This is particularly
because of the reason that the London stock exchange account for 60% of the total nominal value
of all the stocks listed on the exchange. In addition to this the one third of all these topics
accounts for foreign stocks which are issued by the foreign Government and the municipalities.
On the other hand 40% of the stocks are devoted to the railways (Chang, McAleer and Wong,
2018).
In addition to this the remaining are financed through mines and plantation along with
banks and financial institutions of public utilities. This involves majorly government and all the
authentic and stable companies. Hence it is much safer for investing within the London stock
exchange. In contrast to this the foreign issues being made by the Paris stock exchange is around
50%. In comparison of both it was found that London stock exchange is having 60% of the
foreign stocks whereas Paris stock exchange is having only 50%.
In addition to this the Great Britain has a particular approach which explains that use
investment abroad helps in identifying the gap in return between the domestic and foreign asset.
The reason behind this fact is that the foreign investment provides more result as compared to the
domestic one. Hence it is advisable to the investors that they must invest through the London
stock exchange rather than the Paris stock exchange. Along with this the British foreign
investment were also allowed Victoria investors to hold the diversify portfolio used in order to
enhance their performance. Moreover a little emphasis was also put over the geographical
distribution of these foreign investments. This is considered as a methodology that European
investors were aware of all the investments at the end of the 19th century.
REFERENCES
Books and Journals
Raza, Z., 2020. The expected values of arithmetic bond connectivity and geometric indices in
random phenylene chains. Heliyon. 6(7). p.e04479.
Caine, B. A., Dardonville, C. and Popelier, P. L., 2018. Prediction of Aqueous p K a Values for
Guanidine-Containing Compounds Using Ab Initio Gas-Phase Equilibrium Bond
Lengths. ACS omega. 3(4). pp.3835-3850.
Wu, X. And et.al., 2020. H-bond interactions between arsenite and deoxynucleotides at different
pH values: A combined computational and experimental study. Chemosphere. 251.
p.126395.
Harvey, C.R., 2017. Presidential address: The scientific outlook in financial economics. The
Journal of Finance, 72(4), pp.1399-1440.
Harvey, C.R. and Liu, Y., 2020. False (and missed) discoveries in financial economics. The
Journal of Finance, 75(5), pp.2503-2553.
Chang, C.L., McAleer, M. and Wong, W.K., 2018. Management information, decision sciences,
and financial economics: A connection (No. TI 2018-004/III). Tinbergen Institute
Discussion Paper.
⊘ This is a preview!⊘
Do you want full access?
Subscribe today to unlock all pages.
Trusted by 1+ million students worldwide
1 out of 12


Your All-in-One AI-Powered Toolkit for Academic Success.
+13062052269
info@desklib.com
Available 24*7 on WhatsApp / Email
![[object Object]](/_next/static/media/star-bottom.7253800d.svg)
Unlock your academic potential
Copyright © 2020–2026 A2Z Services. All Rights Reserved. Developed and managed by ZUCOL.