ECOM2001 - Financial Asset Portfolio Analysis Project Semester 1

Verified

Added on  2023/04/03

|17
|1458
|198
Project
AI Summary
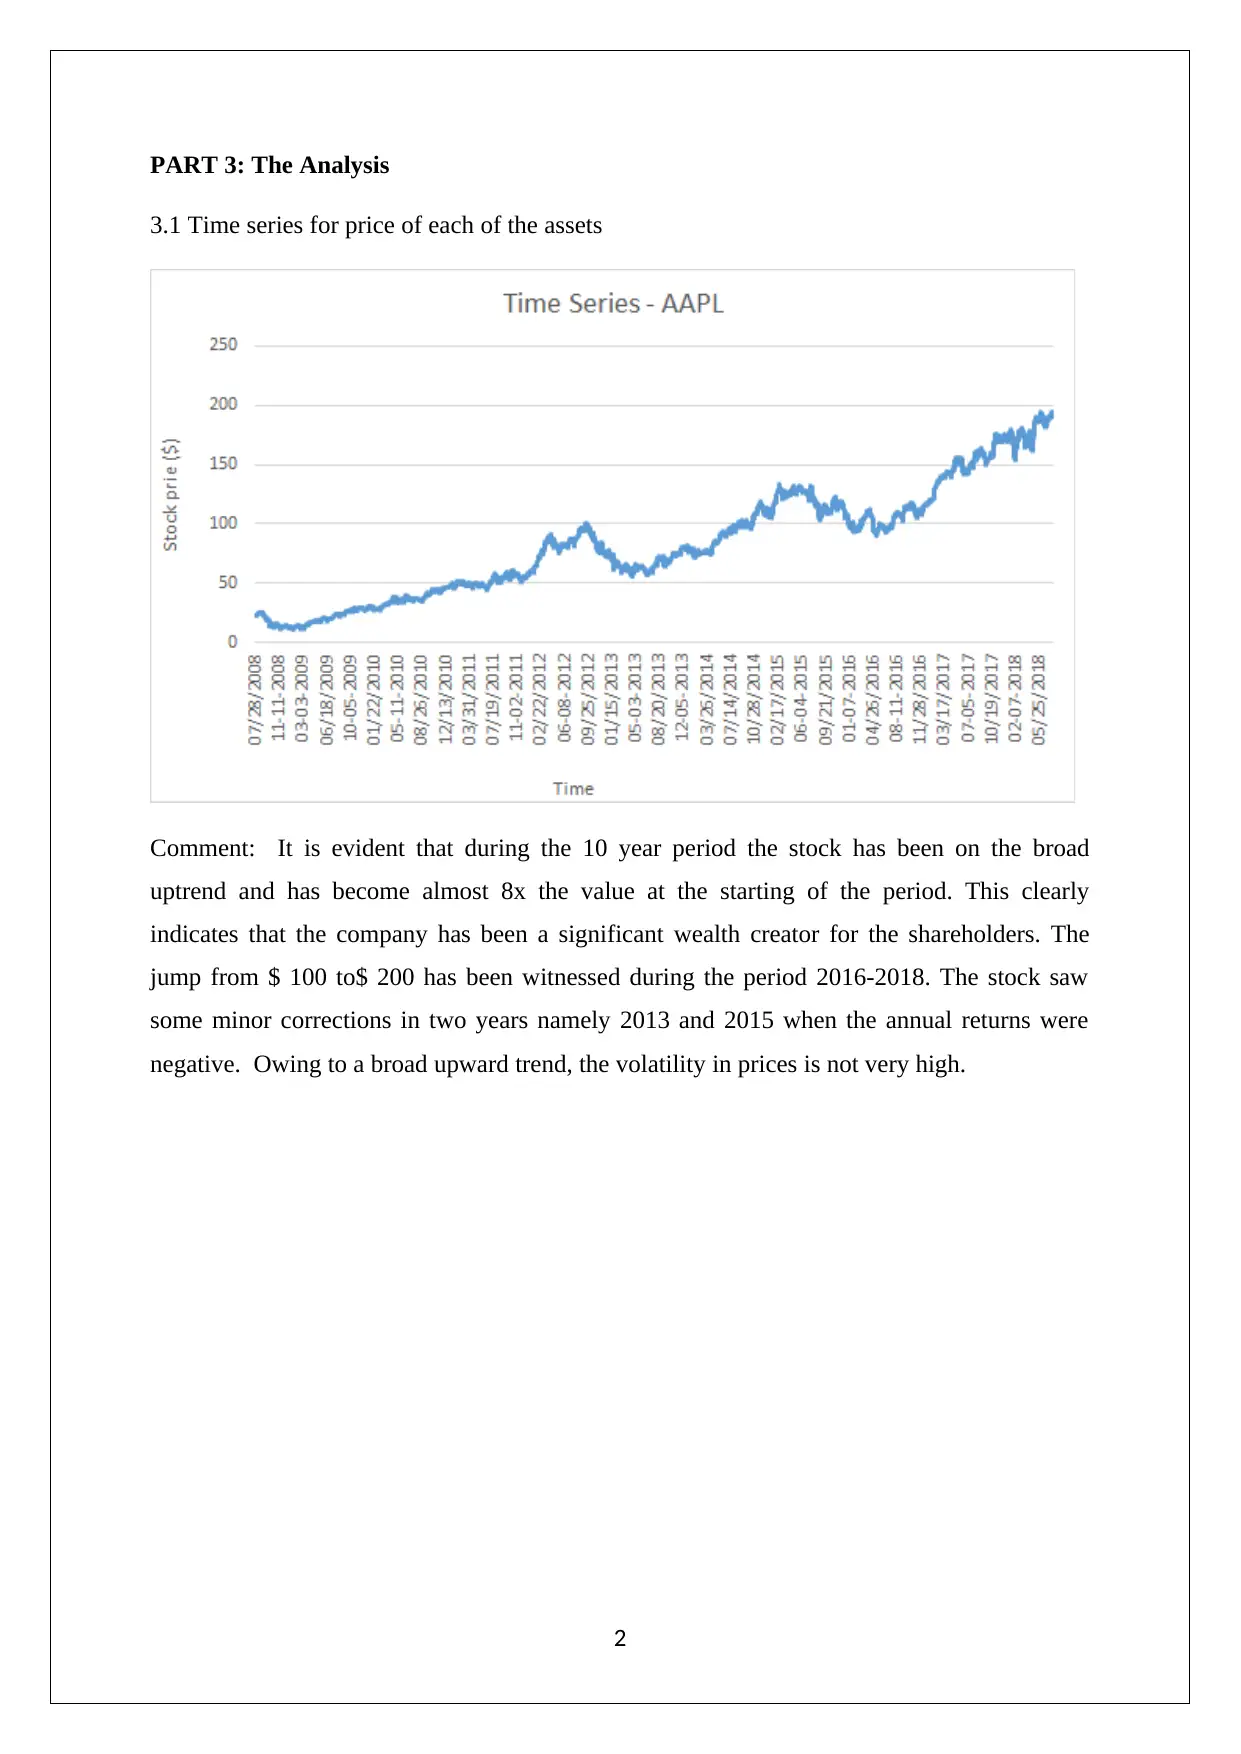
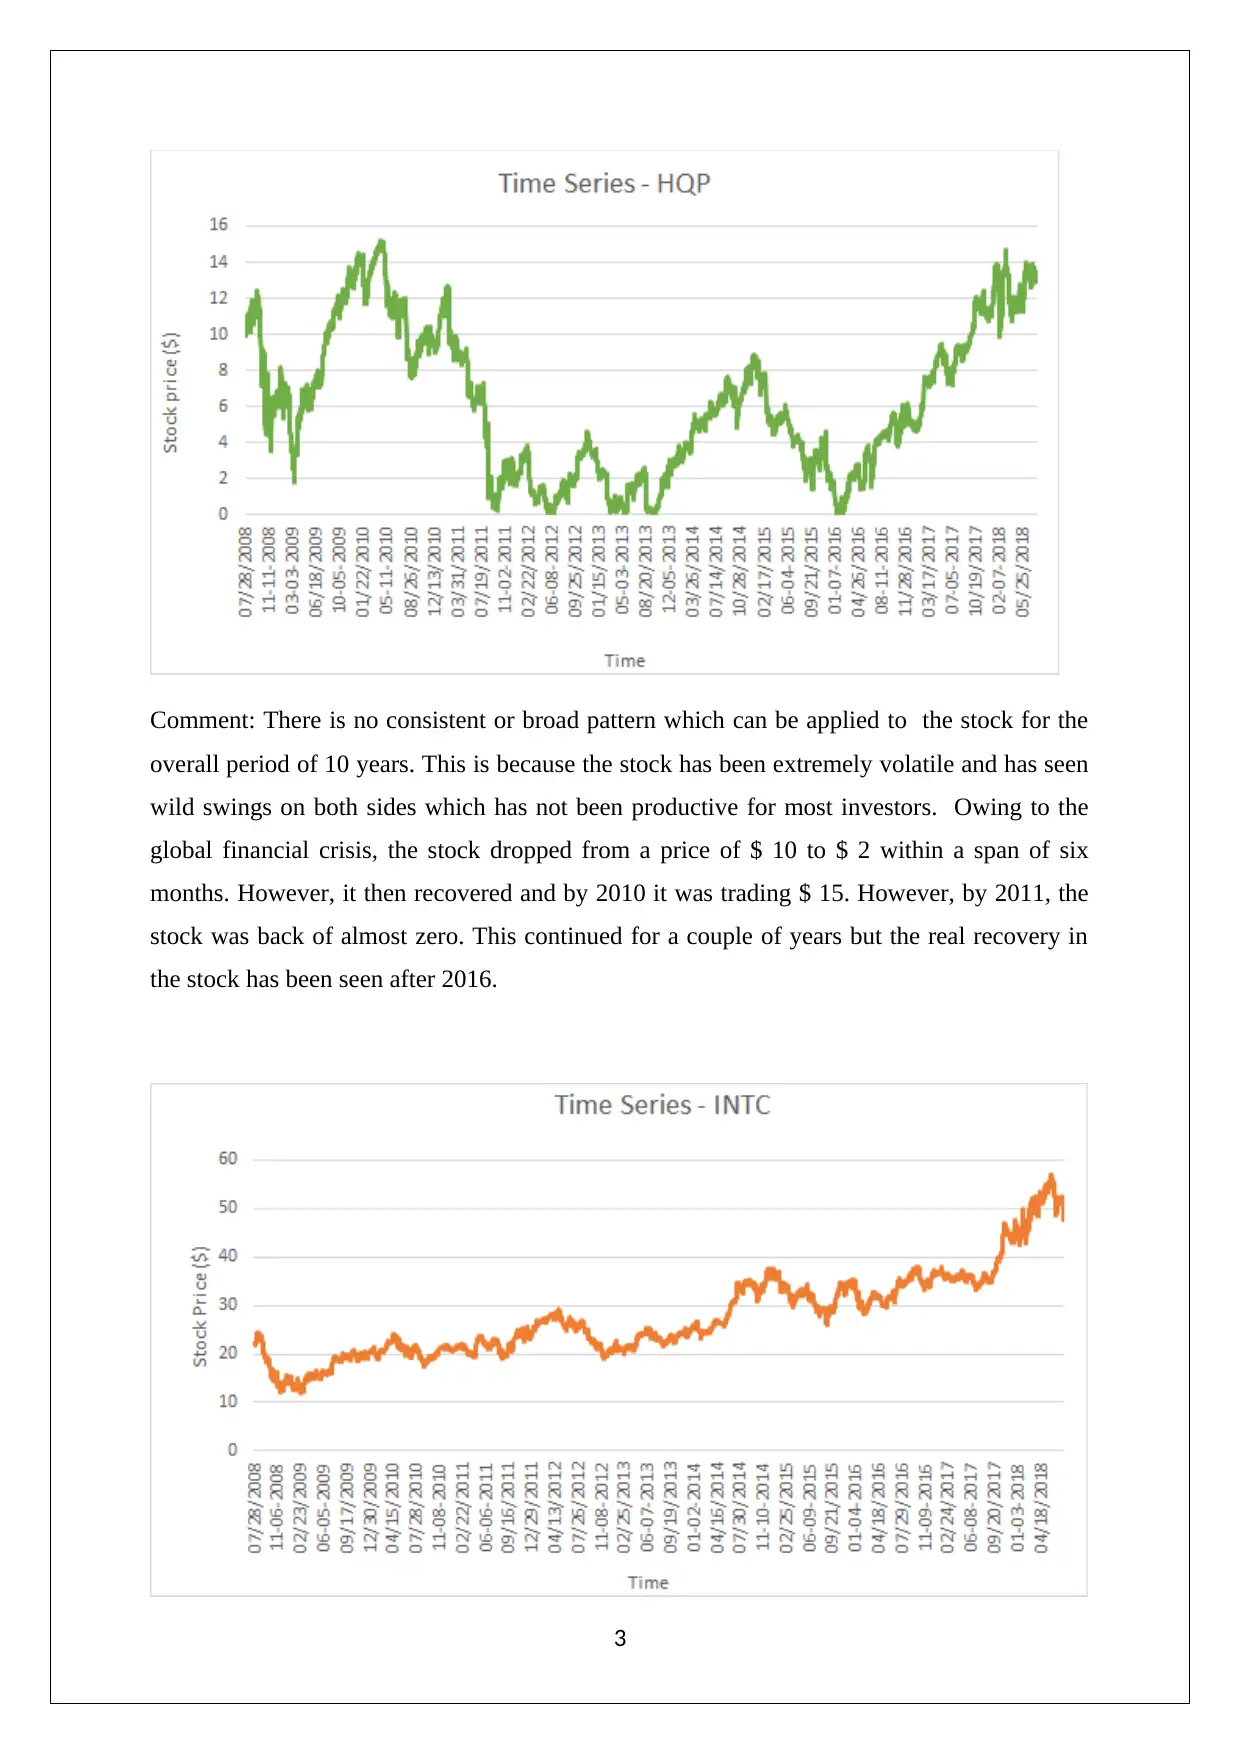
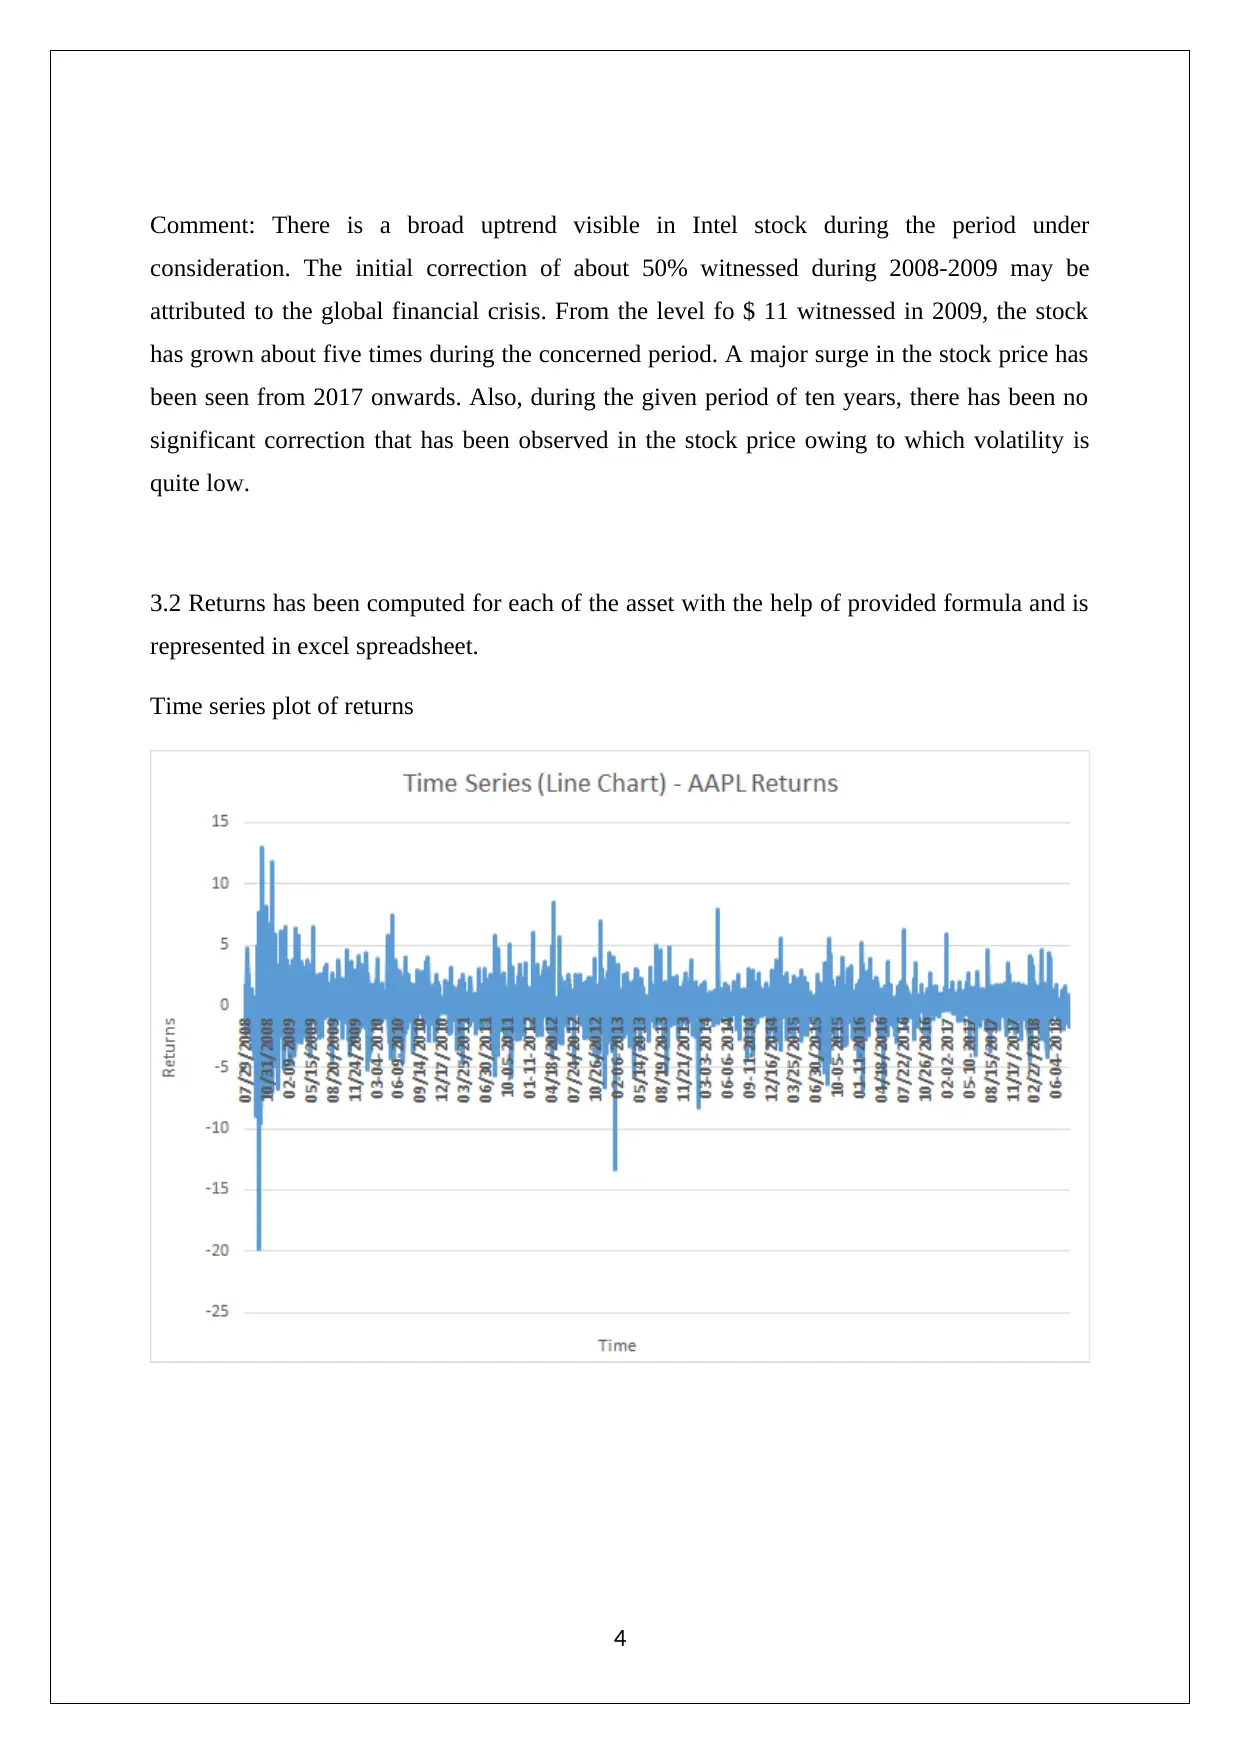
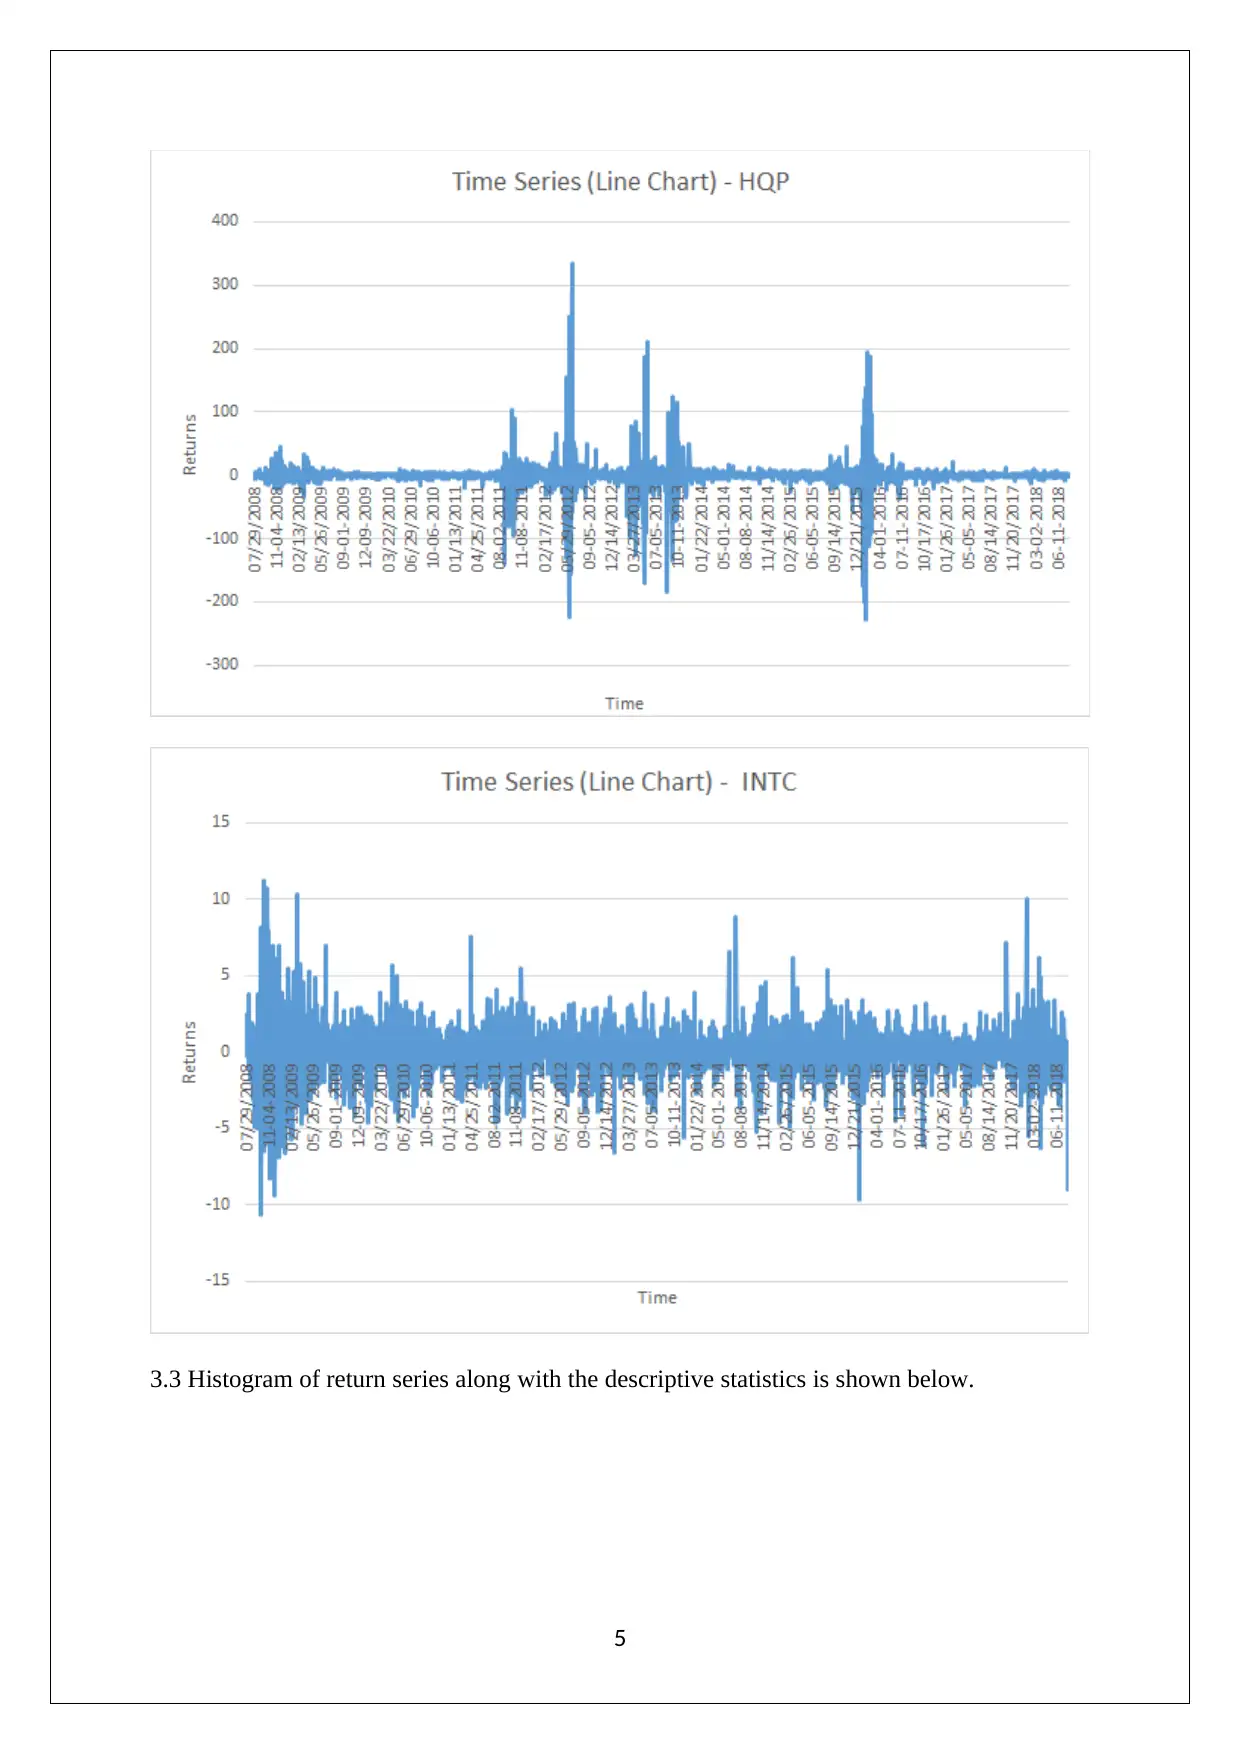
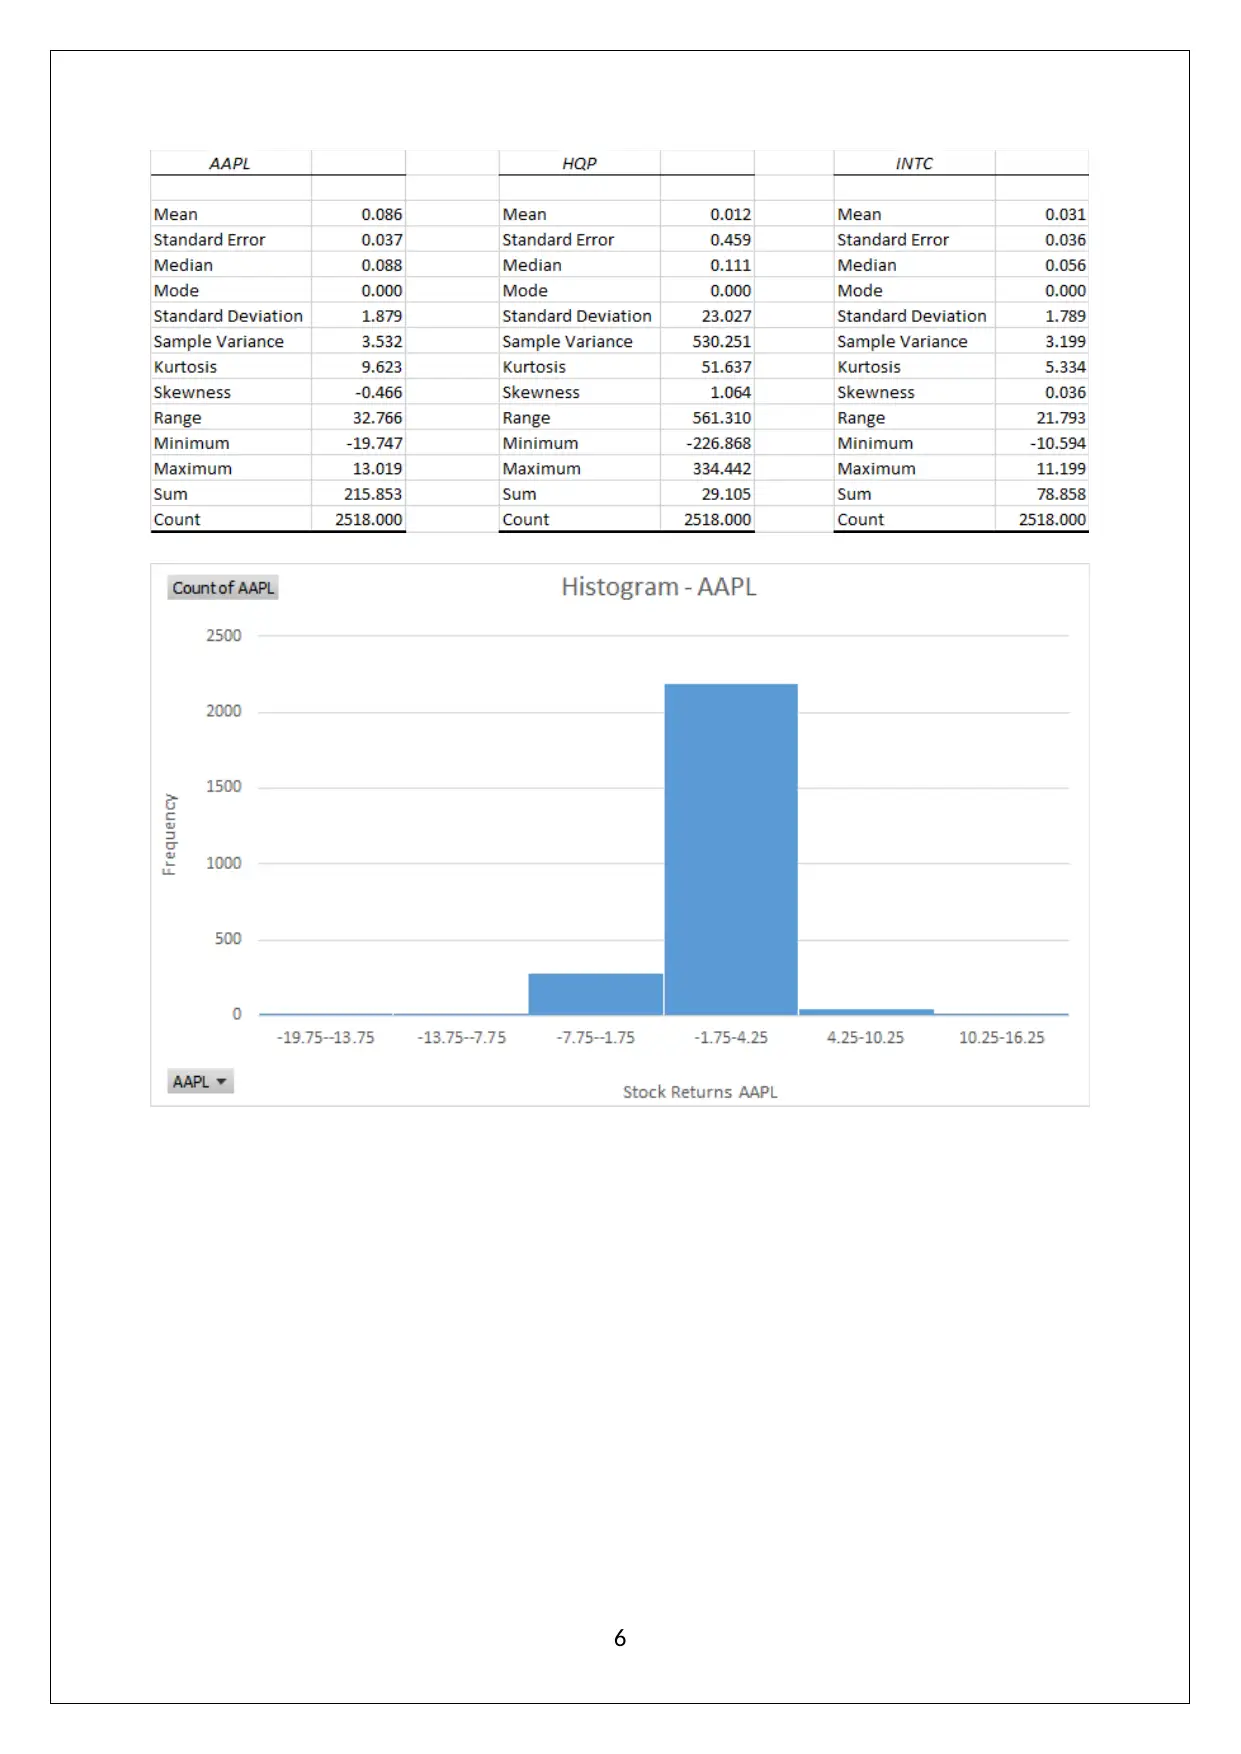
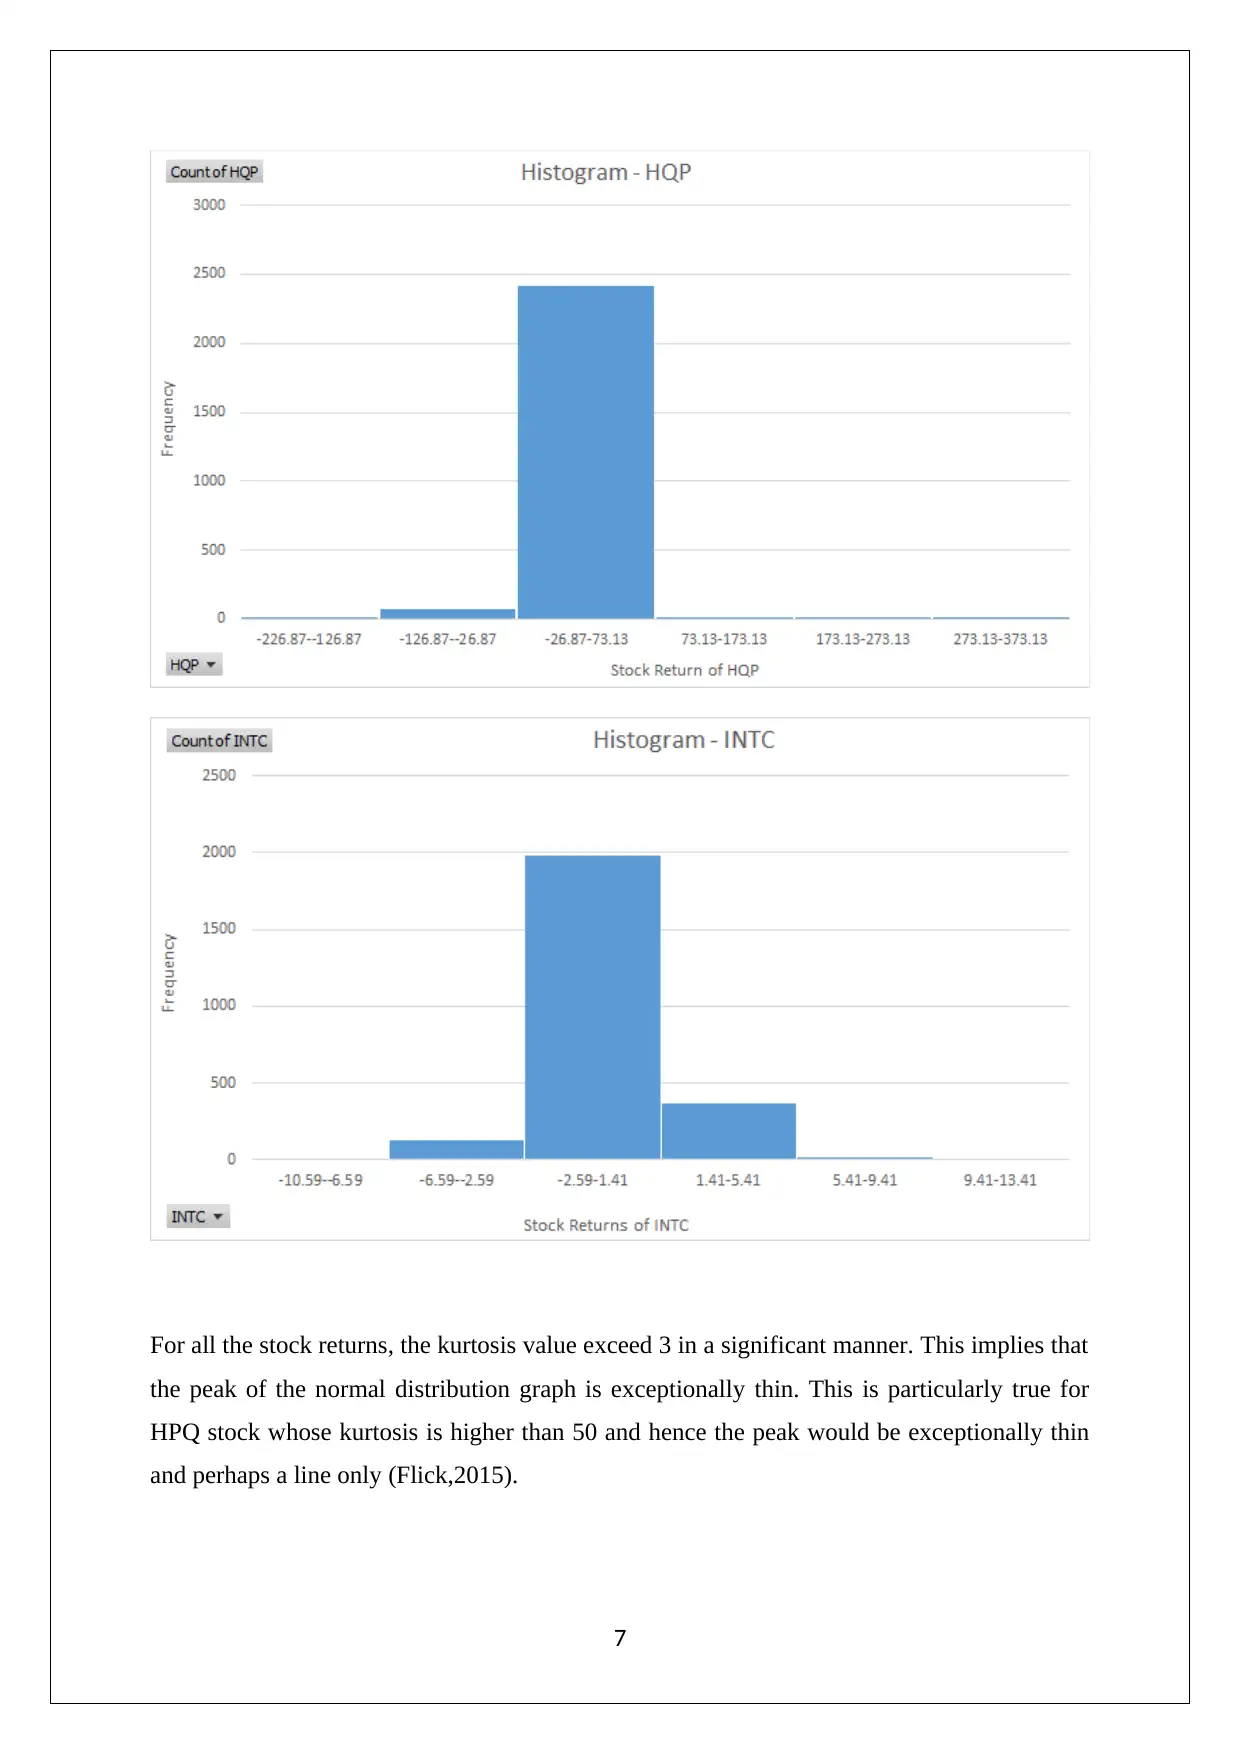
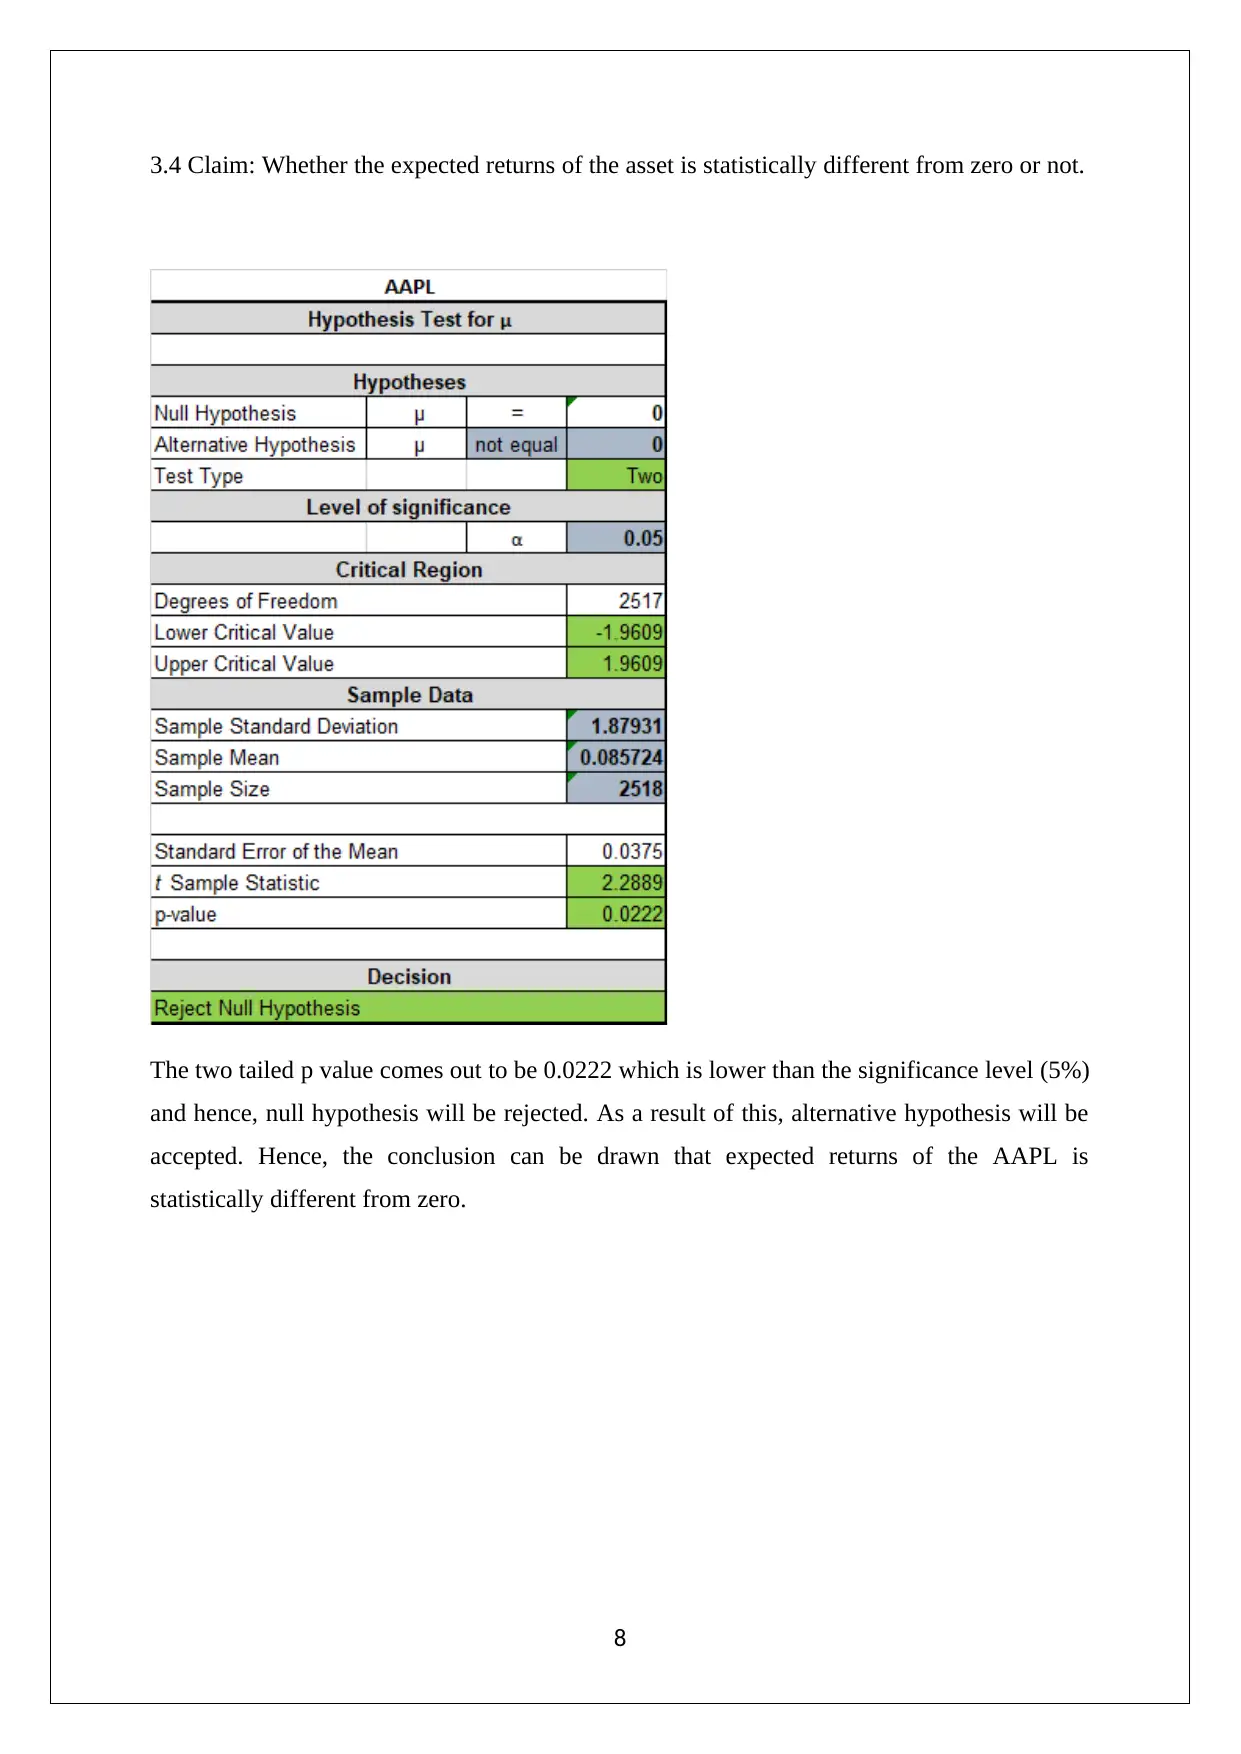
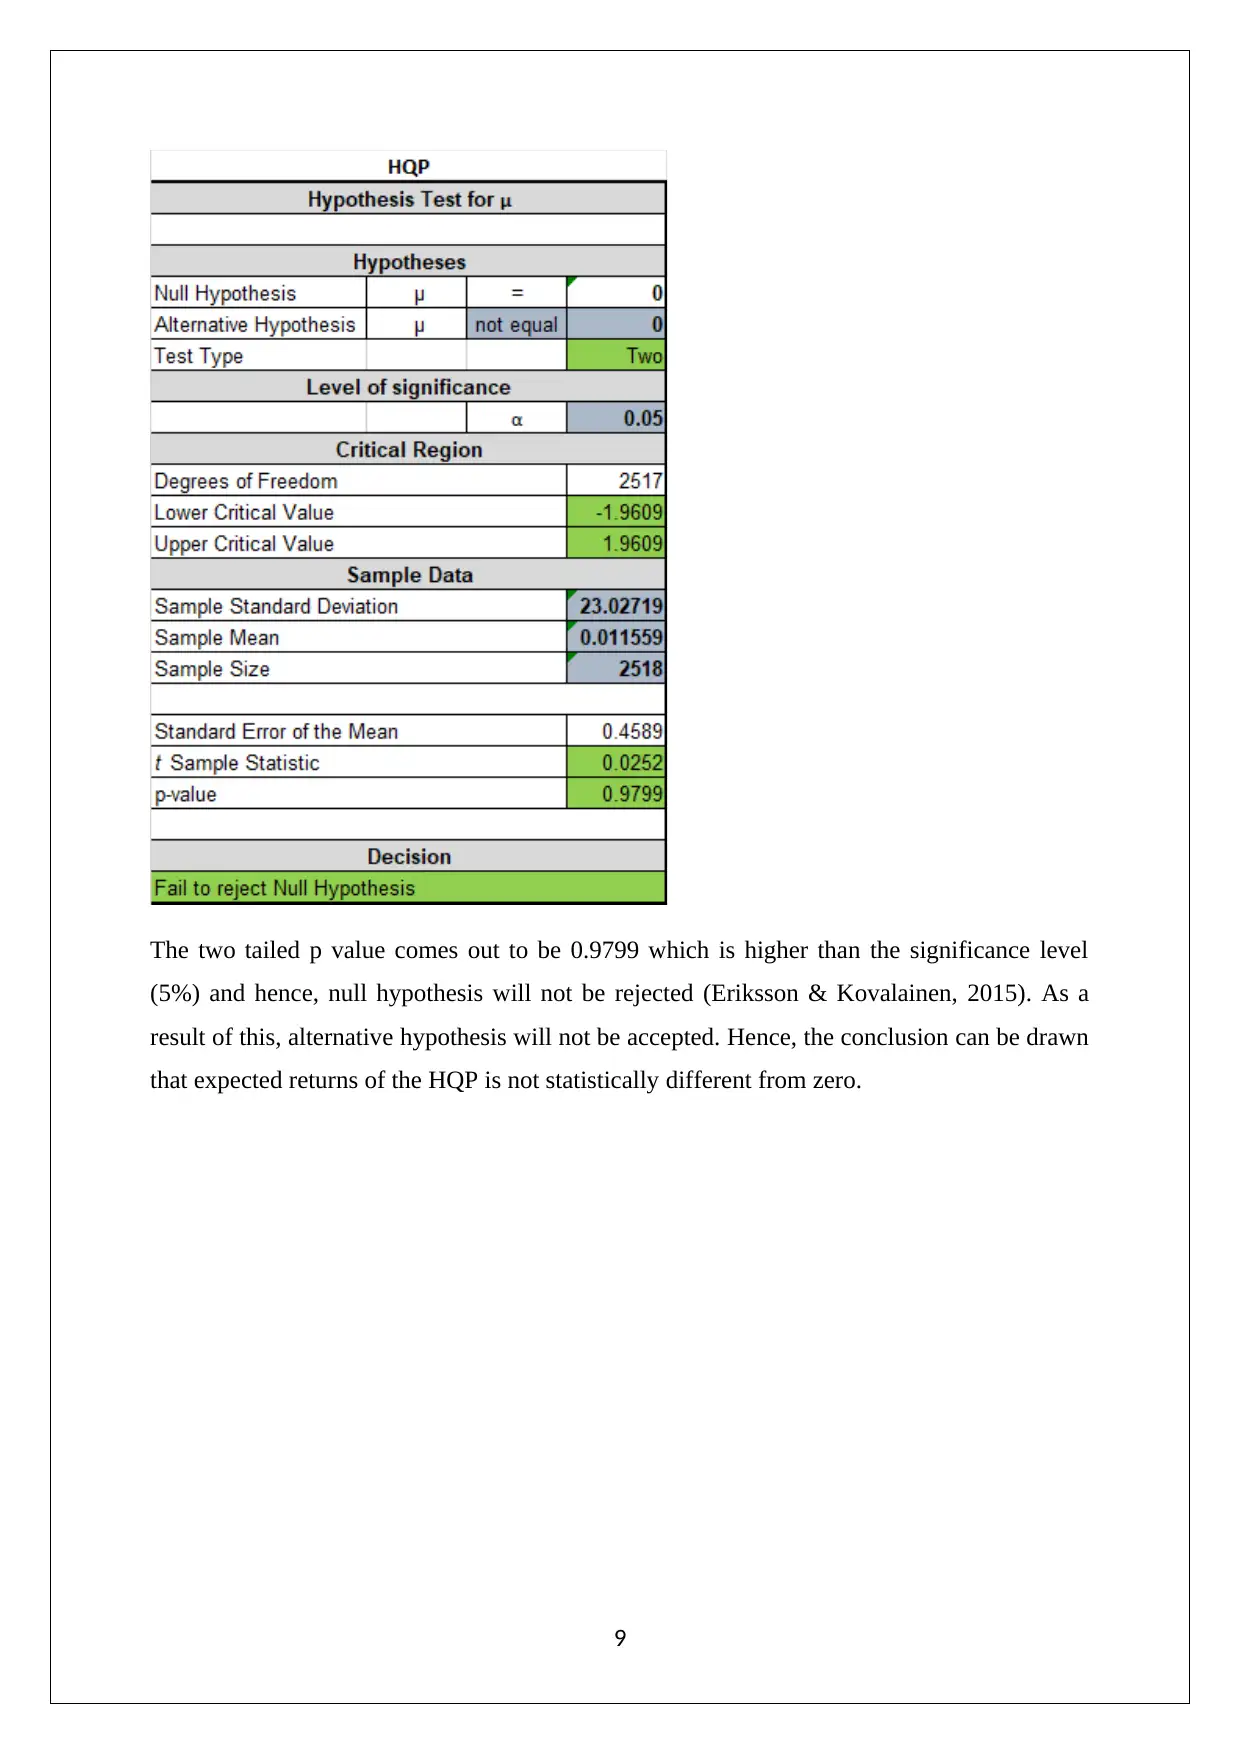
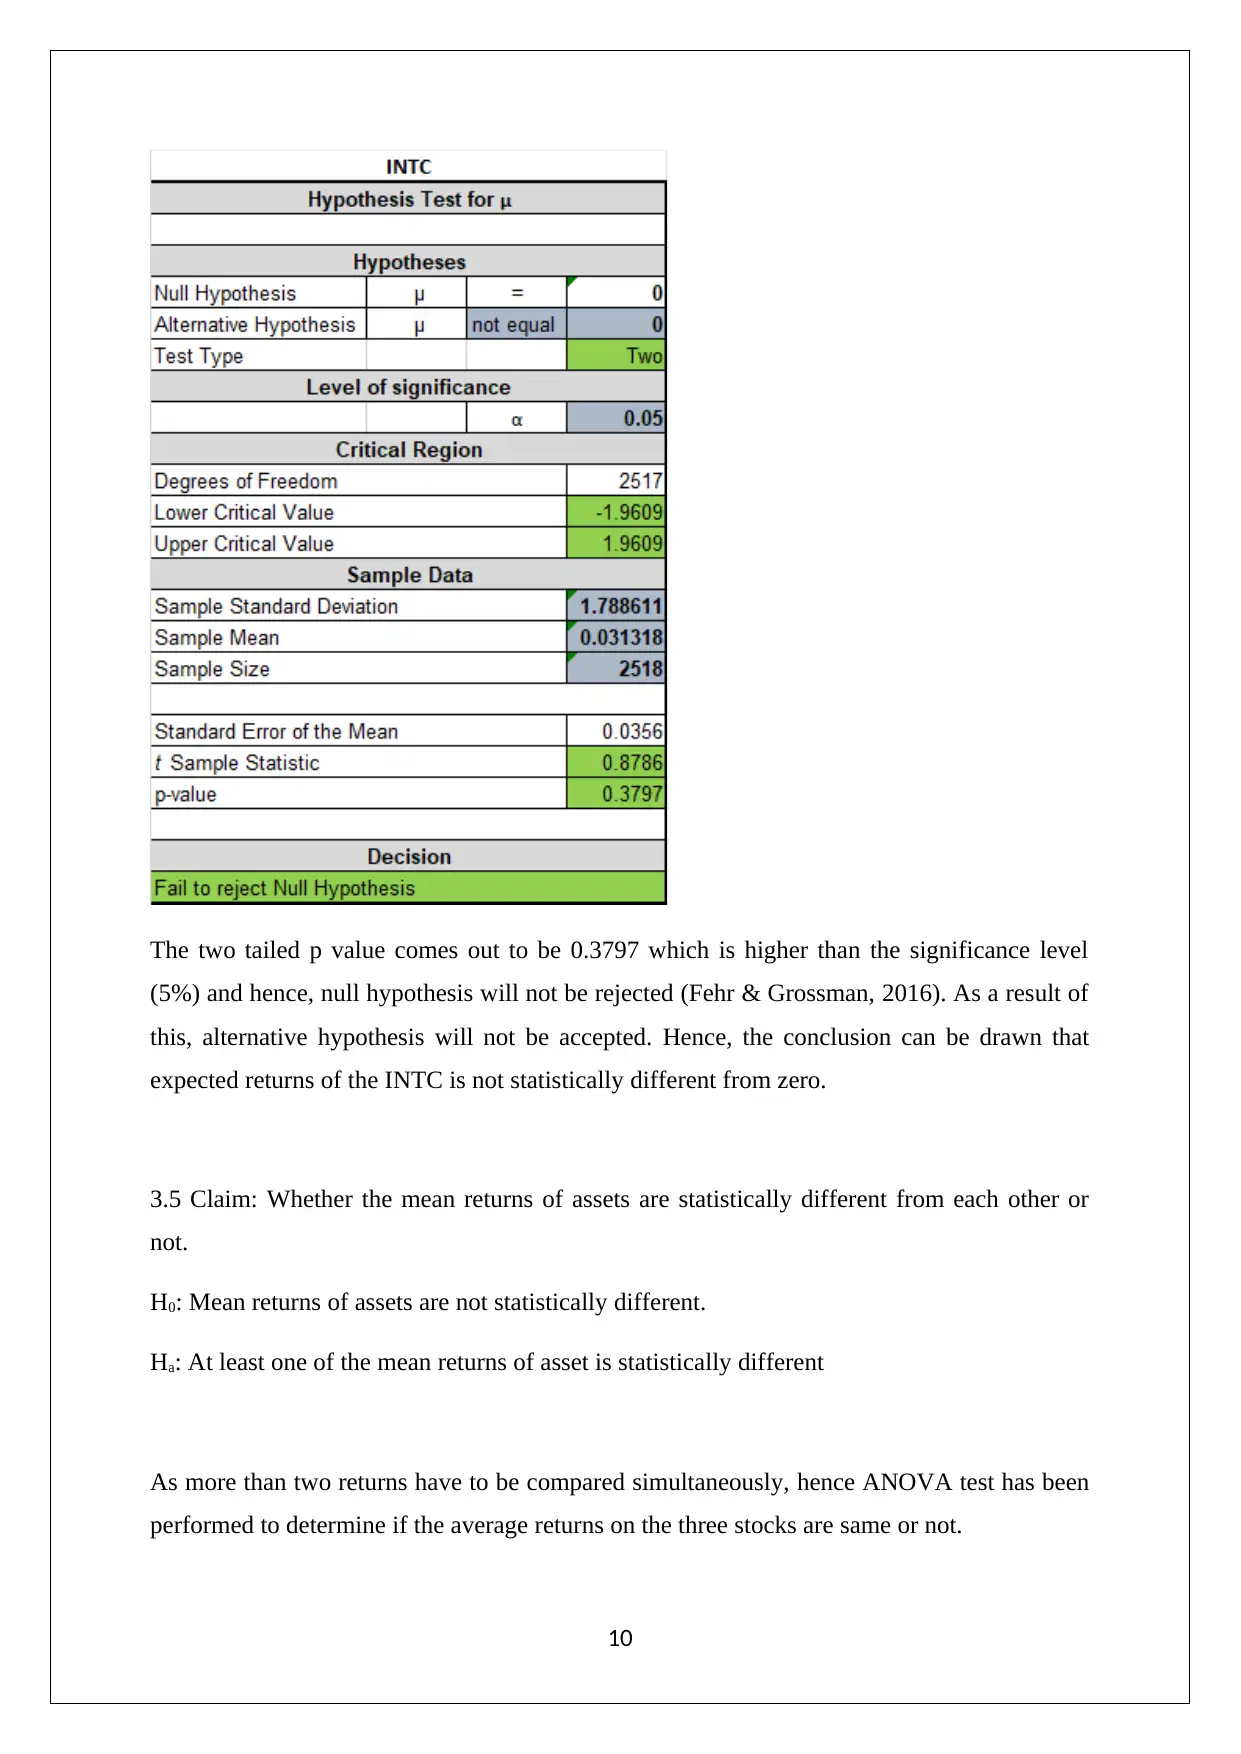
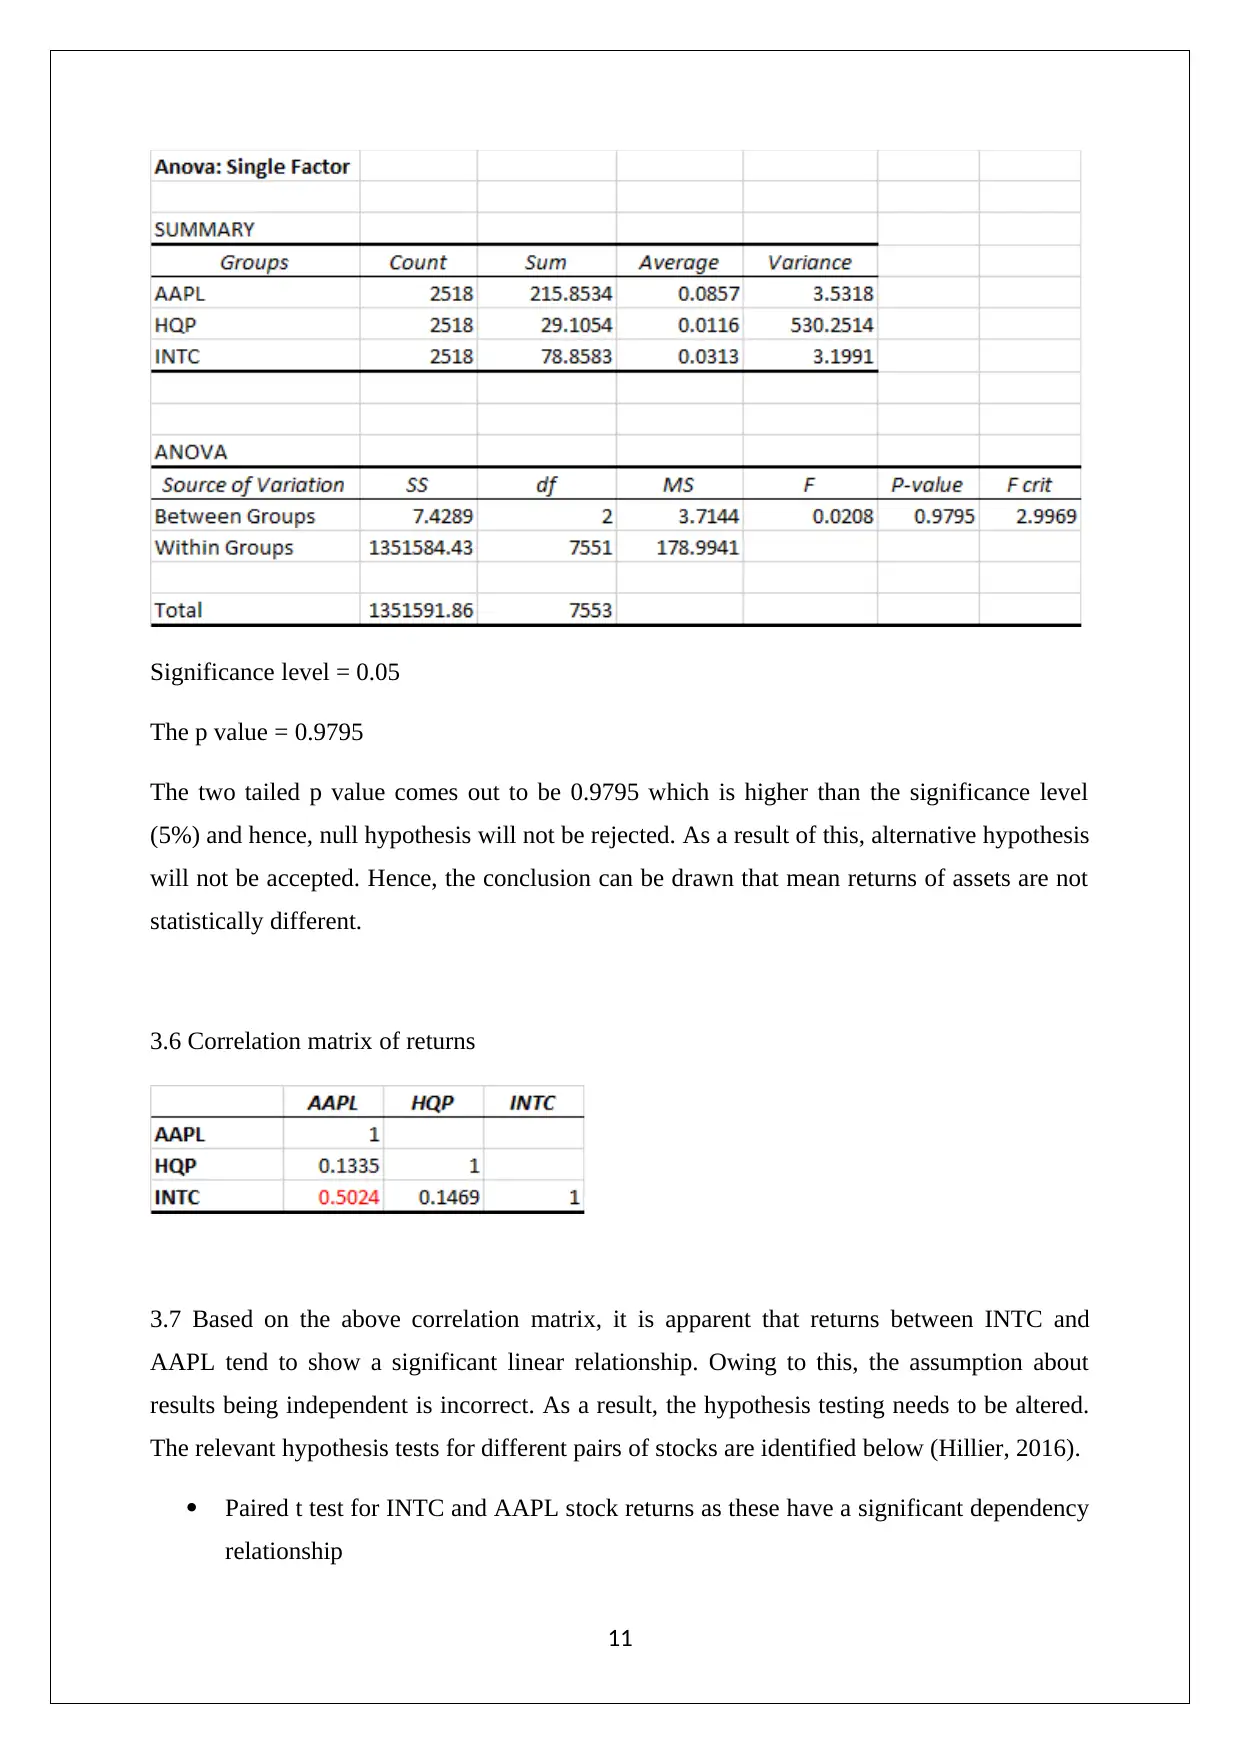
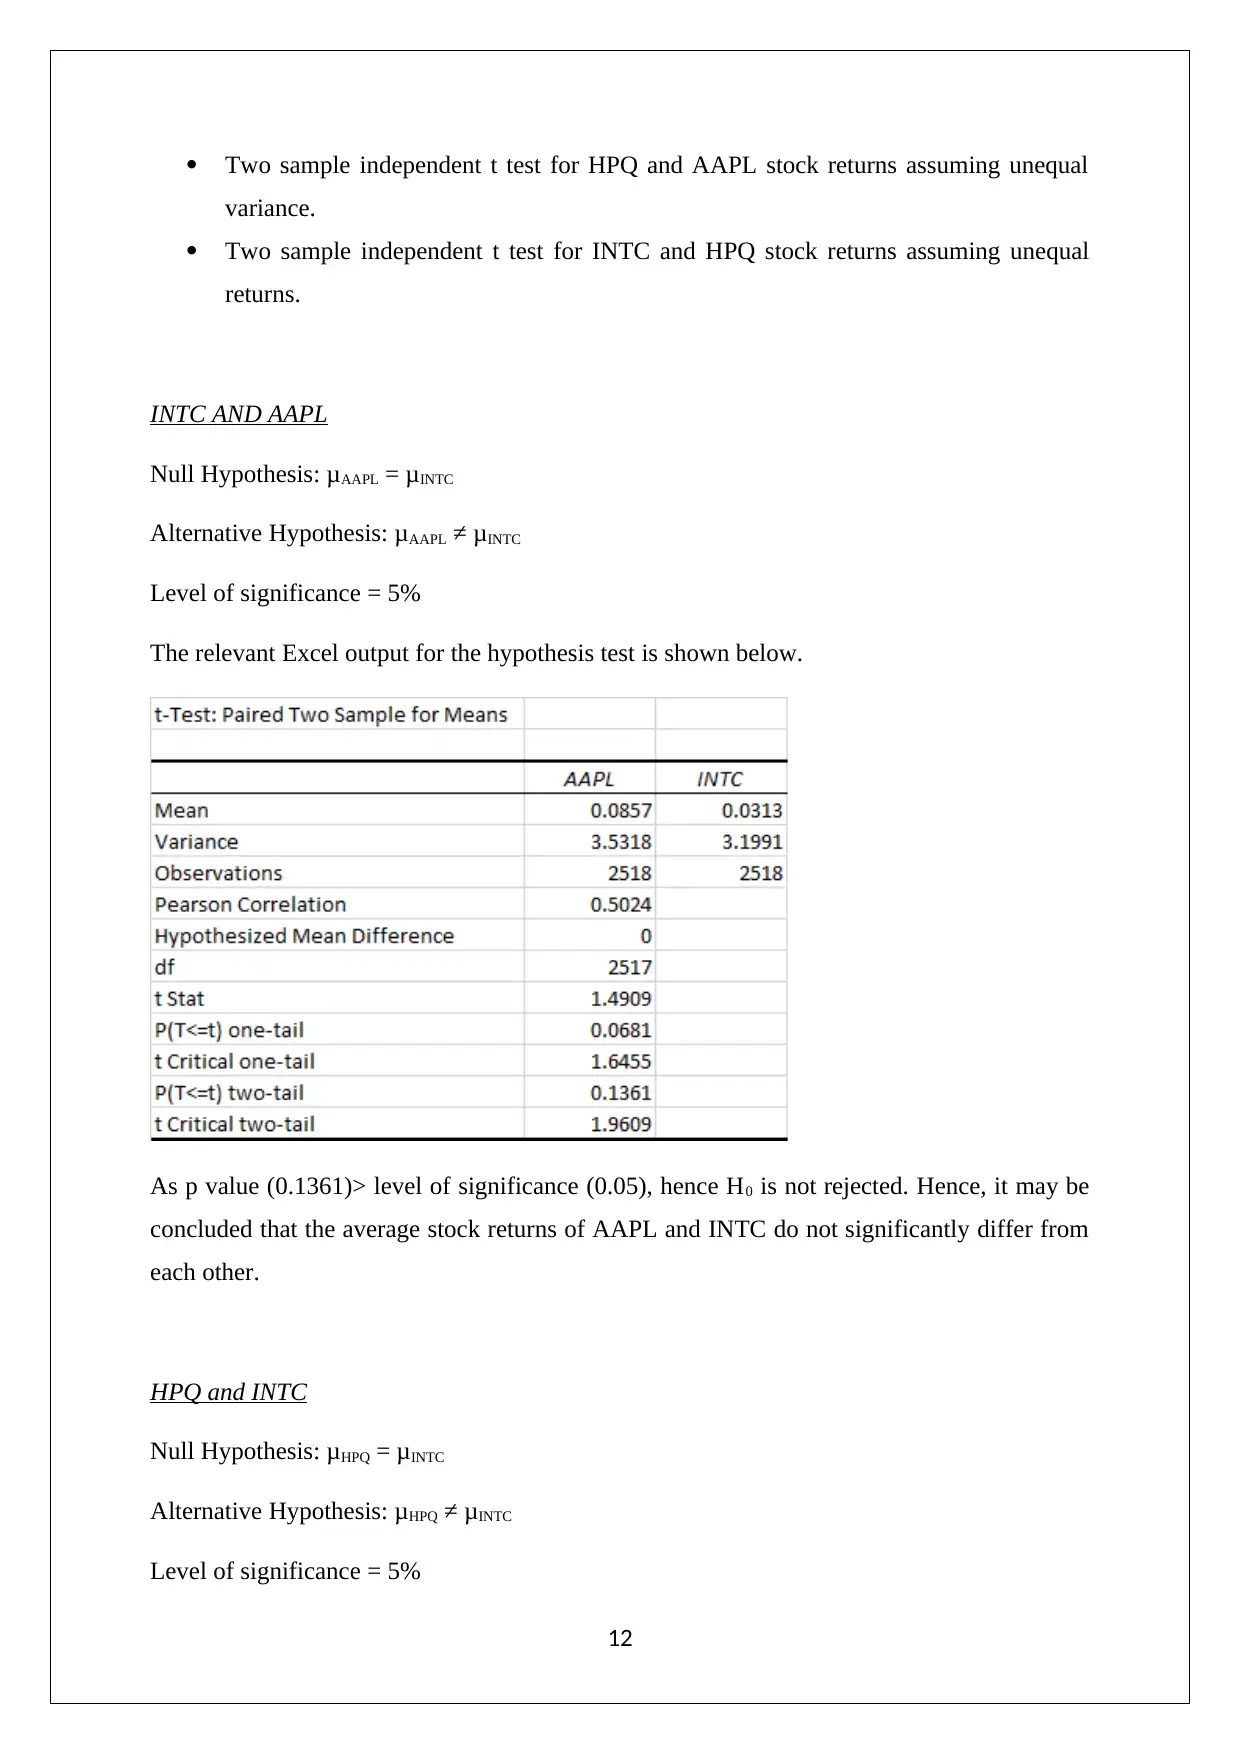
This project provides a detailed analysis of a portfolio composed of three financial assets: Apple (AAPL), Hewlett Packard (HPQ), and Intel (INTC). It includes plotting the prices of each asset over time, calculating and plotting returns, creating histograms of return series with descriptive statistics, and performing hypothesis tests to determine if the expected returns of the assets are statistically different from zero and from each other. The analysis incorporates time series plots, return calculations, kurtosis analysis, ANOVA testing, correlation matrices, and paired t-tests to assess the relationships between the assets. The project concludes with an objective function and optimal weight calculation for a two-stock portfolio consisting of AAPL and INTC, aiming to maximize returns per unit of risk, subject to constraints. The analysis also discusses the limitations of assuming a normal distribution for stock prices due to various market factors.
Document Page
BASIC BUSINESS STATISTICS
STUDENT ID:
[Pick the date]
tabler-icon-diamond-filled.svg

Paraphrase This Document

Need a fresh take? Get an instant paraphrase of this document with our AI Paraphraser
Document Page
PART 3: The Analysis
3.1 Time series for price of each of the assets
Comment: It is evident that during the 10 year period the stock has been on the broad
uptrend and has become almost 8x the value at the starting of the period. This clearly
indicates that the company has been a significant wealth creator for the shareholders. The
jump from $ 100 to$ 200 has been witnessed during the period 2016-2018. The stock saw
some minor corrections in two years namely 2013 and 2015 when the annual returns were
negative. Owing to a broad upward trend, the volatility in prices is not very high.
2
Document Page
Comment: There is no consistent or broad pattern which can be applied to the stock for the
overall period of 10 years. This is because the stock has been extremely volatile and has seen
wild swings on both sides which has not been productive for most investors. Owing to the
global financial crisis, the stock dropped from a price of $ 10 to $ 2 within a span of six
months. However, it then recovered and by 2010 it was trading $ 15. However, by 2011, the
stock was back of almost zero. This continued for a couple of years but the real recovery in
the stock has been seen after 2016.
3
Document Page
Comment: There is a broad uptrend visible in Intel stock during the period under
consideration. The initial correction of about 50% witnessed during 2008-2009 may be
attributed to the global financial crisis. From the level fo $ 11 witnessed in 2009, the stock
has grown about five times during the concerned period. A major surge in the stock price has
been seen from 2017 onwards. Also, during the given period of ten years, there has been no
significant correction that has been observed in the stock price owing to which volatility is
quite low.
3.2 Returns has been computed for each of the asset with the help of provided formula and is
represented in excel spreadsheet.
Time series plot of returns
4
tabler-icon-diamond-filled.svg

Paraphrase This Document

Need a fresh take? Get an instant paraphrase of this document with our AI Paraphraser
Document Page
3.3 Histogram of return series along with the descriptive statistics is shown below.
5
Document Page
6
Document Page
For all the stock returns, the kurtosis value exceed 3 in a significant manner. This implies that
the peak of the normal distribution graph is exceptionally thin. This is particularly true for
HPQ stock whose kurtosis is higher than 50 and hence the peak would be exceptionally thin
and perhaps a line only (Flick,2015).
7
tabler-icon-diamond-filled.svg

Paraphrase This Document

Need a fresh take? Get an instant paraphrase of this document with our AI Paraphraser
Document Page
3.4 Claim: Whether the expected returns of the asset is statistically different from zero or not.
The two tailed p value comes out to be 0.0222 which is lower than the significance level (5%)
and hence, null hypothesis will be rejected. As a result of this, alternative hypothesis will be
accepted. Hence, the conclusion can be drawn that expected returns of the AAPL is
statistically different from zero.
8
Document Page
The two tailed p value comes out to be 0.9799 which is higher than the significance level
(5%) and hence, null hypothesis will not be rejected (Eriksson & Kovalainen, 2015). As a
result of this, alternative hypothesis will not be accepted. Hence, the conclusion can be drawn
that expected returns of the HQP is not statistically different from zero.
9
Document Page
The two tailed p value comes out to be 0.3797 which is higher than the significance level
(5%) and hence, null hypothesis will not be rejected (Fehr & Grossman, 2016). As a result of
this, alternative hypothesis will not be accepted. Hence, the conclusion can be drawn that
expected returns of the INTC is not statistically different from zero.
3.5 Claim: Whether the mean returns of assets are statistically different from each other or
not.
H0: Mean returns of assets are not statistically different.
Ha: At least one of the mean returns of asset is statistically different
As more than two returns have to be compared simultaneously, hence ANOVA test has been
performed to determine if the average returns on the three stocks are same or not.
10
tabler-icon-diamond-filled.svg

Paraphrase This Document

Need a fresh take? Get an instant paraphrase of this document with our AI Paraphraser
Document Page
Significance level = 0.05
The p value = 0.9795
The two tailed p value comes out to be 0.9795 which is higher than the significance level
(5%) and hence, null hypothesis will not be rejected. As a result of this, alternative hypothesis
will not be accepted. Hence, the conclusion can be drawn that mean returns of assets are not
statistically different.
3.6 Correlation matrix of returns
3.7 Based on the above correlation matrix, it is apparent that returns between INTC and
AAPL tend to show a significant linear relationship. Owing to this, the assumption about
results being independent is incorrect. As a result, the hypothesis testing needs to be altered.
The relevant hypothesis tests for different pairs of stocks are identified below (Hillier, 2016).
Paired t test for INTC and AAPL stock returns as these have a significant dependency
relationship
11
Document Page
Two sample independent t test for HPQ and AAPL stock returns assuming unequal
variance.
Two sample independent t test for INTC and HPQ stock returns assuming unequal
returns.
INTC AND AAPL
Null Hypothesis: μAAPL = μINTC
Alternative Hypothesis: μAAPL ≠ μINTC
Level of significance = 5%
The relevant Excel output for the hypothesis test is shown below.
As p value (0.1361)> level of significance (0.05), hence H0 is not rejected. Hence, it may be
concluded that the average stock returns of AAPL and INTC do not significantly differ from
each other.
HPQ and INTC
Null Hypothesis: μHPQ = μINTC
Alternative Hypothesis: μHPQ ≠ μINTC
Level of significance = 5%
12
chevron_up_icon
1 out of 17
circle_padding
hide_on_mobile
zoom_out_icon
[object Object]