ICT_706: E-Commerce Sales Data Analysis and Prediction with Python
VerifiedAdded on 2024/06/04
|23
|3117
|182
Report
AI Summary
This report details an analysis of e-commerce sales data using Python to address declining profitability in a company that leads in various product segments like books, household items, gadgets, and clothes. The analysis employs regression models to predict future sales trends and identify key areas for improvement. The methodology includes data mining and clustering techniques to understand customer demands and prioritize high-demand products. The report uses both linear and polynomial regression models, achieving approximately 92% accuracy in sales predictions. Recommendations include improving delivery speed, prioritizing specific toy products, removing low-demand items, and continuous system tracking to enhance overall efficiency and profitability. Python code snippets are provided to illustrate the implementation of the analysis.

ICT_706
Paraphrase This Document
Need a fresh take? Get an instant paraphrase of this document with our AI Paraphraser
Executive Summary
There is an E- Commerce Company. This E-commerce company currently faces loss in their business.
This company is market leader in different product segments. Product segments are books, household’s
items, latest gadgets, and cloths. Everyday competition is increasing. The company faces many issues.
And slowly company profile is decreases.
So to identify the company problem we need an expert who will understand the data and define some
relation between them by analyzing some pattern or methodology used in this report. I am a data
scientist of the company, the director wishes me to identify or analyze the data of previous month sale.
They want some great idea from me like which field is need to be target? What are the customer
demands? Which product will give higher priority? Furthermore, the company wants some great plan
which will help in improving more profit and again have control over the market.
Here we use python programming. In python programming, some process is use to extract the data.
Here regression model is used that will help in to identify the sale of next month and also help in to
make a plan to improve profit.
Dataset is created from starting which has some desired attributes. Also, this dataset helps in developing
models and in analyzing the things. Some regressions are used on the dataset to train the data which
will help in predicting more exact result. At last, the prediction is very accurate which approximately
92% is. This approximation is much more efficient.
I recommend an idea to the company which will include high speed to deliver the data and also give
priority to selected toys which will help in generating more profits also remove those toys from stock
which do not demand more frequently. Also, track the whole system to improve efficiency.
1
Table of Contents
Executive Summary.....................................................................................................................................2
Assumptions taken for the analysis of this are:...........................................................................................5
Company background..................................................................................................................................6
Introduction.................................................................................................................................................7
Research Methodology................................................................................................................................8
Methodology types:................................................................................................................................8
Quantitative Research:........................................................................................................................8
Qualitative Research................................................................................................................................8
Analytical Findings.....................................................................................................................................10
Dataset:.................................................................................................................................................10
Data mining:..........................................................................................................................................11
Data clustering.......................................................................................................................................11
Predictive Modeling...................................................................................................................................12
Linear Regression Model.......................................................................................................................12
Polynomial Regression Model...............................................................................................................13
Final Prediction Model...........................................................................................................................14
Python Code..........................................................................................................................................15
Recommendations from Analysis..............................................................................................................16
Recommendation One...........................................................................................................................16
Recommendation Two..........................................................................................................................16
Recommendation Three........................................................................................................................16
Recommendation Four..........................................................................................................................16
Recommendations for the Company.........................................................................................................17
Implementation plan for the recommendations.......................................................................................18
Python Code for the Test and Training Analysis........................................................................................19
Conclusion:................................................................................................................................................21
References.................................................................................................................................................22
Appendix...................................................................................................................................................23
Implemented Python code for the data analysis...................................................................................23
2
⊘ This is a preview!⊘
Do you want full access?
Subscribe today to unlock all pages.
Trusted by 1+ million students worldwide
List of Figures
Figure 1: Toys Sales Dataset......................................................................................................................10
Figure 2: Linear regression Model.............................................................................................................12
Figure 3: Polynomial regression model.....................................................................................................13
Figure 4: Final Prediction Graph................................................................................................................14
Figure 5: Fitting the Graph Code................................................................................................................15
Figure 6: Python Code for Test and Training Splitting................................................................................19
Figure 7: Plot for the Training Data...........................................................................................................20
Figure 8: Plot for the Test Data..................................................................................................................20
3
Paraphrase This Document
Need a fresh take? Get an instant paraphrase of this document with our AI Paraphraser
Assumptions taken for the analysis of this are:
To generate desired result following assumptions are made:
Firstly, database is created using some dummy values
Toys segment is used to create dataset
Some dummy Geographical location is used to deliver the data by company.
This database contains many unique Toys from various companies
For delivery purpose, a system is used
Here a person is also needed to deliver the Toys at needed place
4
Company background
In the earlier 1994, a company was opened in USA. The selling company sells all type of Toys with initial
Release to the Golden DC Period dating 1900 to latest. At that time the company was very popular. As
the time increases the popularity of the company is also increasing. The popularity is increase because
the company has a large collection of Toys. This collection of Toys was very distinctive. This store has
many Toys from antique era which is tough to find. Due to this reasons this company become very
famous in their region.
As the technology increase, this company was changed into E-Commerce Company. This E-Commerce
company sells Toys on the internet. In starting the company faces many issues but due to their
dedication and the hard work, the company again gains popularity. This company had done many
struggles but the company always provide good quality product. The company gets many orders. As
technology becomes advanced, the company starts facing many problems.
Now coming companies started to get power over the market. So to get have power over the market,
the company started to vend more products like Toys, Latest gadgets, clothes, and some household
items. This idea was to help the company in achieving the success.
Now, more E-Commerce Company will emerge this will improve competition in the market. So again this
will destroy the company popularity. The profile of the company is decreases.
The company faces may issues because of the increasing competition from different companies. Now
the company starting to sell product at lower cost this will affect the company. Due to this company
faces failure in finance. So company starts firing the employees from different field.
To gain popularity the company takes help from some expert. The expert will analysis the data and
understands the company profile. The expert will find the reason why company fails.
5
⊘ This is a preview!⊘
Do you want full access?
Subscribe today to unlock all pages.
Trusted by 1+ million students worldwide
Introduction
E-commerce Company is virtually establishing company. This company helps the user to get desired
product. Here this report show E-commerce company which will handle various kind of product such as
books, toys, clothes, gadgets and some household items. Now this company faces many issues.
Company profit is decreases every day (Colla and Lapoule, 2012).
Now many E-commerce company which sells same product, this will increase the competition in the
market. The company wants good quality product and high productivity but increasing high competition,
they fail to achieve their goal. For understanding, the costumers demand it is necessary to develop a
good methodology. In this case, to filter out many business problems, I use data analytics technique.
Here I use some data mining approaches to identify the data and data processing is also used. The above
methodology and techniques help the company to increase the productivity and performance. This will
also help in increasing the profit (Carmona et al., 2012).
Here we do a complete study to focus on those areas and the Toys which are necessary for sales. Here in
this Python programming is used for the analysis purpose. In this comparison is done between the past
sale and the present sale.
6
Paraphrase This Document
Need a fresh take? Get an instant paraphrase of this document with our AI Paraphraser
Research Methodology
For any organization, business, and institute, this methodology is necessary. Research methodology is a
set of various kinds of information and data. This information is very useful to develop a methodology
for the business. In any surveys, interview and publication researches do only research methodology.
The first thing is to identify the problem so that it will give suggestions. It will take data from various
sources and apply optimization process to optimize the information. Here company uses research
methodology liter out the problems so for this company follow five steps.
The five steps are:
1. Analysis the problem
2. Clarified the problem
3. Identify all the requirement need to answer the problem
4. Apply data optimization process
5. Do interpretation
Methodology types:
Quantitative Research:
Quantitative Research is used to identify the feelings, mind state and other factors which are
used to increase the productivity. Also, this method helps in to identify the requirement of the
company. So this method helps the company to raise the productivity. If the productivity
increases than profit is also increases. For any numerical measurement, this technique is used.
In comparison with qualitative research, quantitative information is more useful.
Advantages of Quantitative Research:
1. It will help in to analyze the data.
2. All the objectives are clear.
3. It is used for testing.
4. Analysis the data.
Disadvantages of Quantitative Research:
1. Study and any kind of experiment are unobserved.
2. It is very difficult.
Qualitative Research
This is an exploratory research. To get good product quality, this method is new. So most of
the company uses qualitative Research to get good quality product. This research also helps
7
in to improve the service quality. So overall profit will also increases. If product quality
increases then the user trust will also increases.
Advantages of Qualitative research:
1. Some assumption can be applied on the data.
2. For exploratory research it is useful.
3. Aspects are complex.
Disadvantages of Qualitative research:
1. It is not easy to get validity and reliability.
2. It will take more time
3. There are many problems like data overloading.
8
⊘ This is a preview!⊘
Do you want full access?
Subscribe today to unlock all pages.
Trusted by 1+ million students worldwide
Analytical Findings
It will help in to identify or analysis the result. It will contain many elements to find out the result.
Some of the elements are:
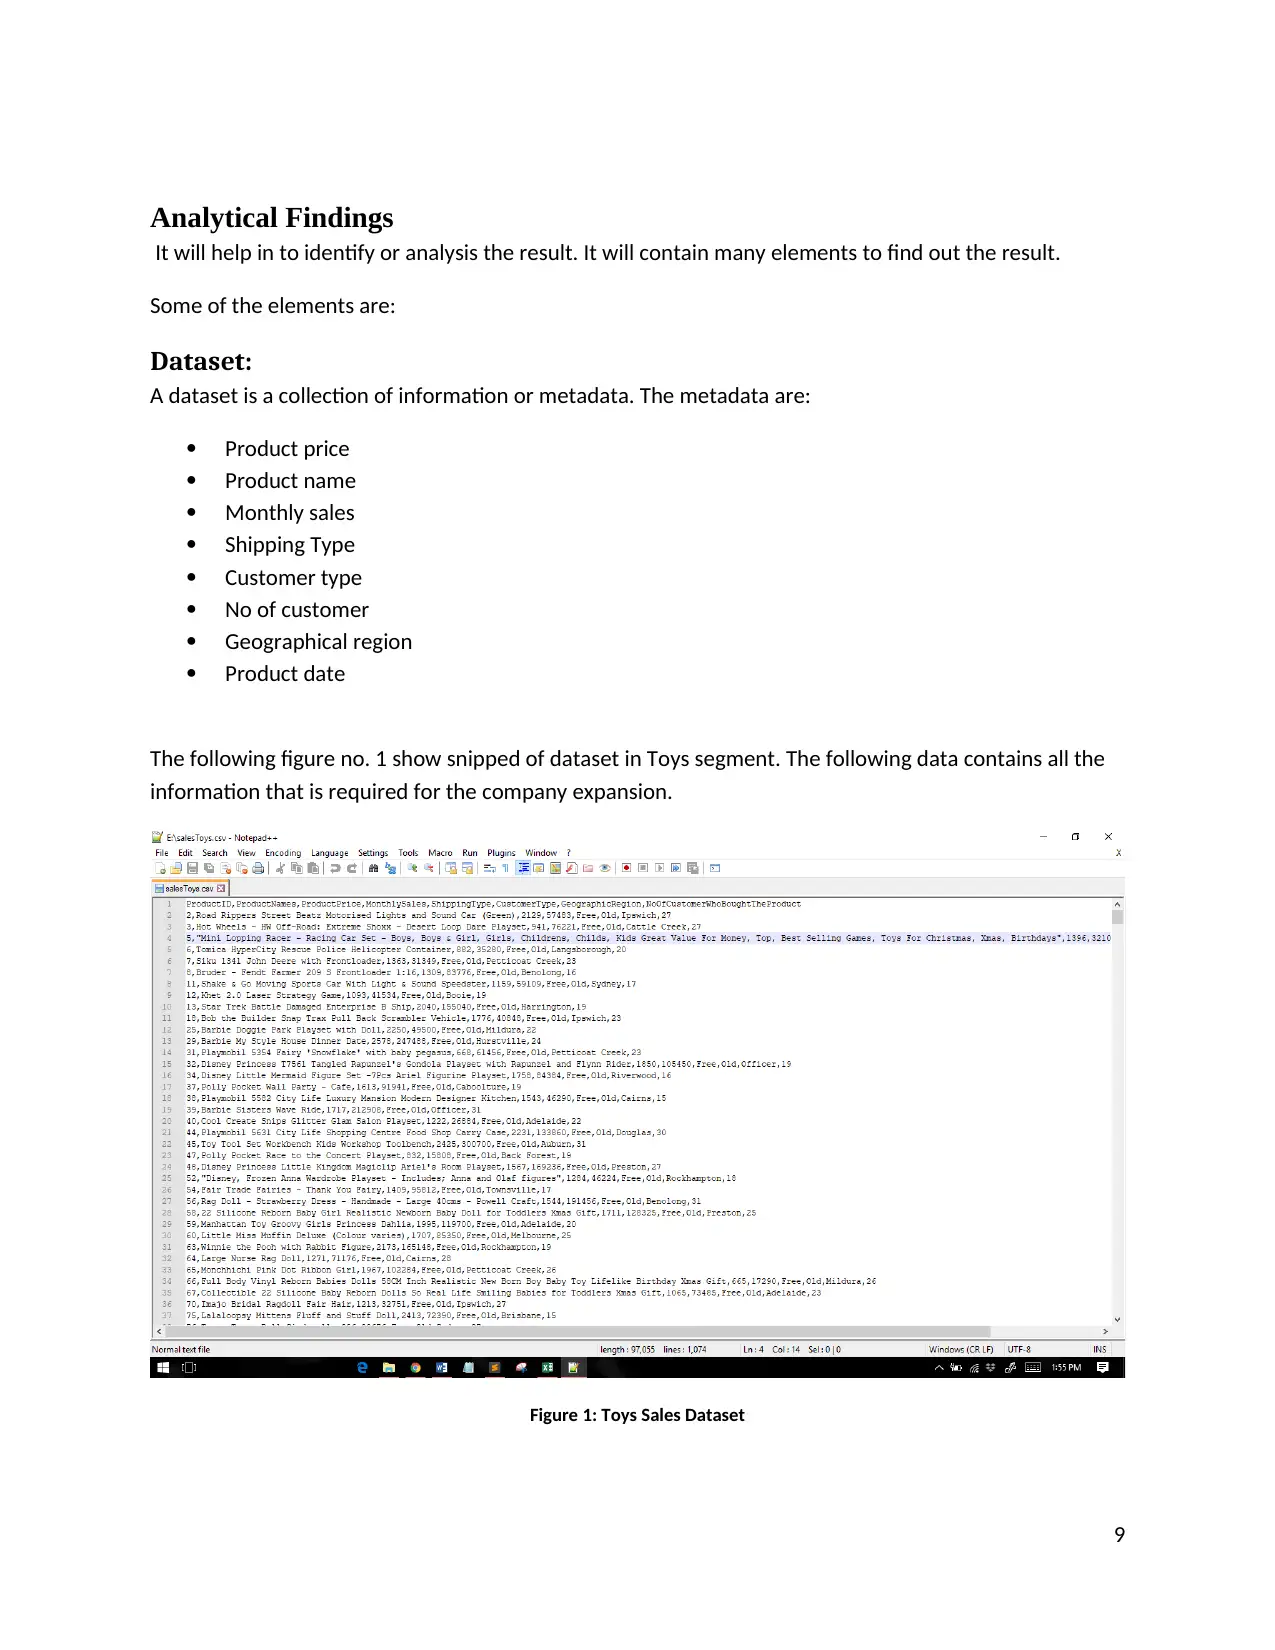
Dataset:
A dataset is a collection of information or metadata. The metadata are:
Product price
Product name
Monthly sales
Shipping Type
Customer type
No of customer
Geographical region
Product date
The following figure no. 1 show snipped of dataset in Toys segment. The following data contains all the
information that is required for the company expansion.
Figure 1: Toys Sales Dataset
9
It will help in to identify or analysis the result. It will contain many elements to find out the result.
Some of the elements are:
Dataset:
A dataset is a collection of information or metadata. The metadata are:
Product price
Product name
Monthly sales
Shipping Type
Customer type
No of customer
Geographical region
Product date
The following figure no. 1 show snipped of dataset in Toys segment. The following data contains all the
information that is required for the company expansion.
Figure 1: Toys Sales Dataset
9
Paraphrase This Document
Need a fresh take? Get an instant paraphrase of this document with our AI Paraphraser
Data mining:
This is use to filter out the necessary information. It is help in to extract the information from the
collection of data. So by using data mining, unnecessary information will be filter out (Siemens and
Baker, 2012).
Data mining can be performed in five steps:
Identify the information.
Analysis the data
Extract the data
Identify the value for the key to extract the data.
Show the result.
Data mining is help in analysis the figures and also helps in to find out the result.
For preprocessing purpose data mining is apply. Data mining is used to remove unwanted noise.
In this python programming is used. So the main motive for using data mining is to find all
necessary information and use this information for getting the result (Hand, 2012).
Data clustering
It is a collection of object having different attributes. Data cluster is necessary for parallel processing,
fault tolerance also useful in load balance (Huang and Benyoucef, 2013).
Here some schemas are used:
Choice those geographical location which is need to be focus.
Give priority to those Toys which helps to improve profit.
If the free delivery will impact the product sale or not.
Use the methods which will help in to improve the productivity.
10
Predictive Modeling
It uses the numerical data to get the result. It can be apply on any type of event. To identify the
probability of result, this model uses many classifiers.
Two types of model are used:
1. Linear Regression Model
2. Polynomial Regression Model
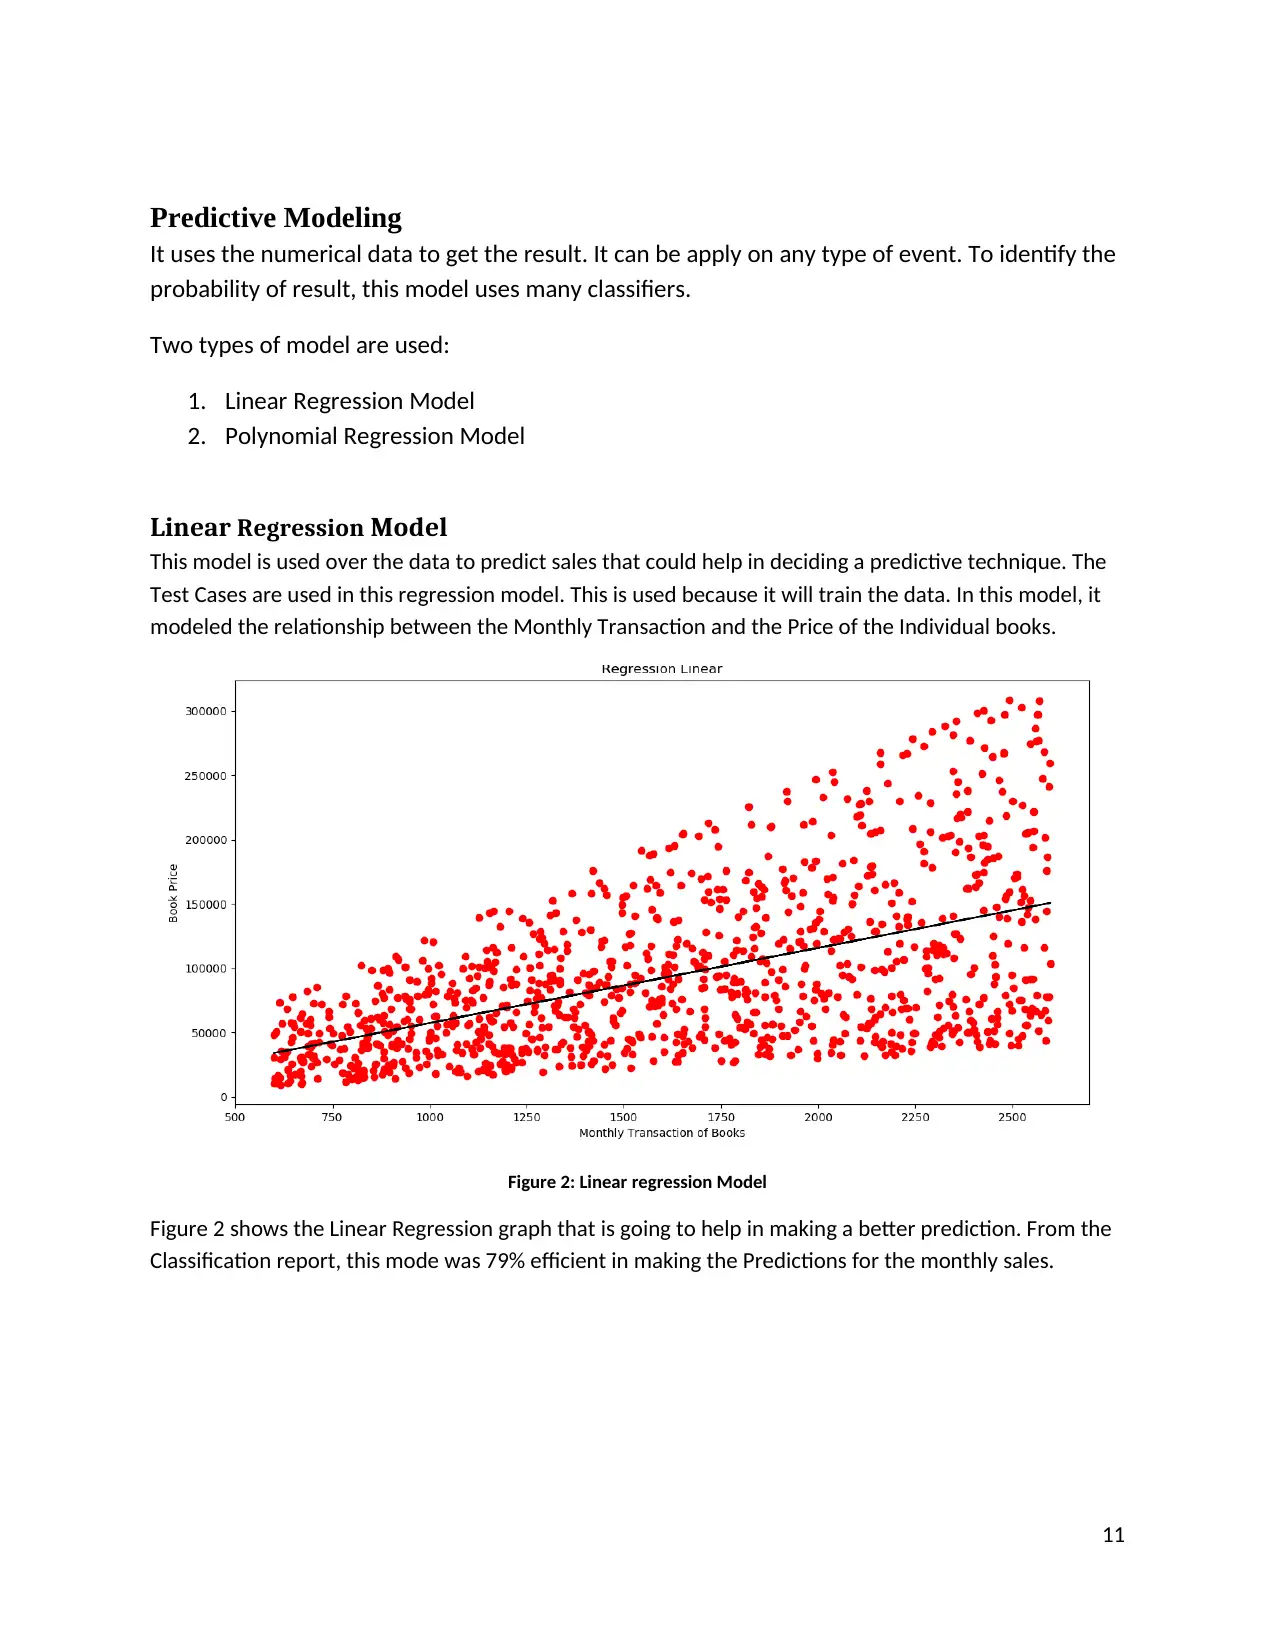
Linear Regression Model
This model is used over the data to predict sales that could help in deciding a predictive technique. The
Test Cases are used in this regression model. This is used because it will train the data. In this model, it
modeled the relationship between the Monthly Transaction and the Price of the Individual books.
Figure 2: Linear regression Model
Figure 2 shows the Linear Regression graph that is going to help in making a better prediction. From the
Classification report, this mode was 79% efficient in making the Predictions for the monthly sales.
11
It uses the numerical data to get the result. It can be apply on any type of event. To identify the
probability of result, this model uses many classifiers.
Two types of model are used:
1. Linear Regression Model
2. Polynomial Regression Model
Linear Regression Model
This model is used over the data to predict sales that could help in deciding a predictive technique. The
Test Cases are used in this regression model. This is used because it will train the data. In this model, it
modeled the relationship between the Monthly Transaction and the Price of the Individual books.
Figure 2: Linear regression Model
Figure 2 shows the Linear Regression graph that is going to help in making a better prediction. From the
Classification report, this mode was 79% efficient in making the Predictions for the monthly sales.
11
⊘ This is a preview!⊘
Do you want full access?
Subscribe today to unlock all pages.
Trusted by 1+ million students worldwide
1 out of 23
Related Documents


Your All-in-One AI-Powered Toolkit for Academic Success.
+13062052269
info@desklib.com
Available 24*7 on WhatsApp / Email
![[object Object]](/_next/static/media/star-bottom.7253800d.svg)
Unlock your academic potential
Copyright © 2020–2026 A2Z Services. All Rights Reserved. Developed and managed by ZUCOL.