ECON 1030: Business Statistics 1 - Individual Assignment Report

Verified

Added on  2022/11/25

|9
|918
|166
Report
AI Summary
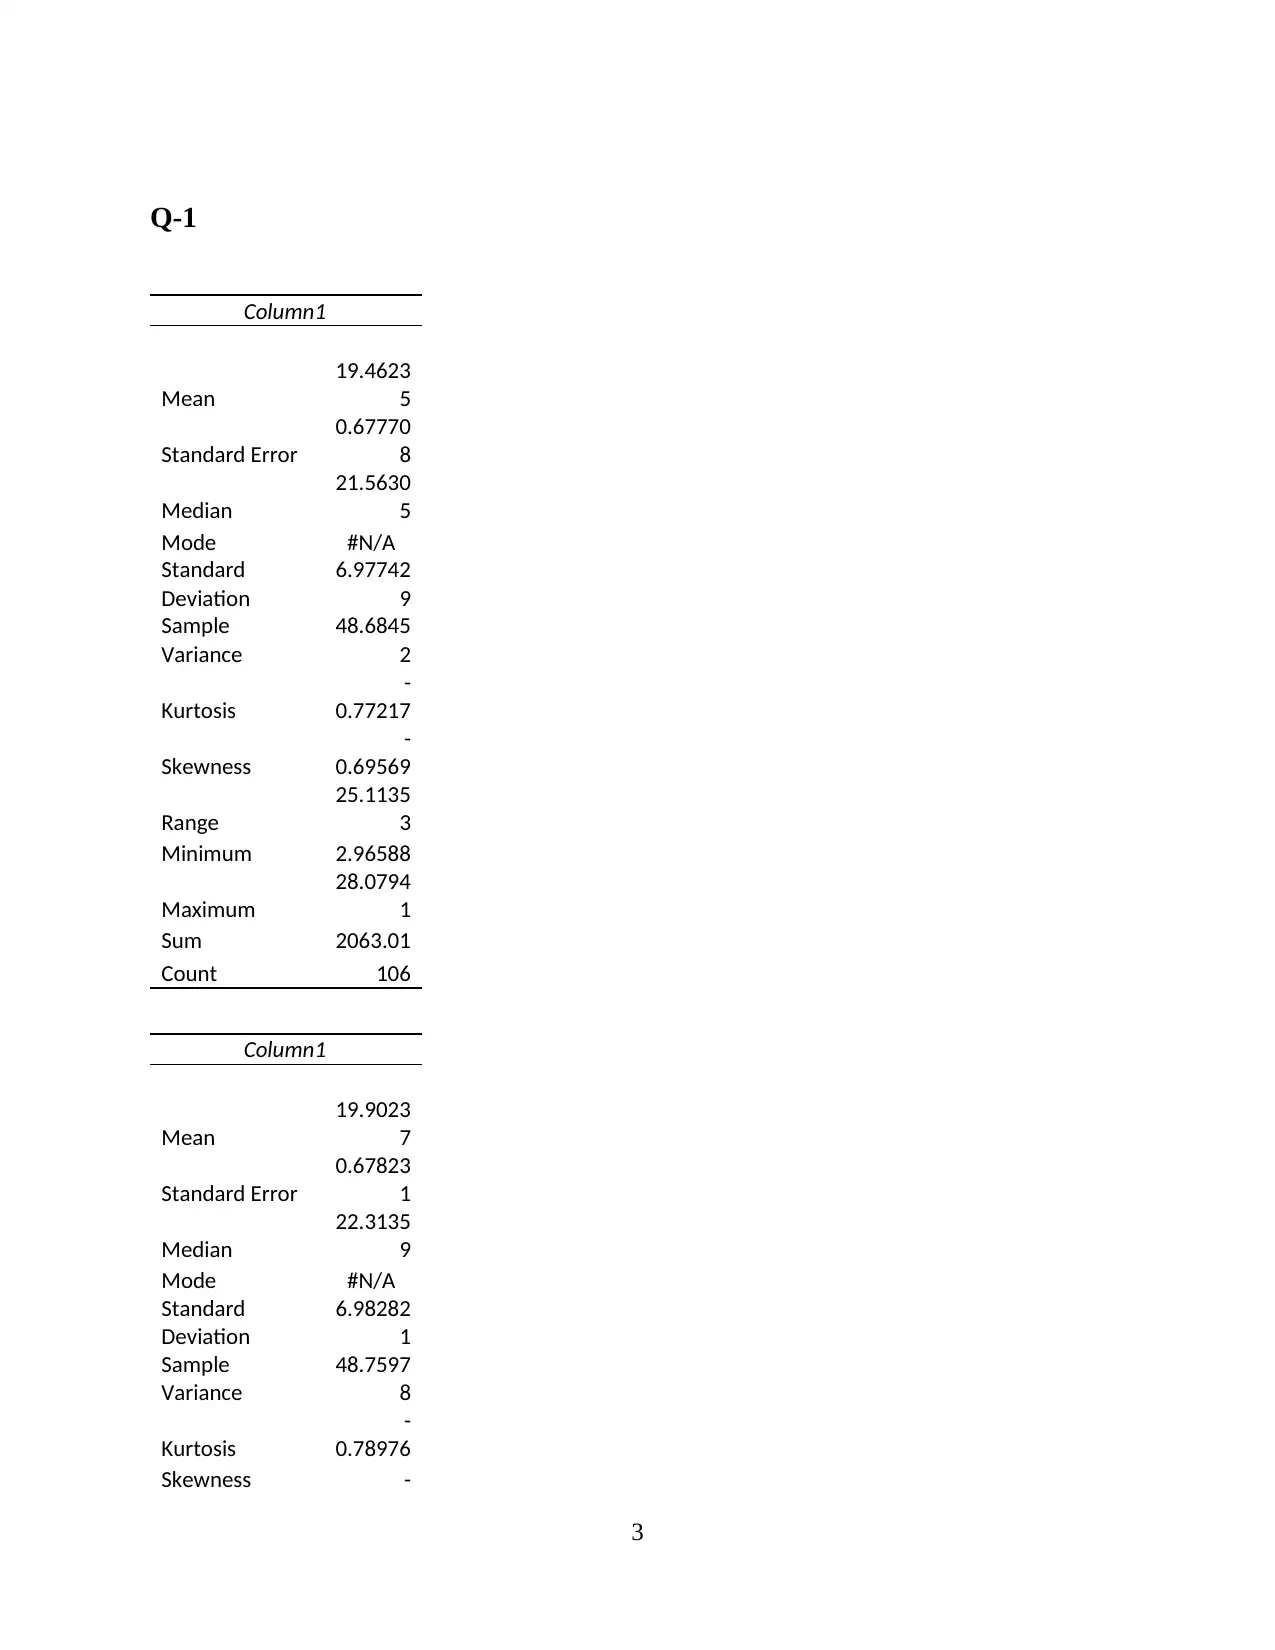
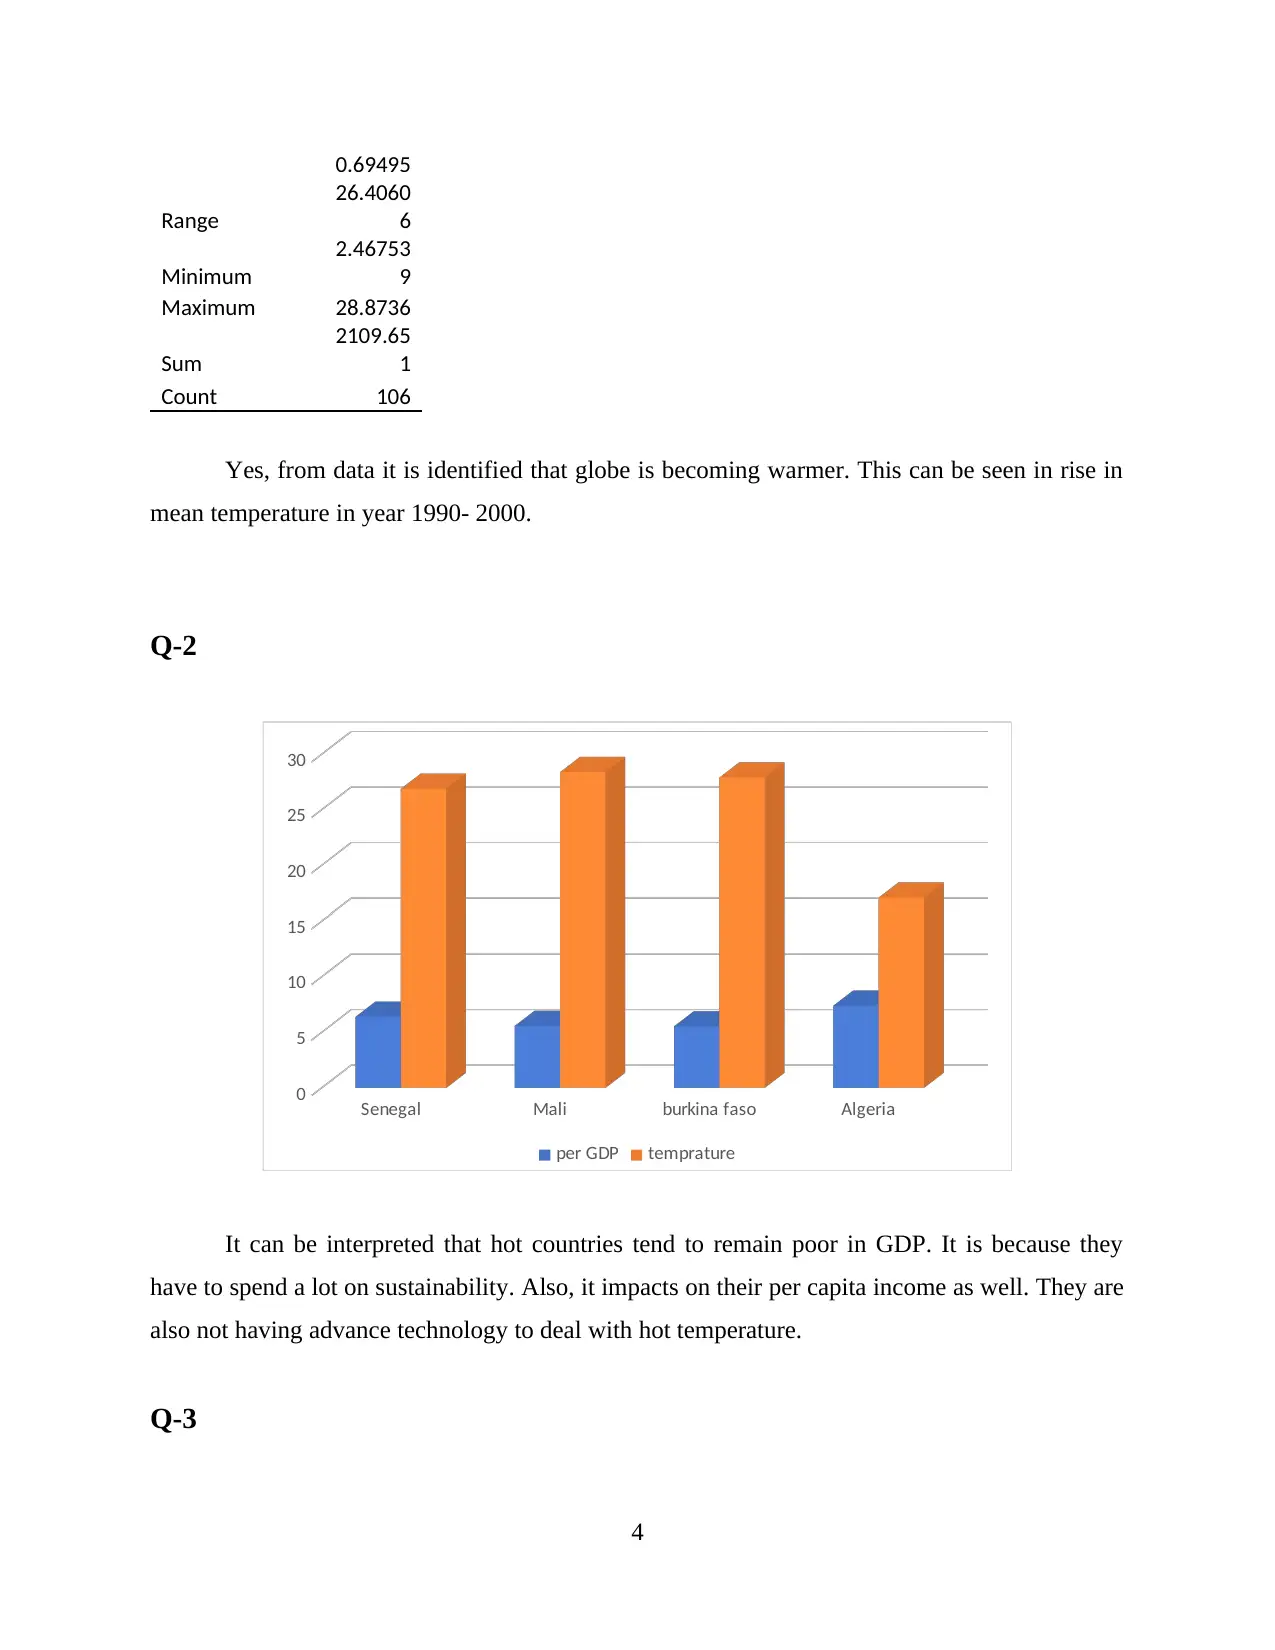
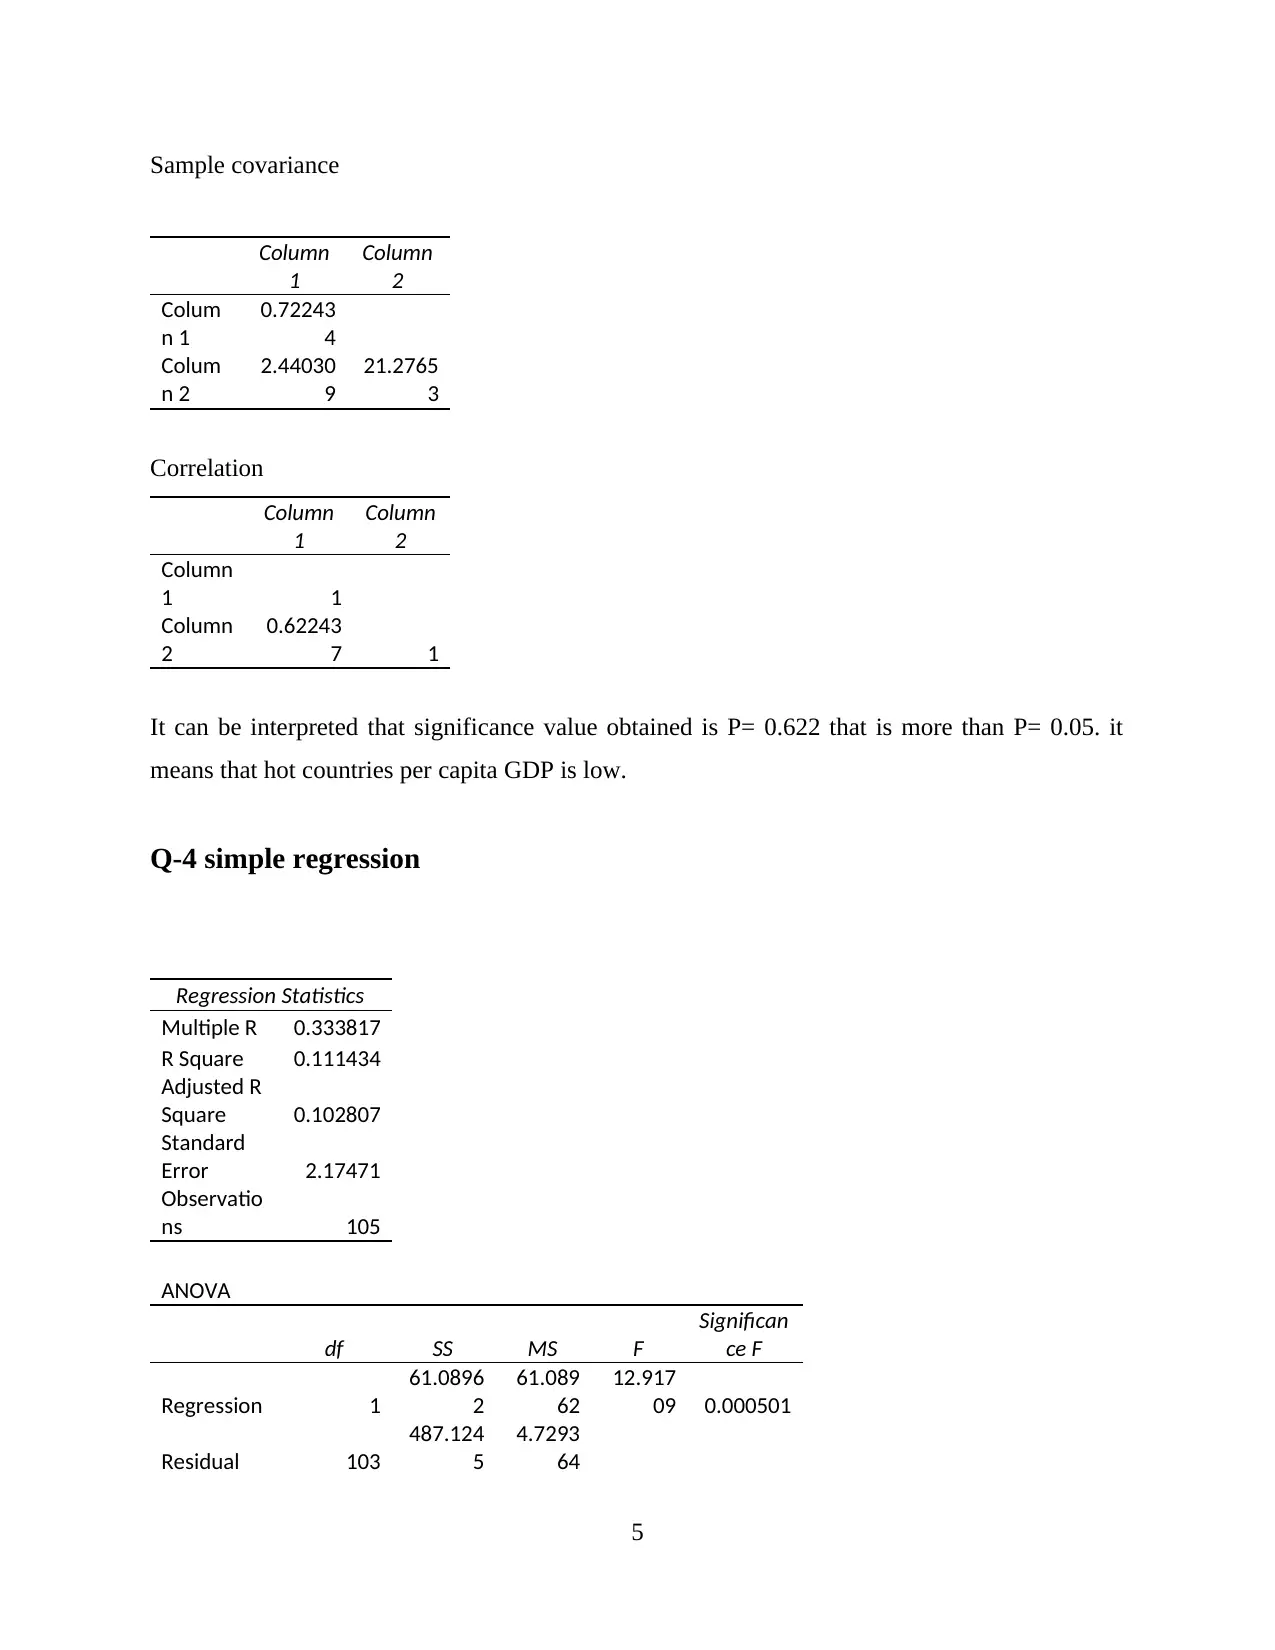
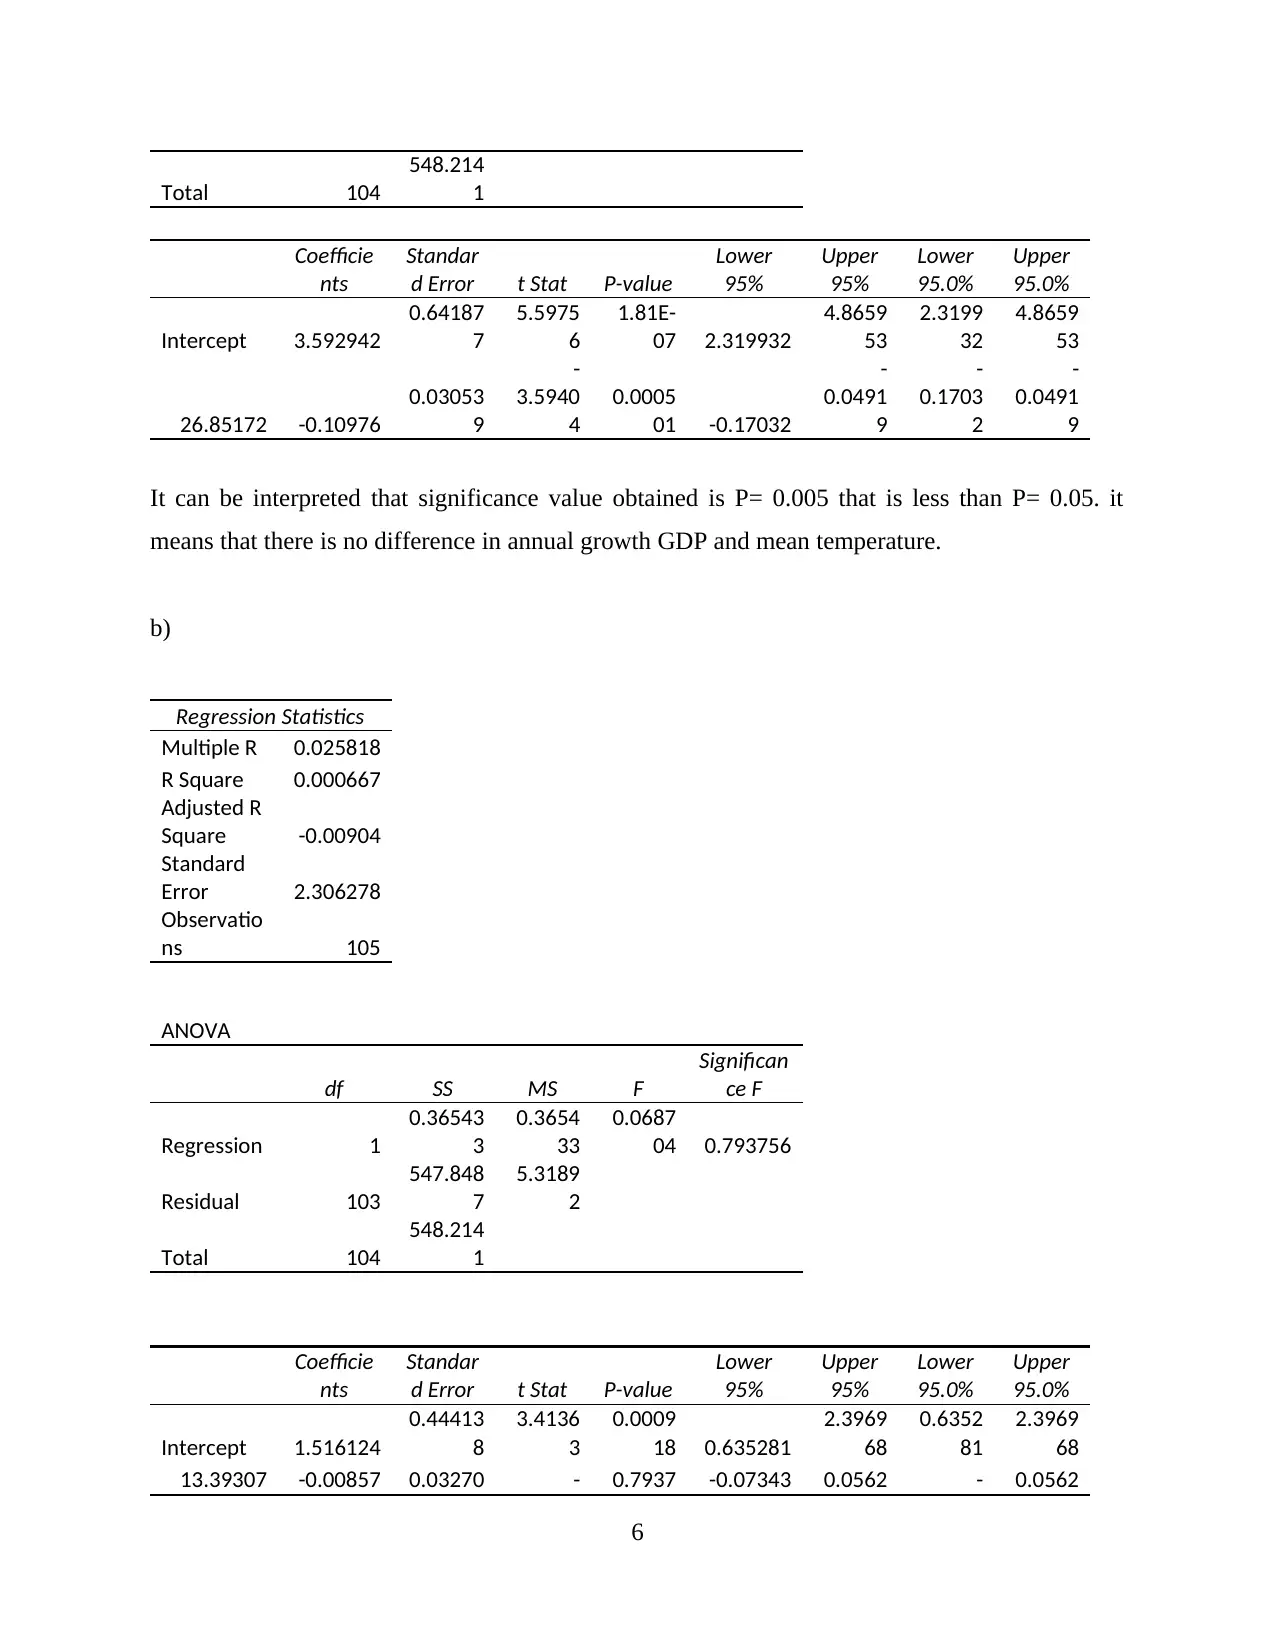
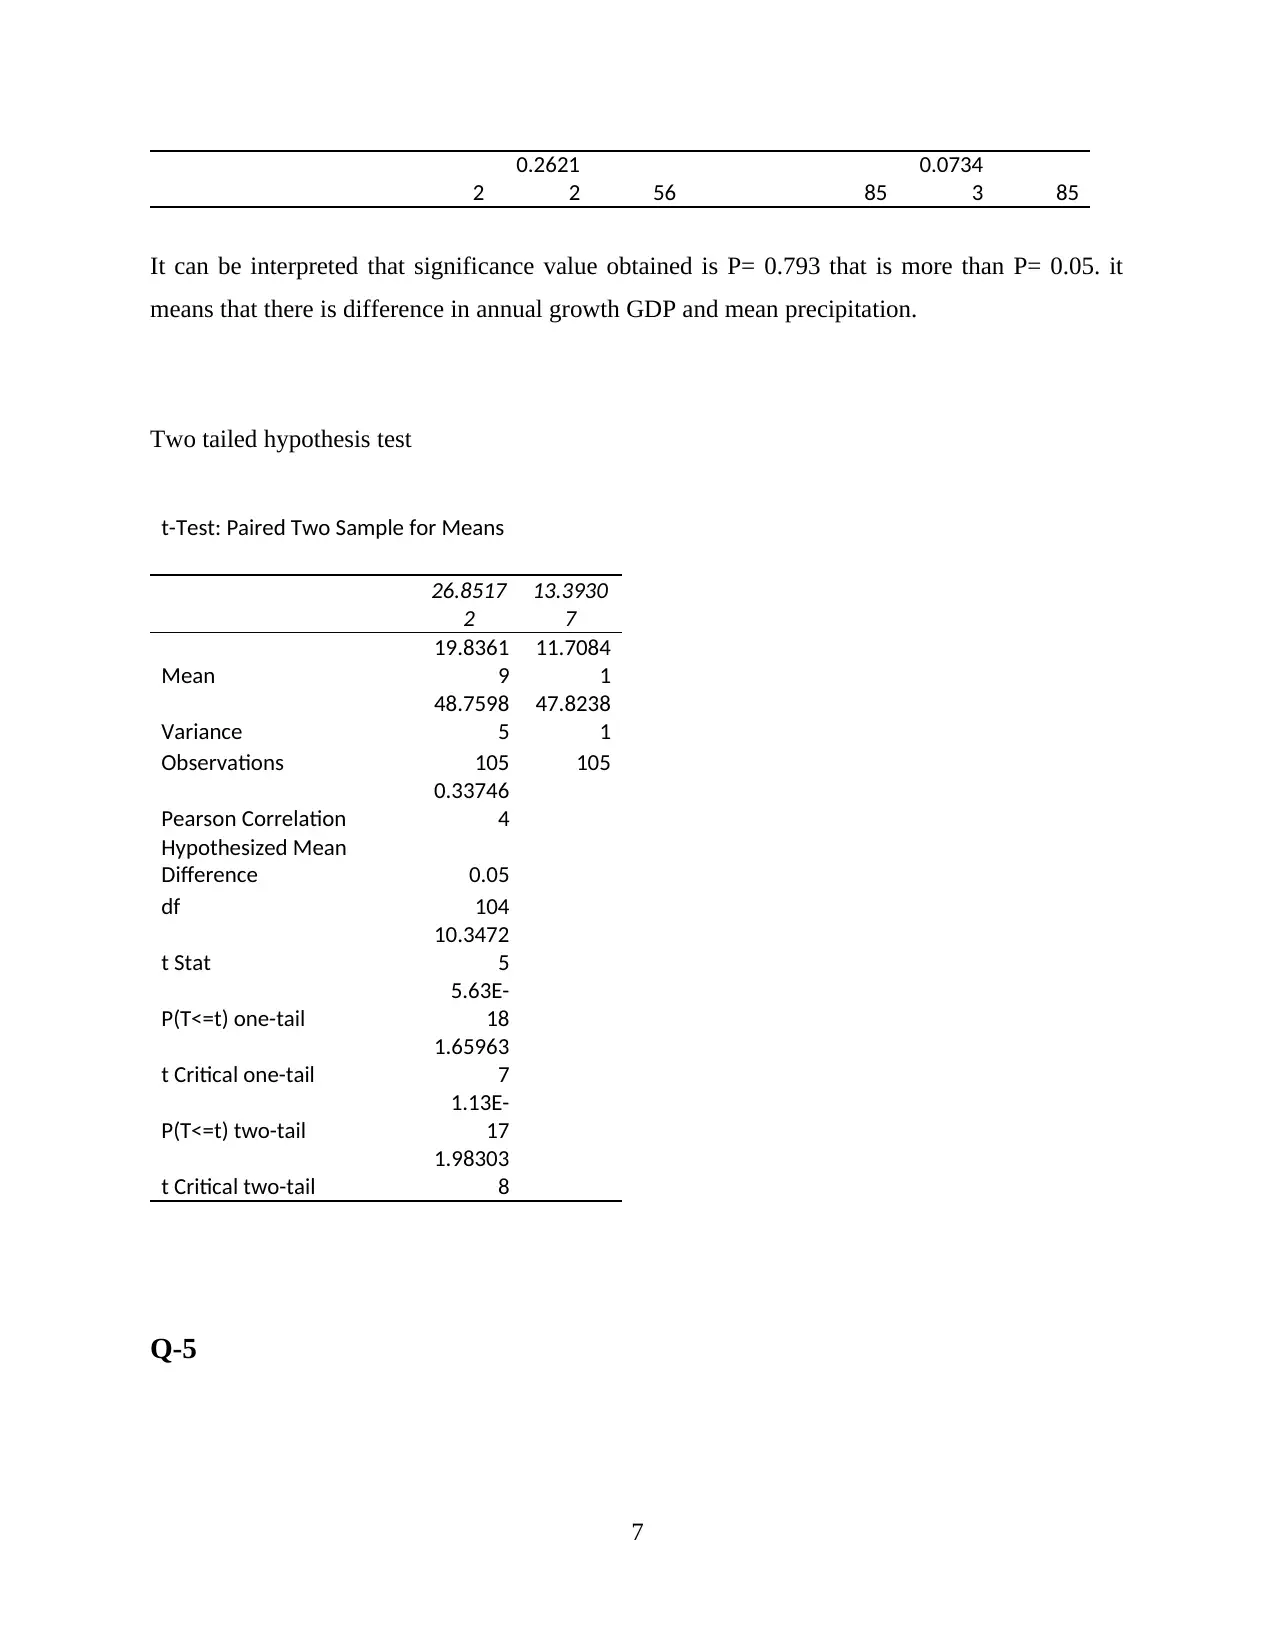
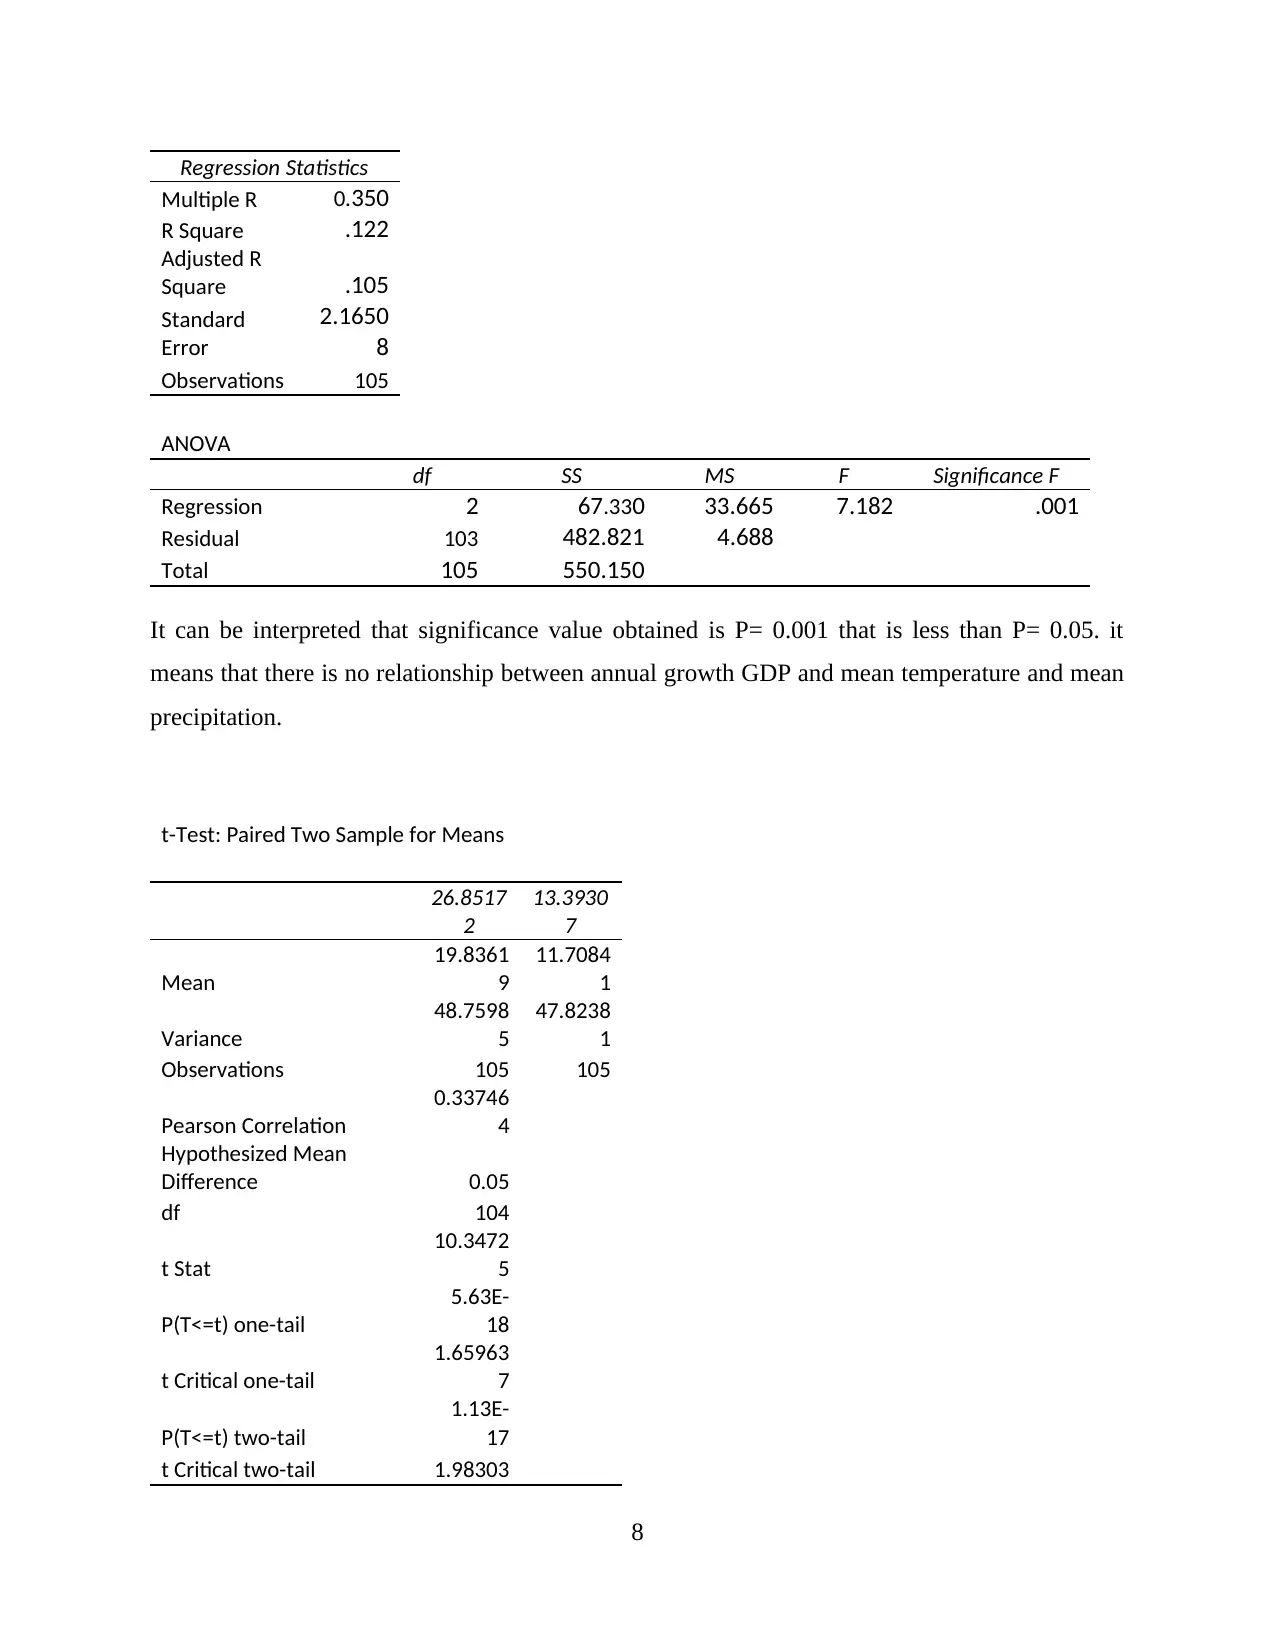
This report presents a comprehensive statistical analysis of economic data, focusing on the relationship between per capita GDP, temperature, and precipitation. The analysis includes descriptive statistics, regression analysis, and hypothesis testing, utilizing data from 106 countries. The study investigates the impact of temperature and precipitation on economic growth, examining the correlation between these variables and per capita GDP. The report interprets regression results, including R-squared values and significance levels, to determine the strength and significance of the relationships. Furthermore, the report addresses the necessity of hypothesis testing and interprets the findings in the context of economic development, exploring the potential influence of environmental factors on economic outcomes. The report also includes an Excel file containing the detailed workings and outputs used in the analysis.
tabler-icon-diamond-filled.svg

Contribute Materials

Your contribution can guide someone’s learning journey. Share your documents today.
Document Page
Given a data set that
1
tabler-icon-diamond-filled.svg

Secure Best Marks with AI Grader

Need help grading? Try our AI Grader for instant feedback on your assignments.
Document Page
Table of contents
Q-1...................................................................................................................................................3
Q-2...................................................................................................................................................4
Q-3...................................................................................................................................................4
Q-4 simple regression......................................................................................................................5
Q-5...................................................................................................................................................7
2
Document Page
Q-1
Column1
Mean
19.4623
5
Standard Error
0.67770
8
Median
21.5630
5
Mode #N/A
Standard
Deviation
6.97742
9
Sample
Variance
48.6845
2
Kurtosis
-
0.77217
Skewness
-
0.69569
Range
25.1135
3
Minimum 2.96588
Maximum
28.0794
1
Sum 2063.01
Count 106
Column1
Mean
19.9023
7
Standard Error
0.67823
1
Median
22.3135
9
Mode #N/A
Standard
Deviation
6.98282
1
Sample
Variance
48.7597
8
Kurtosis
-
0.78976
Skewness -
3
Document Page
0.69495
Range
26.4060
6
Minimum
2.46753
9
Maximum 28.8736
Sum
2109.65
1
Count 106
Yes, from data it is identified that globe is becoming warmer. This can be seen in rise in
mean temperature in year 1990- 2000.
Q-2
Senegal Mali burkina faso Algeria
0
5
10
15
20
25
30
per GDP temprature
It can be interpreted that hot countries tend to remain poor in GDP. It is because they
have to spend a lot on sustainability. Also, it impacts on their per capita income as well. They are
also not having advance technology to deal with hot temperature.
Q-3
4
tabler-icon-diamond-filled.svg

Secure Best Marks with AI Grader

Need help grading? Try our AI Grader for instant feedback on your assignments.
Document Page
Sample covariance
Column
1
Column
2
Colum
n 1
0.72243
4
Colum
n 2
2.44030
9
21.2765
3
Correlation
Column
1
Column
2
Column
1 1
Column
2
0.62243
7 1
It can be interpreted that significance value obtained is P= 0.622 that is more than P= 0.05. it
means that hot countries per capita GDP is low.
Q-4 simple regression
Regression Statistics
Multiple R 0.333817
R Square 0.111434
Adjusted R
Square 0.102807
Standard
Error 2.17471
Observatio
ns 105
ANOVA
df SS MS F
Significan
ce F
Regression 1
61.0896
2
61.089
62
12.917
09 0.000501
Residual 103
487.124
5
4.7293
64
5
Document Page
Total 104
548.214
1
Coefficie
nts
Standar
d Error t Stat P-value
Lower
95%
Upper
95%
Lower
95.0%
Upper
95.0%
Intercept 3.592942
0.64187
7
5.5975
6
1.81E-
07 2.319932
4.8659
53
2.3199
32
4.8659
53
26.85172 -0.10976
0.03053
9
-
3.5940
4
0.0005
01 -0.17032
-
0.0491
9
-
0.1703
2
-
0.0491
9
It can be interpreted that significance value obtained is P= 0.005 that is less than P= 0.05. it
means that there is no difference in annual growth GDP and mean temperature.
b)
Regression Statistics
Multiple R 0.025818
R Square 0.000667
Adjusted R
Square -0.00904
Standard
Error 2.306278
Observatio
ns 105
ANOVA
df SS MS F
Significan
ce F
Regression 1
0.36543
3
0.3654
33
0.0687
04 0.793756
Residual 103
547.848
7
5.3189
2
Total 104
548.214
1
Coefficie
nts
Standar
d Error t Stat P-value
Lower
95%
Upper
95%
Lower
95.0%
Upper
95.0%
Intercept 1.516124
0.44413
8
3.4136
3
0.0009
18 0.635281
2.3969
68
0.6352
81
2.3969
68
13.39307 -0.00857 0.03270 - 0.7937 -0.07343 0.0562 - 0.0562
6
Document Page
2
0.2621
2 56 85
0.0734
3 85
It can be interpreted that significance value obtained is P= 0.793 that is more than P= 0.05. it
means that there is difference in annual growth GDP and mean precipitation.
Two tailed hypothesis test
t-Test: Paired Two Sample for Means
26.8517
2
13.3930
7
Mean
19.8361
9
11.7084
1
Variance
48.7598
5
47.8238
1
Observations 105 105
Pearson Correlation
0.33746
4
Hypothesized Mean
Difference 0.05
df 104
t Stat
10.3472
5
P(T<=t) one-tail
5.63E-
18
t Critical one-tail
1.65963
7
P(T<=t) two-tail
1.13E-
17
t Critical two-tail
1.98303
8
Q-5
7
tabler-icon-diamond-filled.svg

Paraphrase This Document

Need a fresh take? Get an instant paraphrase of this document with our AI Paraphraser
Document Page
Regression Statistics
Multiple R 0.350
R Square .122
Adjusted R
Square .105
Standard
Error
2.1650
8
Observations 105
ANOVA
df SS MS F Significance F
Regression 2 67.330 33.665 7.182 .001
Residual 103 482.821 4.688
Total 105 550.150
It can be interpreted that significance value obtained is P= 0.001 that is less than P= 0.05. it
means that there is no relationship between annual growth GDP and mean temperature and mean
precipitation.
t-Test: Paired Two Sample for Means
26.8517
2
13.3930
7
Mean
19.8361
9
11.7084
1
Variance
48.7598
5
47.8238
1
Observations 105 105
Pearson Correlation
0.33746
4
Hypothesized Mean
Difference 0.05
df 104
t Stat
10.3472
5
P(T<=t) one-tail
5.63E-
18
t Critical one-tail
1.65963
7
P(T<=t) two-tail
1.13E-
17
t Critical two-tail 1.98303
8
Document Page
8
Q-6 Why hypothesis test is required
It is necessary to test hypothesis in above paragraph so that the relationship between per
capita GDP and temperature is determined. Also, it can be checked that whether the GDP of hot
countries remain poor due to temperature or not. In addition, regression analysis helps to find out
mean temperature and mean precipitation in year 1999-2000.
Q-7 Interpret R square in regression analysis
By interpreting R square it is found that the value is .105. so, it means that model
explains all variability of response data around its mean. This means that the R square fits data.
Q-8 the two variables are as follows :
Carbon emission- it is one variable that can be taken. This is because carbon emission highly
influences on GDP. If here is high emission than GDP is high as well.
Interest rate- This is also a factor which influence on per capita GDP. Any change in interest rate
impact on GDP. It is because interest rate is related to monetary policy of nation.
9
chevron_up_icon
1 out of 9
circle_padding
hide_on_mobile
zoom_out_icon
logo.png

Your All-in-One AI-Powered Toolkit for Academic Success.

Available 24*7 on WhatsApp / Email

[object Object]