Regression Analysis of Mobile Phone Reviews: Business Statistics
VerifiedAdded on 2023/06/14
|7
|1034
|173
Report
AI Summary
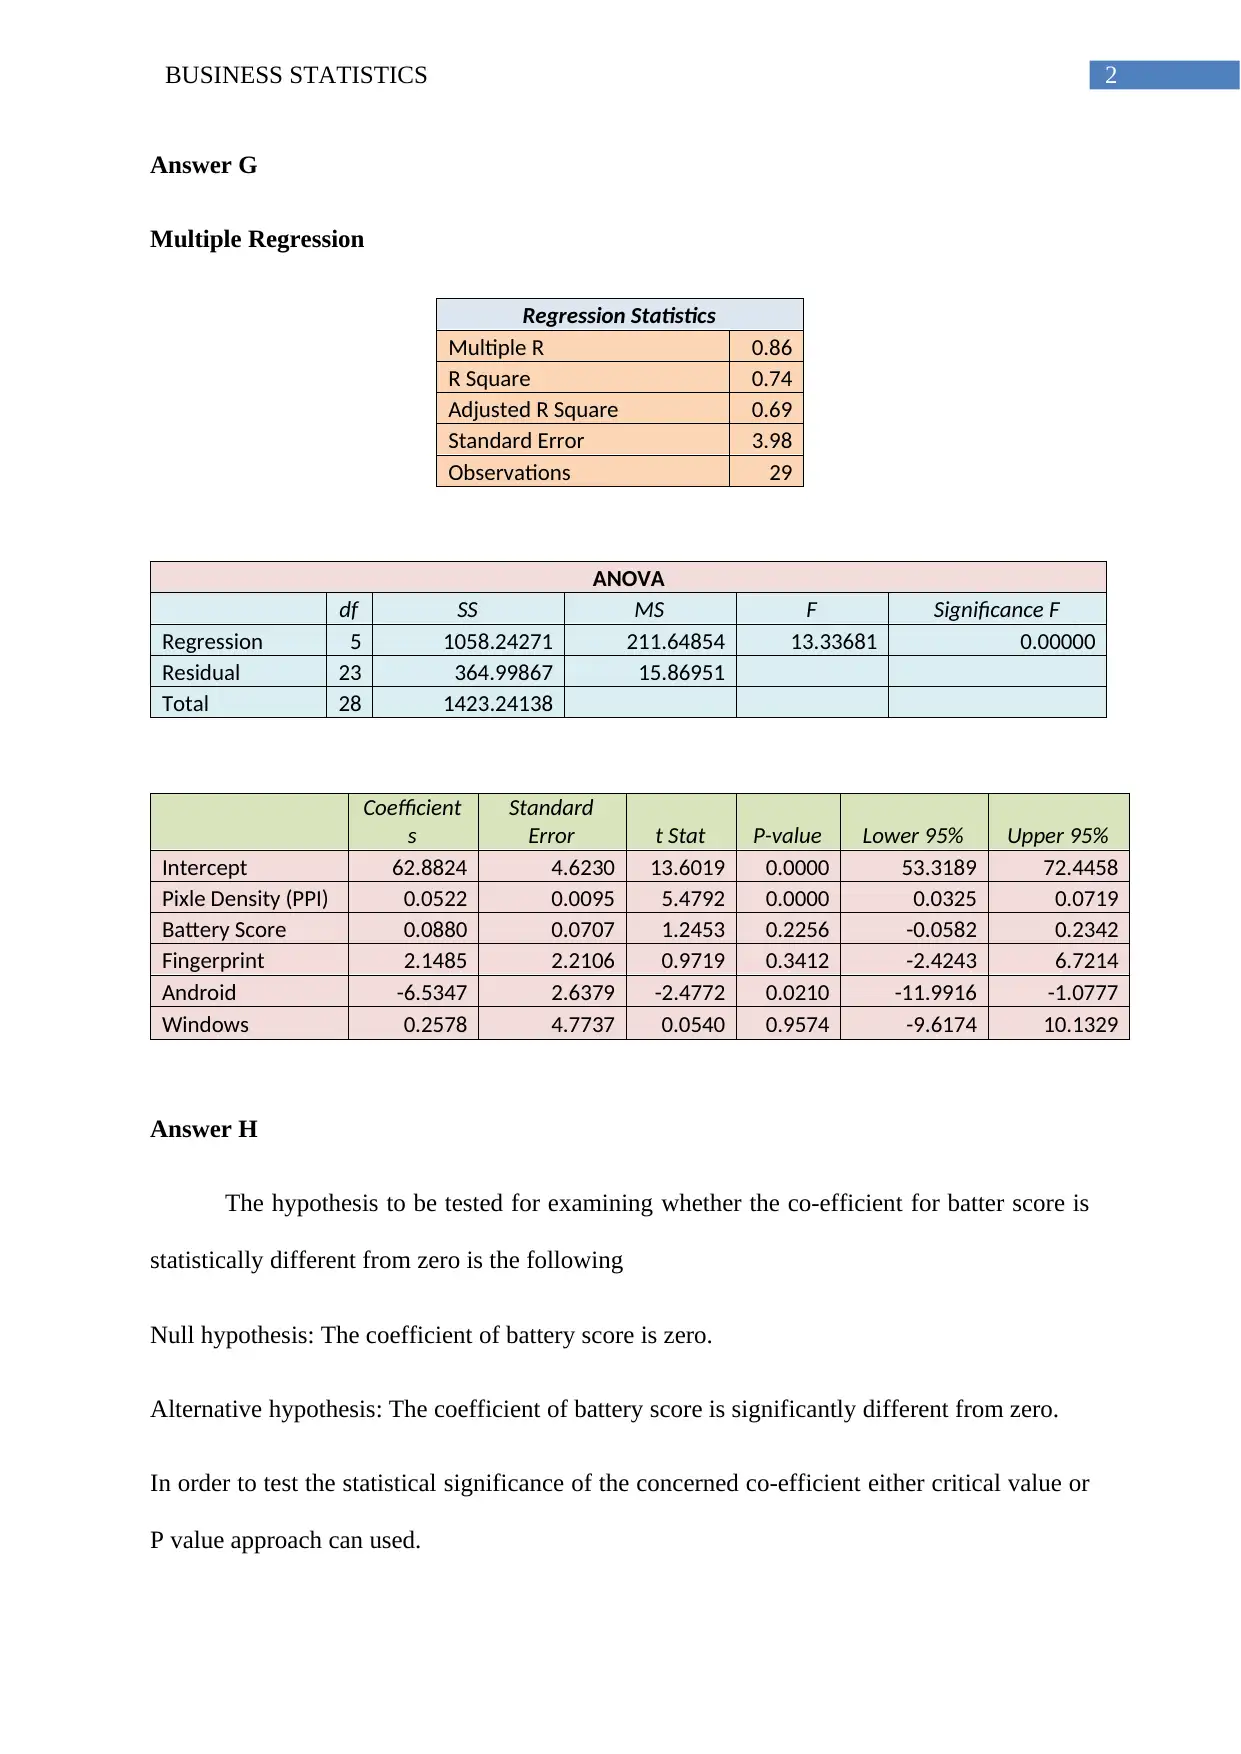
This business statistics report examines the factors influencing mobile phone review scores using regression analysis. The analysis includes variables such as pixel density, battery score, fingerprint feature, and operating system (Android and Windows). The report tests hypotheses, interprets coefficients, and assesses the statistical significance of variables. The adjusted R-squared value indicates the proportion of variance in review scores explained by the model. The report concludes by identifying other potential factors, such as memory space, RAM, and scratch-proof facility, that could influence review scores. Desklib offers similar solved assignments and past papers for students.

Running Head: BUSINESS STATISTICS
Business Statistics
Name of the Student
Name of the University
Author note
Business Statistics
Name of the Student
Name of the University
Author note
Paraphrase This Document
Need a fresh take? Get an instant paraphrase of this document with our AI Paraphraser

1BUSINESS STATISTICS
Table of Contents
Answer G...................................................................................................................................2
Answer H...................................................................................................................................2
Answer I.....................................................................................................................................3
Answer J.....................................................................................................................................4
Answer K...................................................................................................................................5
Answer L....................................................................................................................................5
References..................................................................................................................................6

2BUSINESS STATISTICS
Answer G
Multiple Regression
Regression Statistics
Multiple R 0.86
R Square 0.74
Adjusted R Square 0.69
Standard Error 3.98
Observations 29
ANOVA
df SS MS F Significance F
Regression 5 1058.24271 211.64854 13.33681 0.00000
Residual 23 364.99867 15.86951
Total 28 1423.24138
Coefficient
s
Standard
Error t Stat P-value Lower 95% Upper 95%
Intercept 62.8824 4.6230 13.6019 0.0000 53.3189 72.4458
Pixle Density (PPI) 0.0522 0.0095 5.4792 0.0000 0.0325 0.0719
Battery Score 0.0880 0.0707 1.2453 0.2256 -0.0582 0.2342
Fingerprint 2.1485 2.2106 0.9719 0.3412 -2.4243 6.7214
Android -6.5347 2.6379 -2.4772 0.0210 -11.9916 -1.0777
Windows 0.2578 4.7737 0.0540 0.9574 -9.6174 10.1329
Answer H
The hypothesis to be tested for examining whether the co-efficient for batter score is
statistically different from zero is the following
Null hypothesis: The coefficient of battery score is zero.
Alternative hypothesis: The coefficient of battery score is significantly different from zero.
In order to test the statistical significance of the concerned co-efficient either critical value or
P value approach can used.
⊘ This is a preview!⊘
Do you want full access?
Subscribe today to unlock all pages.

Trusted by 1+ million students worldwide

3BUSINESS STATISTICS
Under critical value approach, a variable is said to be statistically significant the
computed value of the t statistic for the concerned co-efficient is greater than the critical t
value (Draper and Smith 2014). As obtained from the regression table, the computed value of
t is 1.2453. The critical t value at 5% level of significance and degrees of freedom of 23 is
2.0687. The computed value is less than critical value implying a non-significance of the
variable. Therefore, the variable battery score is not statistically different from zero.
Under p value approach, the statistical significance of a variable is tested based on p
value of the variable. In the p value is less than the significance level then the null hypothesis
that the co-efficient is different from zero is rejected (López, Fabrizio and Plencovich 2014).
The p value for battery score is 0.2256. This is greater than the significance value of 0.05.
This implies acceptance of the null hypothesis indicating the variable is not statistically
different from zero. This supports the finding under critical value approach.
The estimated co-efficient is 0.0880. The positive value of the co-efficient indicates
that battery score has a positive influence on review score. With 1 percent increase in battery
score, review score increases by 0.08 percent.
Answer I
The slope co-efficient of pixel density is 0.0522. The p value is 0.0000. This means
the variable is statistically different from zero. The positive co-efficient refers to a positive
relation between review score and pixel density. The higher pixel density implies a higher
review score and vice-versa.
Fingerprint is an additional feature of phone that positively influences review score.
Having fingerprint is considered as a privilege to customers and hence, give a higher review.
The co-efficient for fingerprint is 2.1485. This means the co-efficient has the expected sign.
Paraphrase This Document
Need a fresh take? Get an instant paraphrase of this document with our AI Paraphraser

4BUSINESS STATISTICS
The p value is 0.3412, which is greater than the significance level. Therefore, the variable
fingerprint is not statistically significant.
The co-efficient for android is -6.5347. The negative co-efficient shows for android
phone, the review score is lower. The variable is statistically significant as obtained from the
critical and p value approach. However, the android is more user friendly and flexible than
windows. Therefore, it should have positive impact on review score. Therefore, the variable
does not have expected sign.
For the dummy variable Windows, the co-efficient is 0.2578. The variable is not
statistically significant at 5% level of significance. The positive sign of the variable implies
people have greater preference for Windows.
Answer J
The value of adjusted R square is 0.69. The interpretation of adjusted R square is
same as multiple R square. The measure shows, 69% variation in review score is explained
by the independent variables taken for consideration.
The R square value is 0.74. The difference between adjusted R square and R square is
(0.74 – 0.69) = 0.06. The R square value is not adjusted for sample size or number of
explanatory variables. Unlike R square, the adjusted R square uses variance in place of
variations (Draper and Smith 2014). The adjusted R square takes sample size and number if
explanatory variables into consideration. This is reason why adjusted R square has a
comparatively lower value as compared to R square.

5BUSINESS STATISTICS
Answer K
The significance of overall model is tested using F statistics. The p value
corresponding to the F statistics is 0.0000. The p value is less than the significance level
implying overall significance of the model.
Answer L
The other factors that might influence the review scores are available memory space,
RAM and scratch proof facility. The higher memory space is expected to have a positive
effect on review score. Higher RAM allows multitasking in mobile phone. People can avail
better-functioned application with high RAM. Therefore, it can have a positive influence on
review score. Mobile users always willing to protect their mobile screen. An additional
scratchproof facility will provide greater protection to the mobile screen. This might
influence review score positively.
⊘ This is a preview!⊘
Do you want full access?
Subscribe today to unlock all pages.

Trusted by 1+ million students worldwide

6BUSINESS STATISTICS
References
Draper, N.R. and Smith, H., 2014. Applied regression analysis(Vol. 326). John Wiley &
Sons.
López, M.V., Fabrizio, M.C. and Plencovich, M.C., 2014. Multiple Regression
Analysis. Probability and Statistics: A Didactic Introduction, 416.
References
Draper, N.R. and Smith, H., 2014. Applied regression analysis(Vol. 326). John Wiley &
Sons.
López, M.V., Fabrizio, M.C. and Plencovich, M.C., 2014. Multiple Regression
Analysis. Probability and Statistics: A Didactic Introduction, 416.
1 out of 7
Related Documents

Your All-in-One AI-Powered Toolkit for Academic Success.
+13062052269
info@desklib.com
Available 24*7 on WhatsApp / Email
Unlock your academic potential
Copyright © 2020–2025 A2Z Services. All Rights Reserved. Developed and managed by ZUCOL.