ECON 2210 G Winter 2020: Introductory Statistics Test 2 Review
VerifiedAdded on 2022/08/25
|5
|856
|24
Homework Assignment
AI Summary
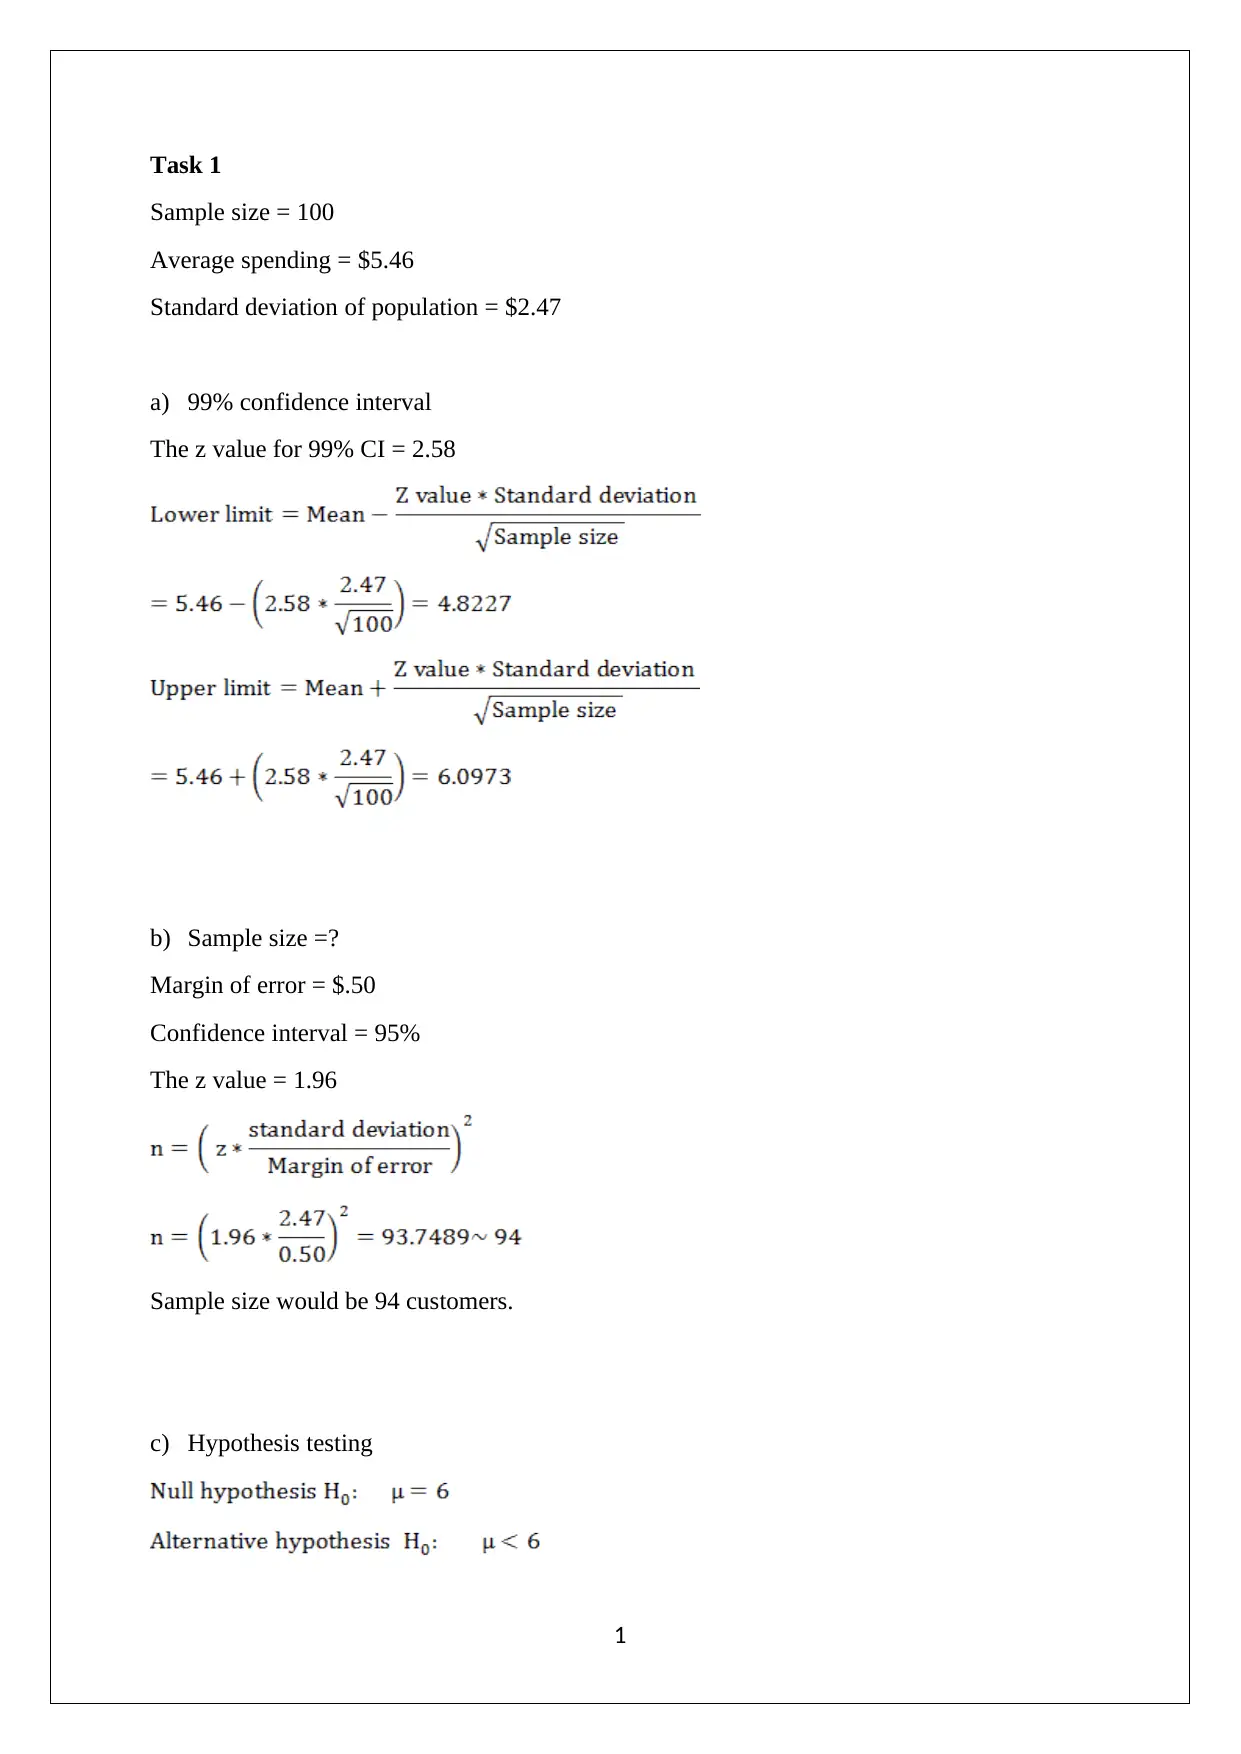
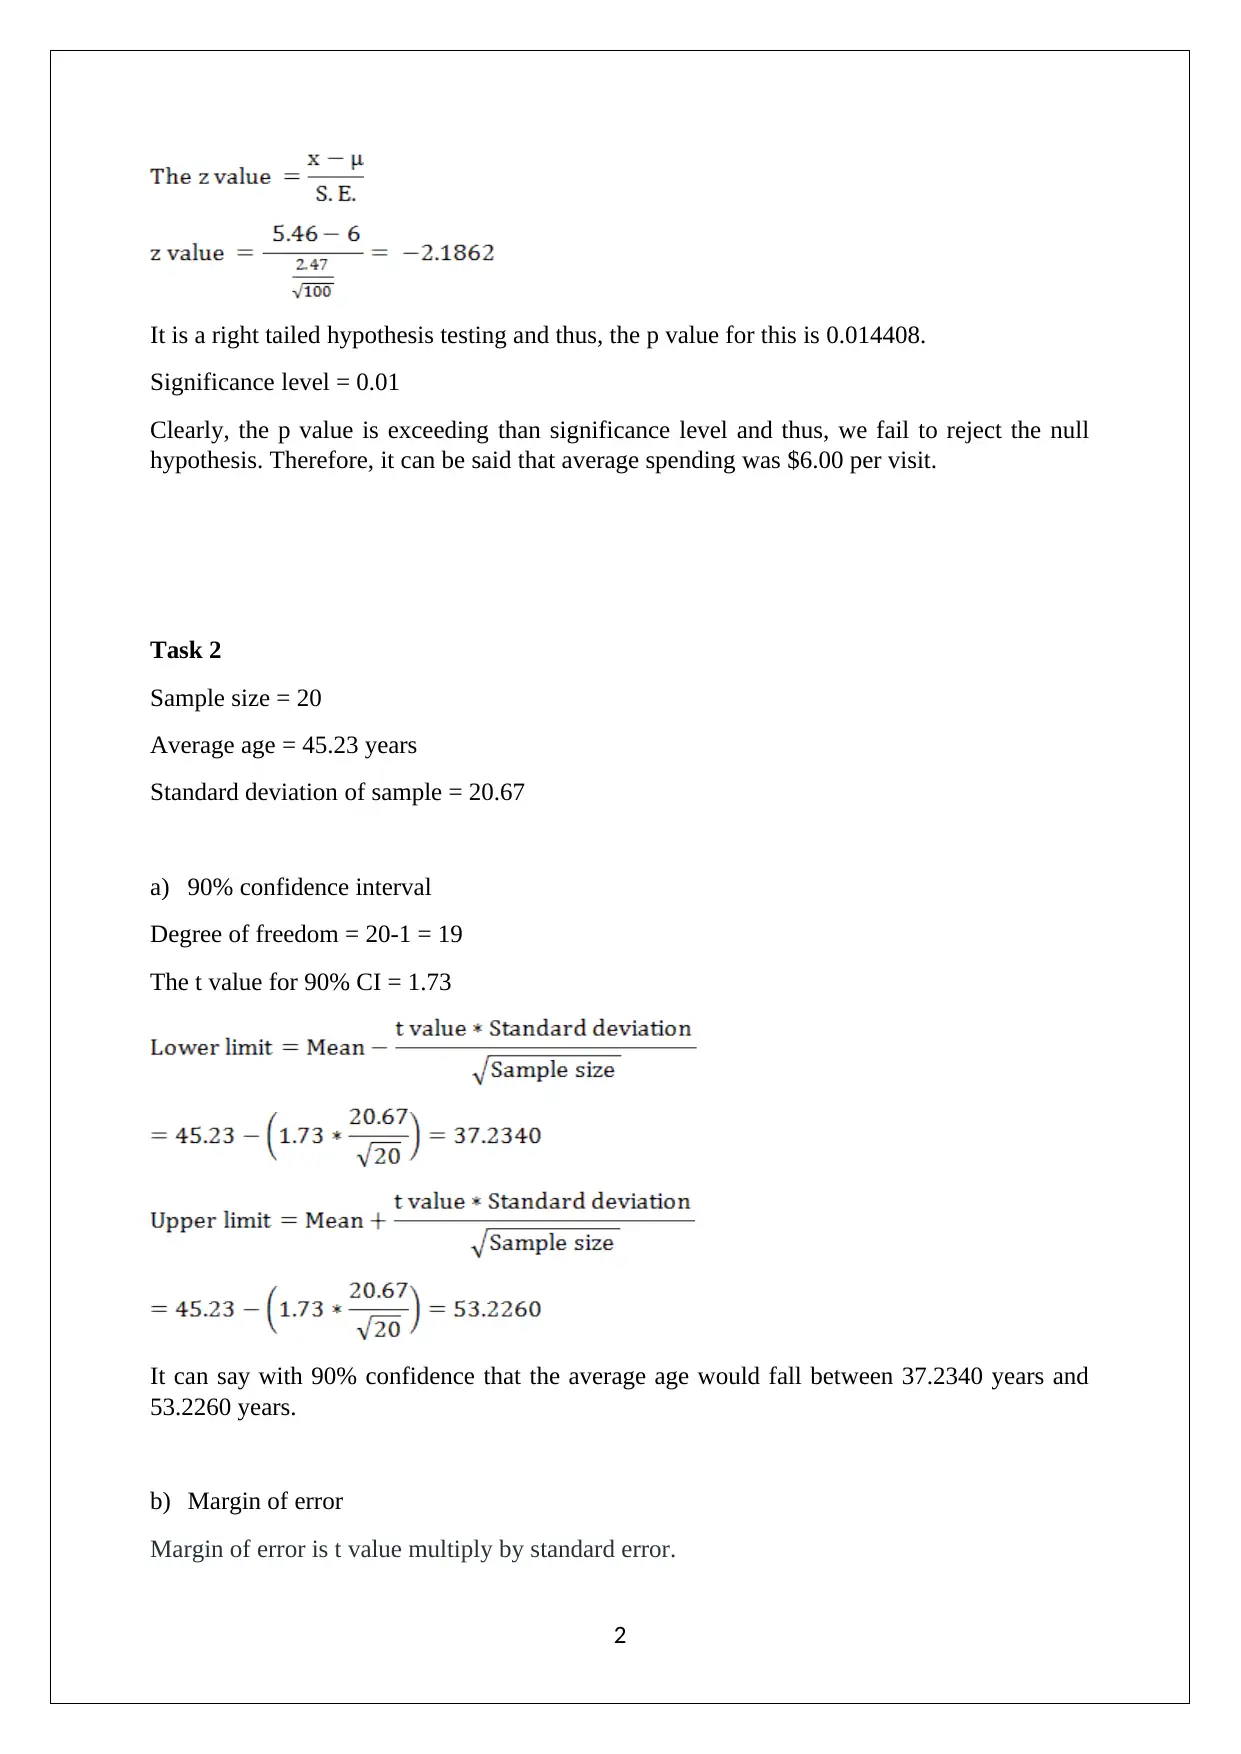
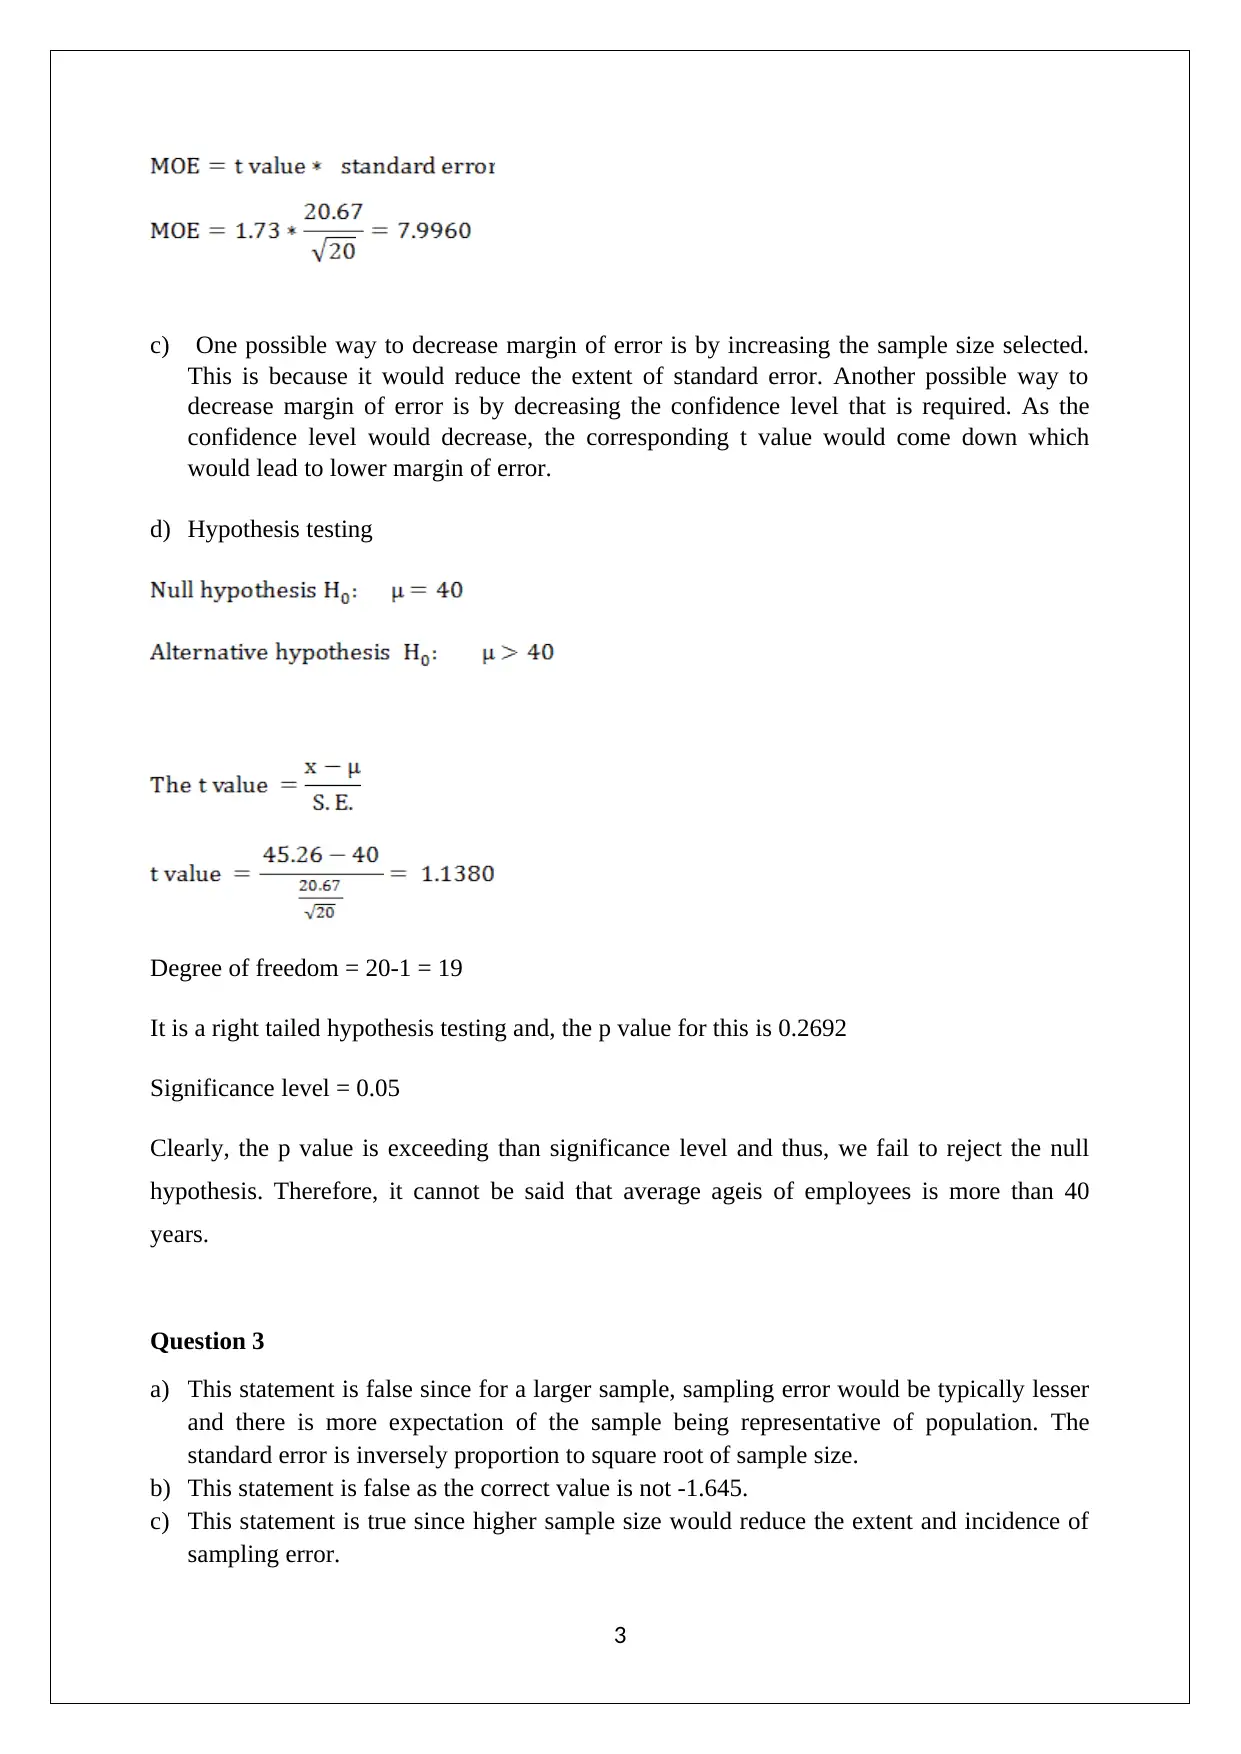
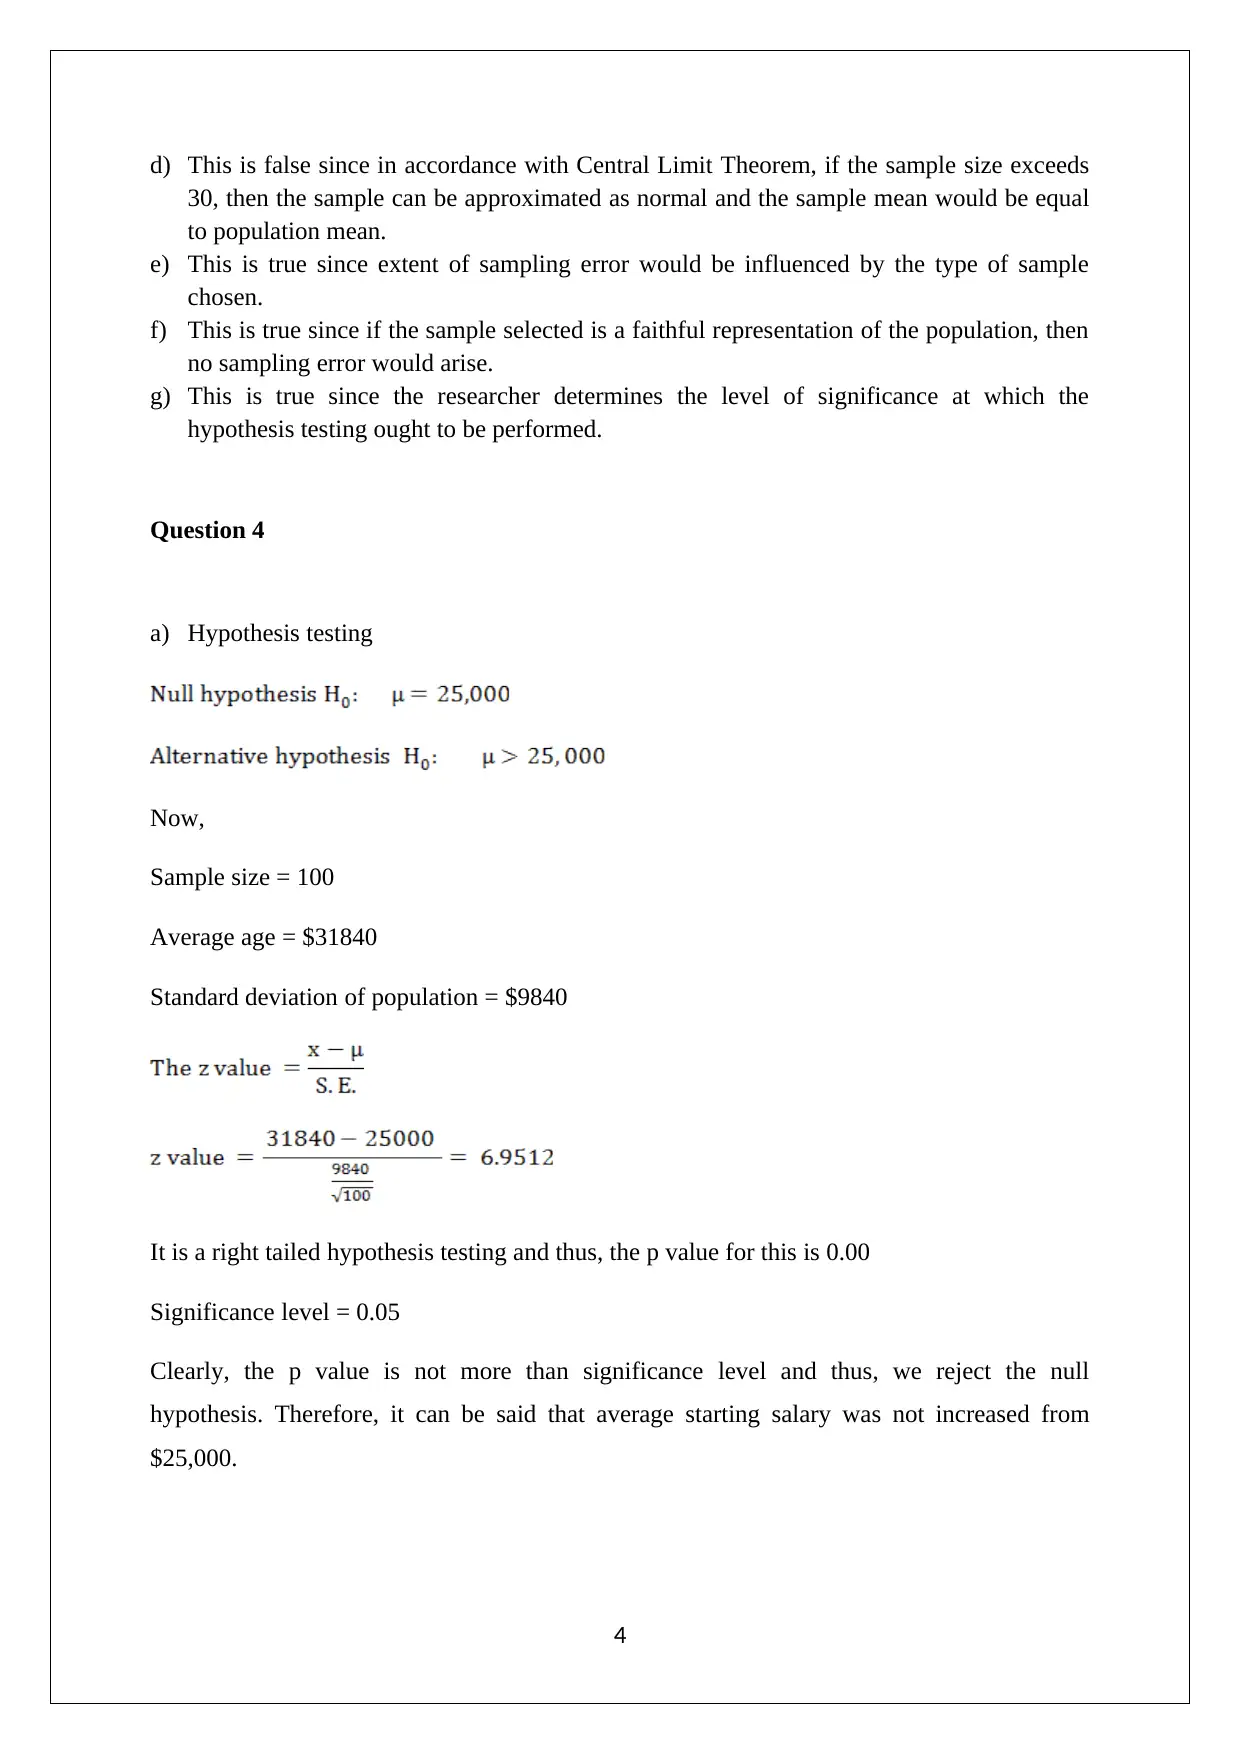
This document presents solutions to statistical problems from an ECON 2210 test, focusing on topics such as confidence intervals, hypothesis testing, and sample size determination. The solutions cover various scenarios, including calculating confidence intervals for average spending, determining r...

Task 1
Sample size = 100
Average spending = $5.46
Standard deviation of population = $2.47
a) 99% confidence interval
The z value for 99% CI = 2.58
b) Sample size =?
Margin of error = $.50
Confidence interval = 95%
The z value = 1.96
Sample size would be 94 customers.
c) Hypothesis testing
1
Sample size = 100
Average spending = $5.46
Standard deviation of population = $2.47
a) 99% confidence interval
The z value for 99% CI = 2.58
b) Sample size =?
Margin of error = $.50
Confidence interval = 95%
The z value = 1.96
Sample size would be 94 customers.
c) Hypothesis testing
1
Paraphrase This Document
Need a fresh take? Get an instant paraphrase of this document with our AI Paraphraser

It is a right tailed hypothesis testing and thus, the p value for this is 0.014408.
Significance level = 0.01
Clearly, the p value is exceeding than significance level and thus, we fail to reject the null
hypothesis. Therefore, it can be said that average spending was $6.00 per visit.
Task 2
Sample size = 20
Average age = 45.23 years
Standard deviation of sample = 20.67
a) 90% confidence interval
Degree of freedom = 20-1 = 19
The t value for 90% CI = 1.73
It can say with 90% confidence that the average age would fall between 37.2340 years and
53.2260 years.
b) Margin of error
Margin of error is t value multiply by standard error.
2

c) One possible way to decrease margin of error is by increasing the sample size selected.
This is because it would reduce the extent of standard error. Another possible way to
decrease margin of error is by decreasing the confidence level that is required. As the
confidence level would decrease, the corresponding t value would come down which
would lead to lower margin of error.
d) Hypothesis testing
Degree of freedom = 20-1 = 19
It is a right tailed hypothesis testing and, the p value for this is 0.2692
Significance level = 0.05
Clearly, the p value is exceeding than significance level and thus, we fail to reject the null
hypothesis. Therefore, it cannot be said that average ageis of employees is more than 40
years.
Question 3
a) This statement is false since for a larger sample, sampling error would be typically lesser
and there is more expectation of the sample being representative of population. The
standard error is inversely proportion to square root of sample size.
b) This statement is false as the correct value is not -1.645.
c) This statement is true since higher sample size would reduce the extent and incidence of
sampling error.
3
⊘ This is a preview!⊘
Do you want full access?
Subscribe today to unlock all pages.

Trusted by 1+ million students worldwide

d) This is false since in accordance with Central Limit Theorem, if the sample size exceeds
30, then the sample can be approximated as normal and the sample mean would be equal
to population mean.
e) This is true since extent of sampling error would be influenced by the type of sample
chosen.
f) This is true since if the sample selected is a faithful representation of the population, then
no sampling error would arise.
g) This is true since the researcher determines the level of significance at which the
hypothesis testing ought to be performed.
Question 4
a) Hypothesis testing
Now,
Sample size = 100
Average age = $31840
Standard deviation of population = $9840
It is a right tailed hypothesis testing and thus, the p value for this is 0.00
Significance level = 0.05
Clearly, the p value is not more than significance level and thus, we reject the null
hypothesis. Therefore, it can be said that average starting salary was not increased from
$25,000.
4
Paraphrase This Document
Need a fresh take? Get an instant paraphrase of this document with our AI Paraphraser

b) Type 1 error highlights the likelihood of a scenario where a null hypothesis which is true
is rejected by the researcher. This is measured by alpha or significance level which is
decided by the researcher. Type 2 error highlights the likelihood of the acceptance of a
false null hypothesis. This is measured by beta.
Power of a test is the likelihood of the test rejecting the null hypothesis which is false. It
is equal to 1-beta.
c) Type 1 error would occur when the average starting salary of high school students is
$25,000 or less but the hypothesis is rejected implying that average starting salary
exceeds $25,000. The chances of this happening are 5%. Type 2 error would occur when
the claim that average starting salary is $25,000 is accepted when it should be rejected.
Power of a test would refer to the probability that null hypothesis is rejected when the
average salary is indeed greater than $ 25,000.
5
1 out of 5
Related Documents

Your All-in-One AI-Powered Toolkit for Academic Success.
+13062052269
info@desklib.com
Available 24*7 on WhatsApp / Email
Unlock your academic potential
© 2024 | Zucol Services PVT LTD | All rights reserved.