ECON1030 Business Statistics: Employment & Pay Equity Taskforce RMIT
VerifiedAdded on 2023/06/18
|12
|1861
|104
Report
AI Summary
This report presents an analysis of employment and pay equity, including a statistical evaluation of male and female weekly earnings using descriptive statistics. It highlights differences in labor market characteristics such as education, work experience, and skills. The analysis includes calculations of mean, median, mode, and variance for both male and female earnings. A T-test is performed to assess the significance of the gender pay gap, and an ANOVA single factor analysis confirms the difference in weekly earnings. The report also includes a ministerial brief addressing the gender pay gap in Australia, along with recommendations for improving female earnings and opportunities. The report concludes that statistical analysis is essential for evaluating data and presenting findings effectively, with references to relevant academic sources. Desklib provides access to similar reports and study resources for students.
Report to the Employment
and Pay Equity Taskforce
and Pay Equity Taskforce
Paraphrase This Document
Need a fresh take? Get an instant paraphrase of this document with our AI Paraphraser
TABLE OF CONTENTS
INTRODUCTION...........................................................................................................................3
PART A...........................................................................................................................................3
1...................................................................................................................................................3
2...................................................................................................................................................4
3...................................................................................................................................................5
4...................................................................................................................................................5
5...................................................................................................................................................6
6...................................................................................................................................................7
7...................................................................................................................................................7
8...................................................................................................................................................8
9...................................................................................................................................................8
PART B............................................................................................................................................9
Ministerial brief...........................................................................................................................9
CONCLUSION..............................................................................................................................10
REFERENCES..............................................................................................................................12
INTRODUCTION
Statistics is being defined as the stream which relates with studying and developing
various methods for collecting, analysing and presenting the data in summarised form. For
analysing any set of data it is essential for the researcher that they use the various statistical tool.
The present study will outline the report for the employment and pay equity taskforce. In the
present report analysis and calculation of male and female workers weekly earning with help of
descriptive statistics. This is particularly because of the reason that descriptive statistics provides
for the summary of all the data and it assist in better decision making. Further the report will also
outline the differences between the various labour market characteristics like the education, work
experience and the skills. Further the report will also draft a ministerial brief report for the
various graphs relating to the gender pay gap in Australia.
PART A
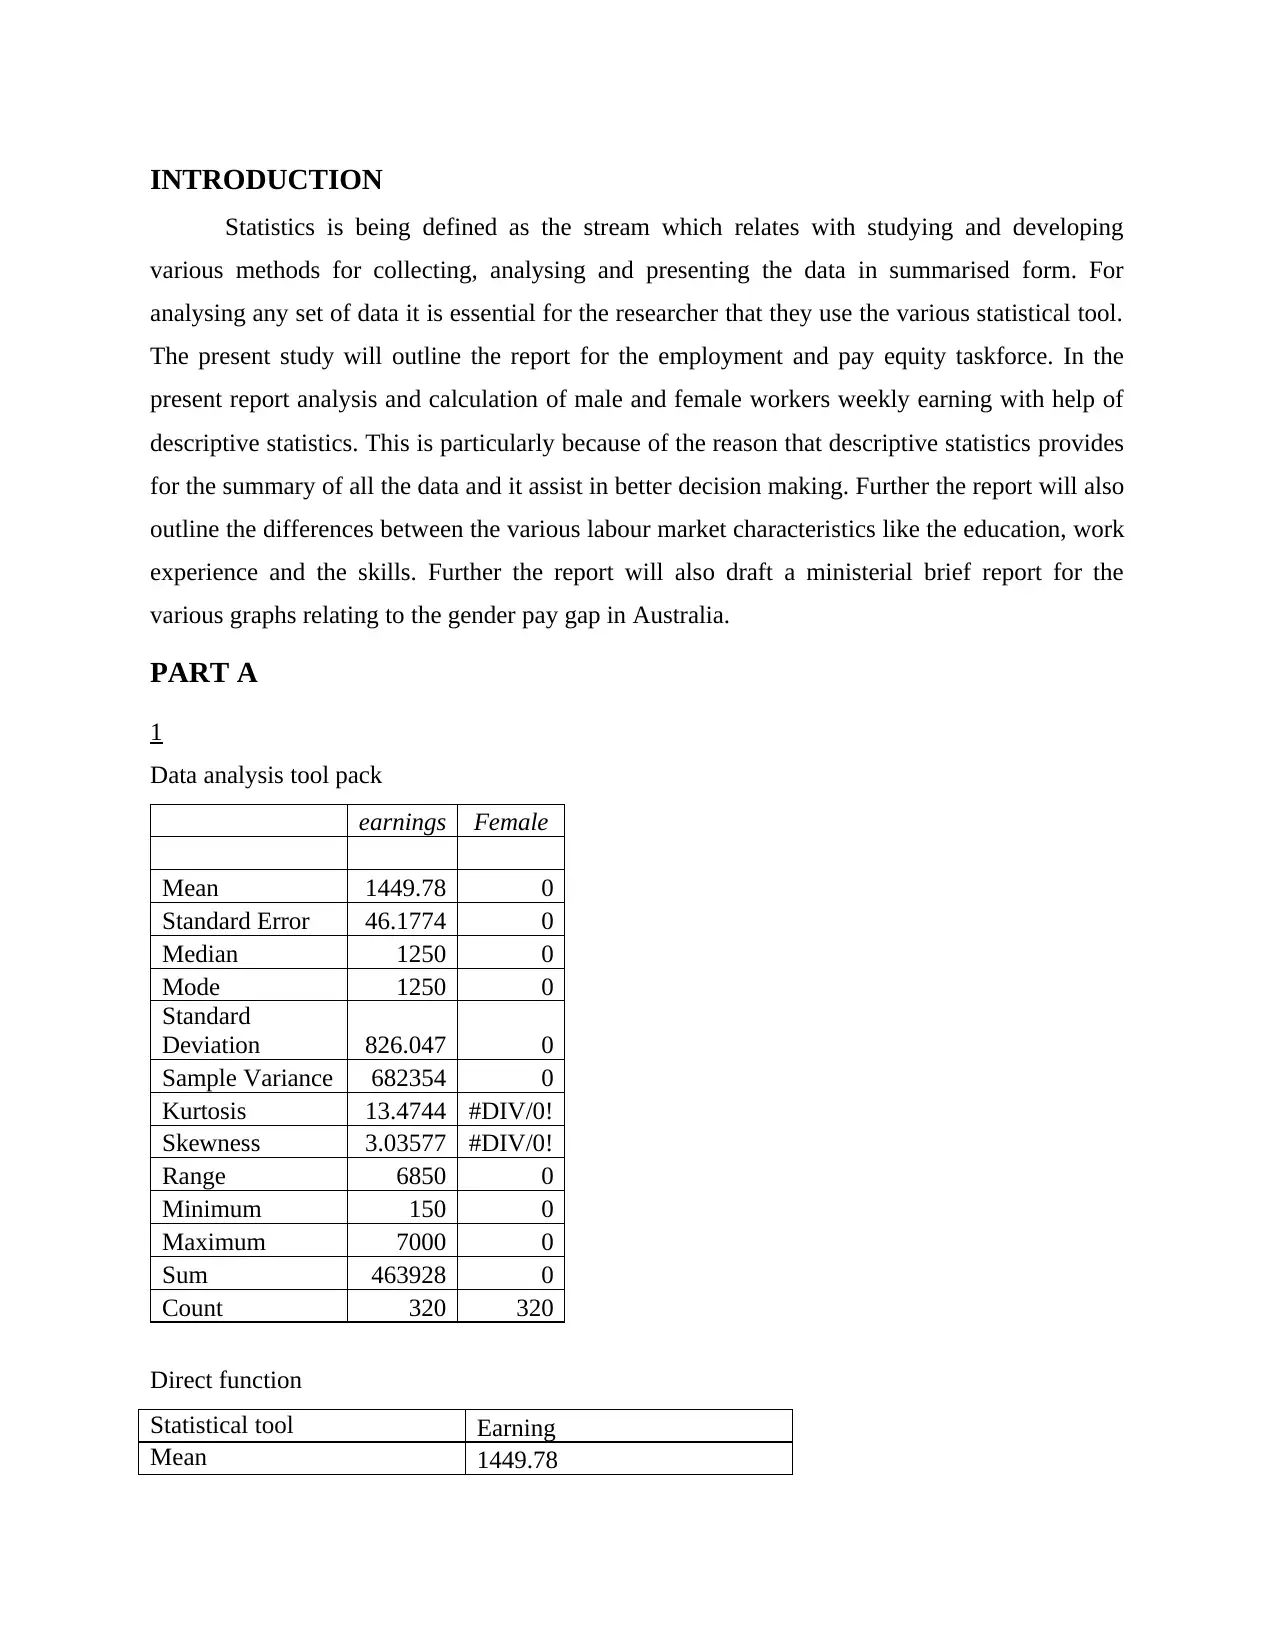
1
Data analysis tool pack
earnings Female
Mean 1449.78 0
Standard Error 46.1774 0
Median 1250 0
Mode 1250 0
Standard
Deviation 826.047 0
Sample Variance 682354 0
Kurtosis 13.4744 #DIV/0!
Skewness 3.03577 #DIV/0!
Range 6850 0
Minimum 150 0
Maximum 7000 0
Sum 463928 0
Count 320 320
Direct function
Statistical tool Earning
Mean 1449.78
Statistics is being defined as the stream which relates with studying and developing
various methods for collecting, analysing and presenting the data in summarised form. For
analysing any set of data it is essential for the researcher that they use the various statistical tool.
The present study will outline the report for the employment and pay equity taskforce. In the
present report analysis and calculation of male and female workers weekly earning with help of
descriptive statistics. This is particularly because of the reason that descriptive statistics provides
for the summary of all the data and it assist in better decision making. Further the report will also
outline the differences between the various labour market characteristics like the education, work
experience and the skills. Further the report will also draft a ministerial brief report for the
various graphs relating to the gender pay gap in Australia.
PART A
1
Data analysis tool pack
earnings Female
Mean 1449.78 0
Standard Error 46.1774 0
Median 1250 0
Mode 1250 0
Standard
Deviation 826.047 0
Sample Variance 682354 0
Kurtosis 13.4744 #DIV/0!
Skewness 3.03577 #DIV/0!
Range 6850 0
Minimum 150 0
Maximum 7000 0
Sum 463928 0
Count 320 320
Direct function
Statistical tool Earning
Mean 1449.78
⊘ This is a preview!⊘
Do you want full access?
Subscribe today to unlock all pages.
Trusted by 1+ million students worldwide
Median 1250
Mode 1250
With the above analysis of the data it is clear that mean earning of females is 1449.78 and the
median is 1250 and maximum of the earning is 7000 and minimum 150. Along with this, it was
evaluated that the total number of females out of the total respondent was 320
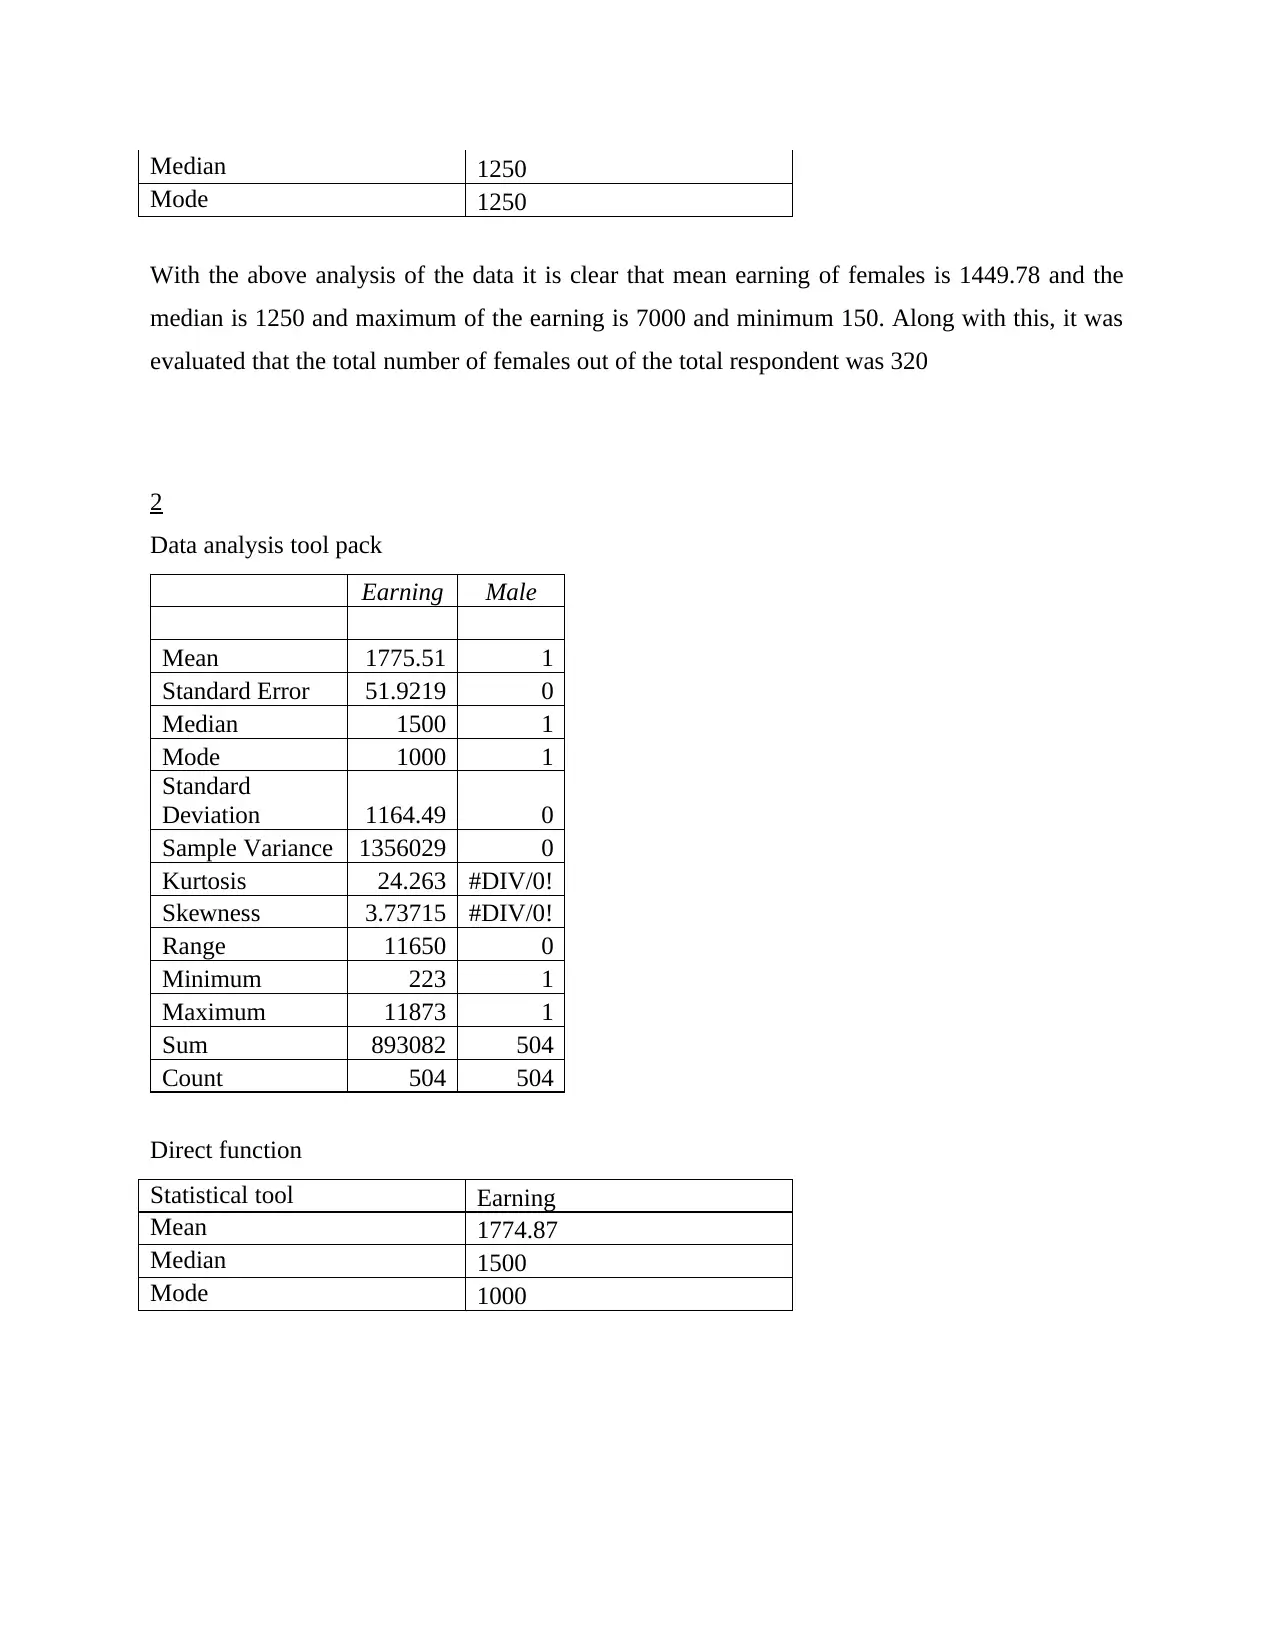
2
Data analysis tool pack
Earning Male
Mean 1775.51 1
Standard Error 51.9219 0
Median 1500 1
Mode 1000 1
Standard
Deviation 1164.49 0
Sample Variance 1356029 0
Kurtosis 24.263 #DIV/0!
Skewness 3.73715 #DIV/0!
Range 11650 0
Minimum 223 1
Maximum 11873 1
Sum 893082 504
Count 504 504
Direct function
Statistical tool Earning
Mean 1774.87
Median 1500
Mode 1000
Mode 1250
With the above analysis of the data it is clear that mean earning of females is 1449.78 and the
median is 1250 and maximum of the earning is 7000 and minimum 150. Along with this, it was
evaluated that the total number of females out of the total respondent was 320
2
Data analysis tool pack
Earning Male
Mean 1775.51 1
Standard Error 51.9219 0
Median 1500 1
Mode 1000 1
Standard
Deviation 1164.49 0
Sample Variance 1356029 0
Kurtosis 24.263 #DIV/0!
Skewness 3.73715 #DIV/0!
Range 11650 0
Minimum 223 1
Maximum 11873 1
Sum 893082 504
Count 504 504
Direct function
Statistical tool Earning
Mean 1774.87
Median 1500
Mode 1000
Paraphrase This Document
Need a fresh take? Get an instant paraphrase of this document with our AI Paraphraser
3
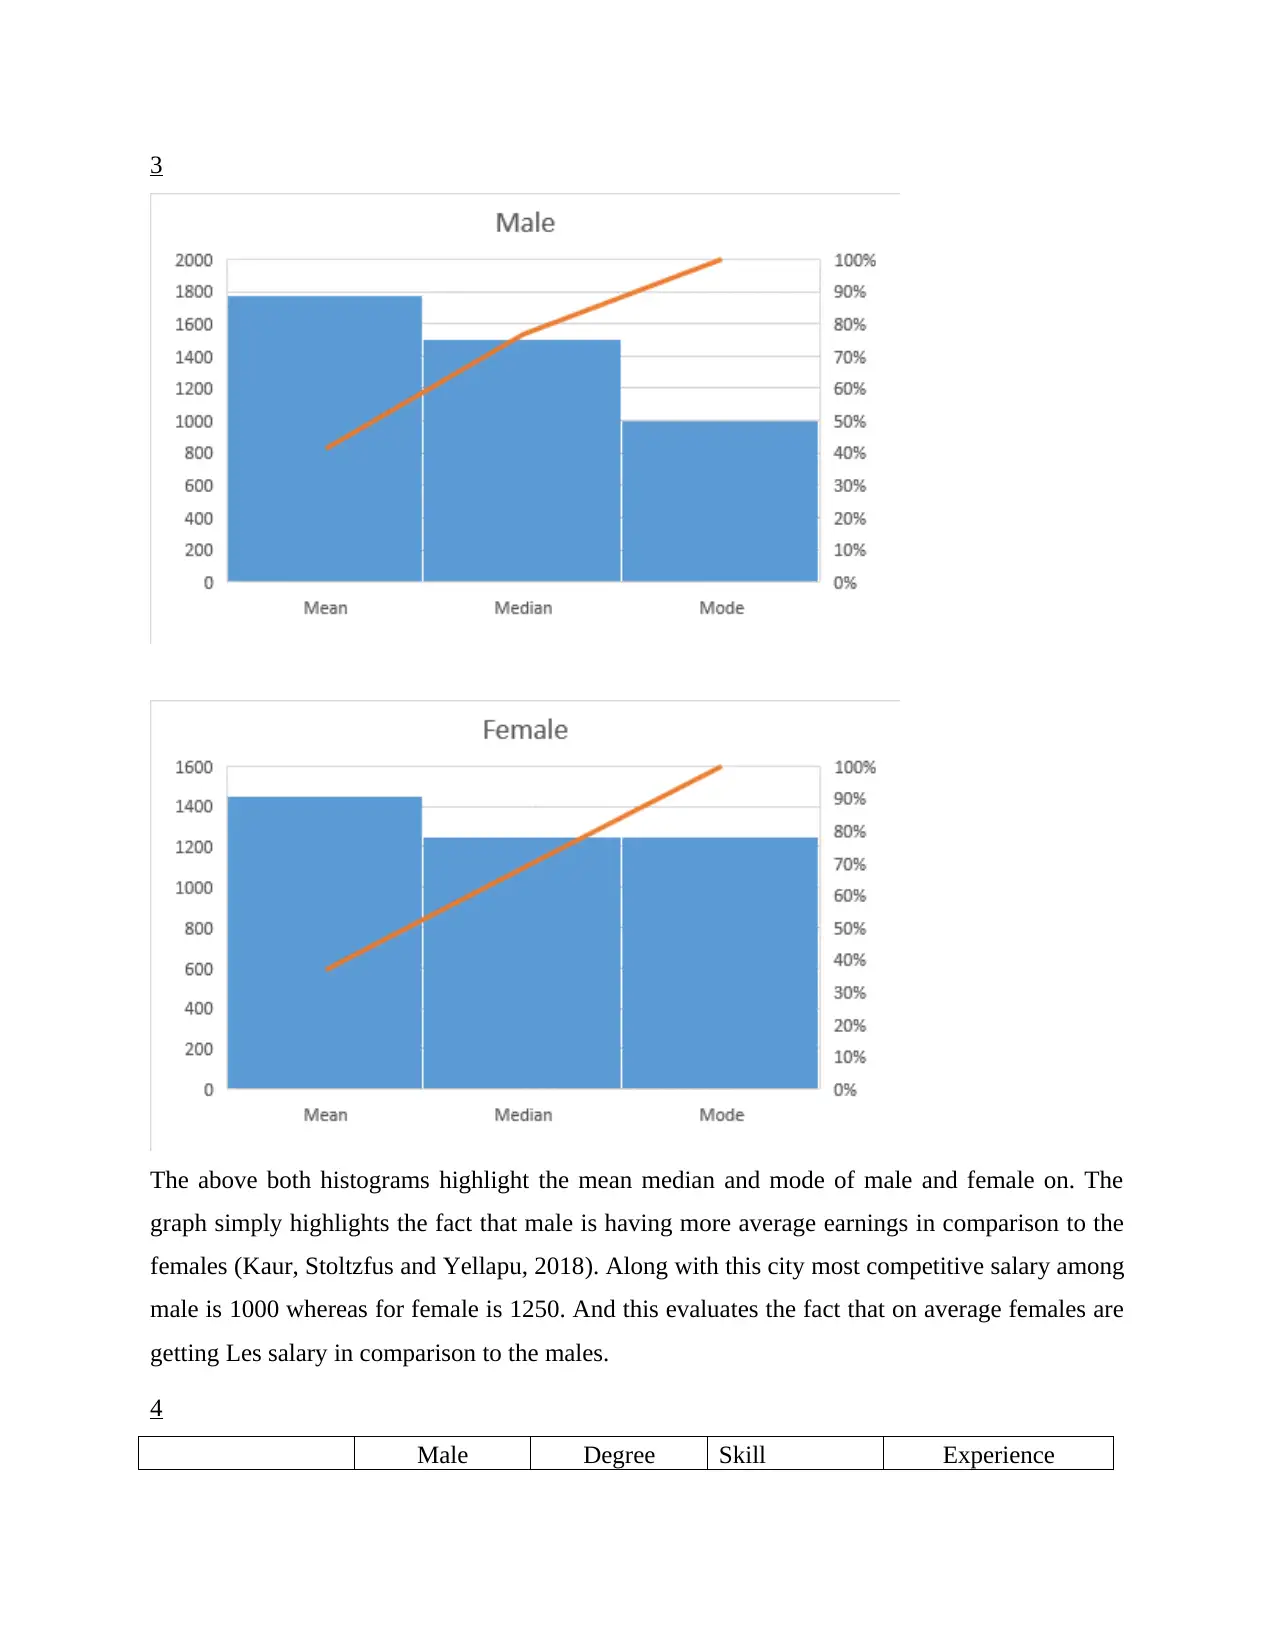
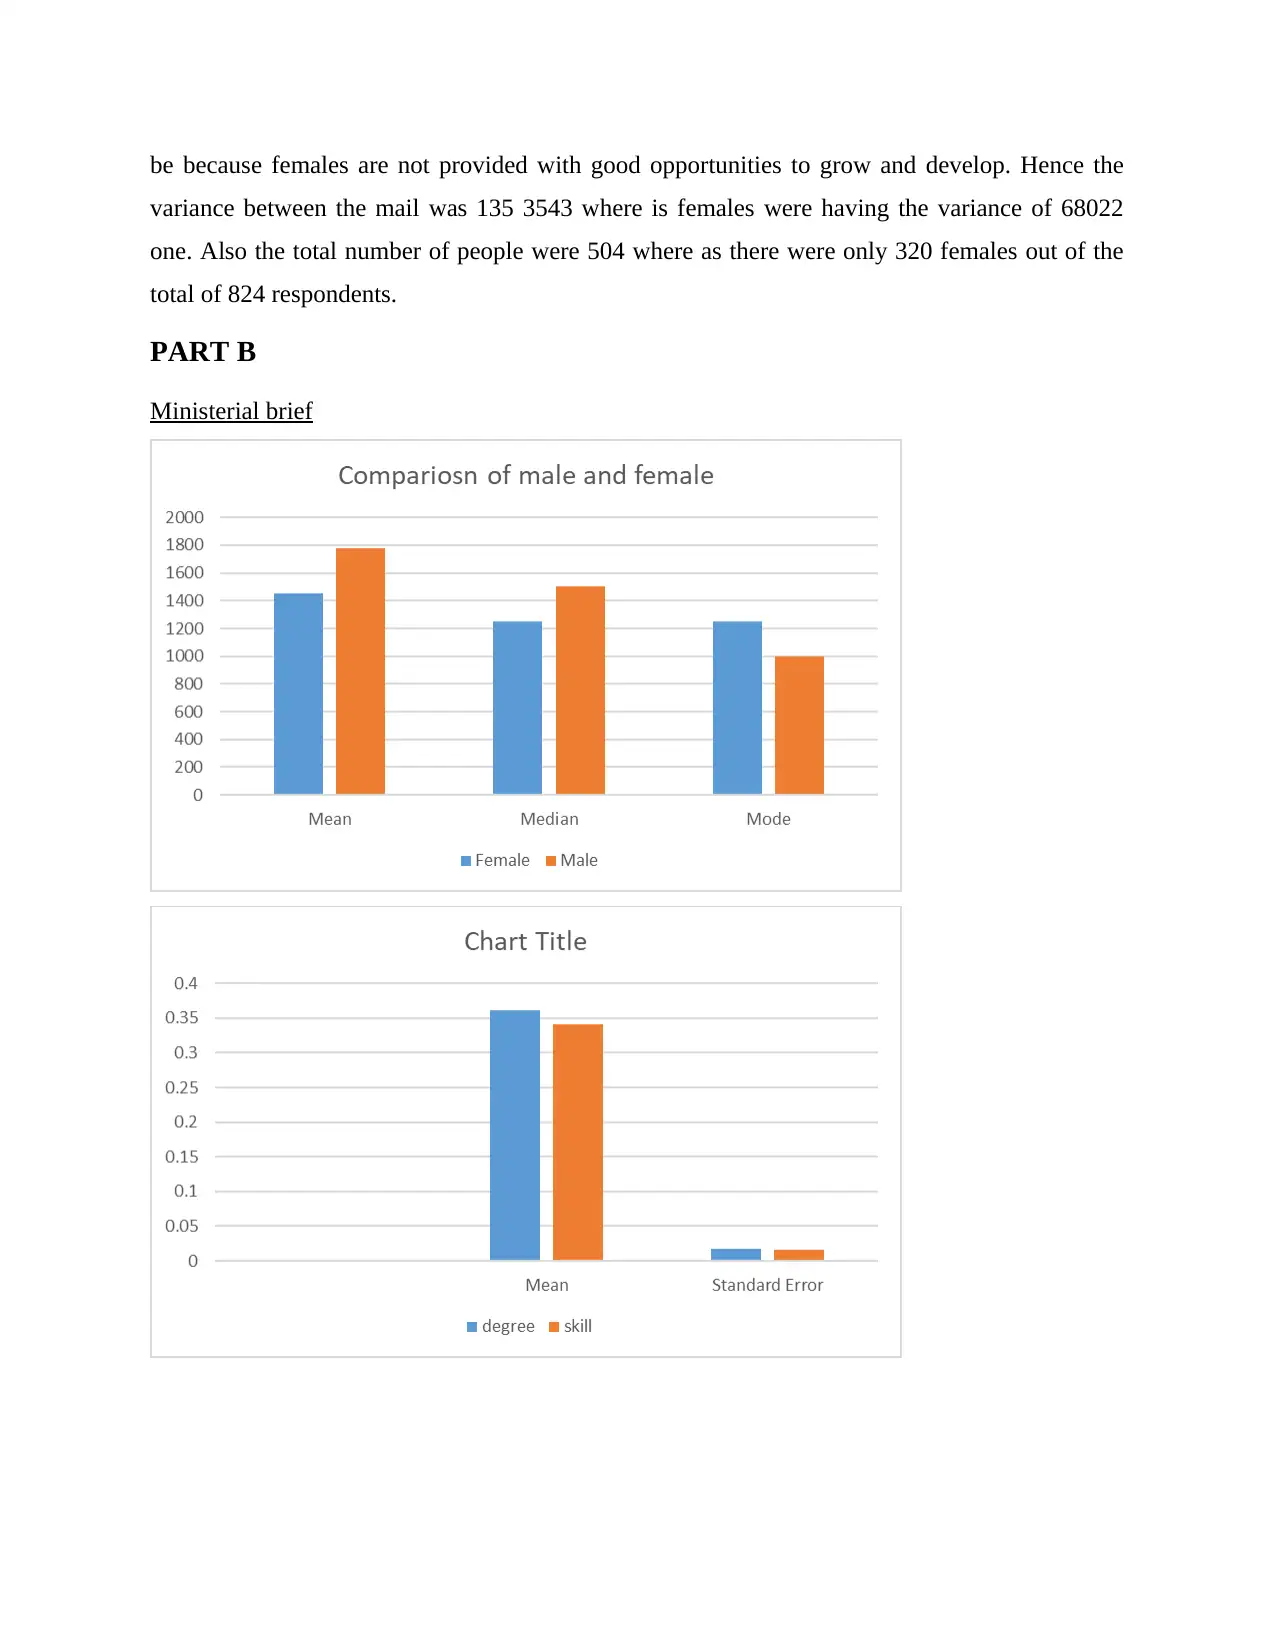
The above both histograms highlight the mean median and mode of male and female on. The
graph simply highlights the fact that male is having more average earnings in comparison to the
females (Kaur, Stoltzfus and Yellapu, 2018). Along with this city most competitive salary among
male is 1000 whereas for female is 1250. And this evaluates the fact that on average females are
getting Les salary in comparison to the males.
4
Male Degree Skill Experience
Mean 0.61165 0.36165 0.34102 11.335
Standard Error 0.01699 0.01675 0.01652 0.34216
Median 1 0 0 9
Mode 1 0 0 2
Standard
Deviation 0.48767 0.48077 0.47434 9.82184
Sample Variance 0.23782 0.23114 0.225 96.4685
Kurtosis -1.7937 -1.6712 -1.5523 1.15915
Skewness -0.459 0.57693 0.67195 1.30672
Range 1 1 1 47
Minimum 0 0 0 1
Maximum 1 1 1 48
Sum 504 298 281 9340
Count 824 824 824 824
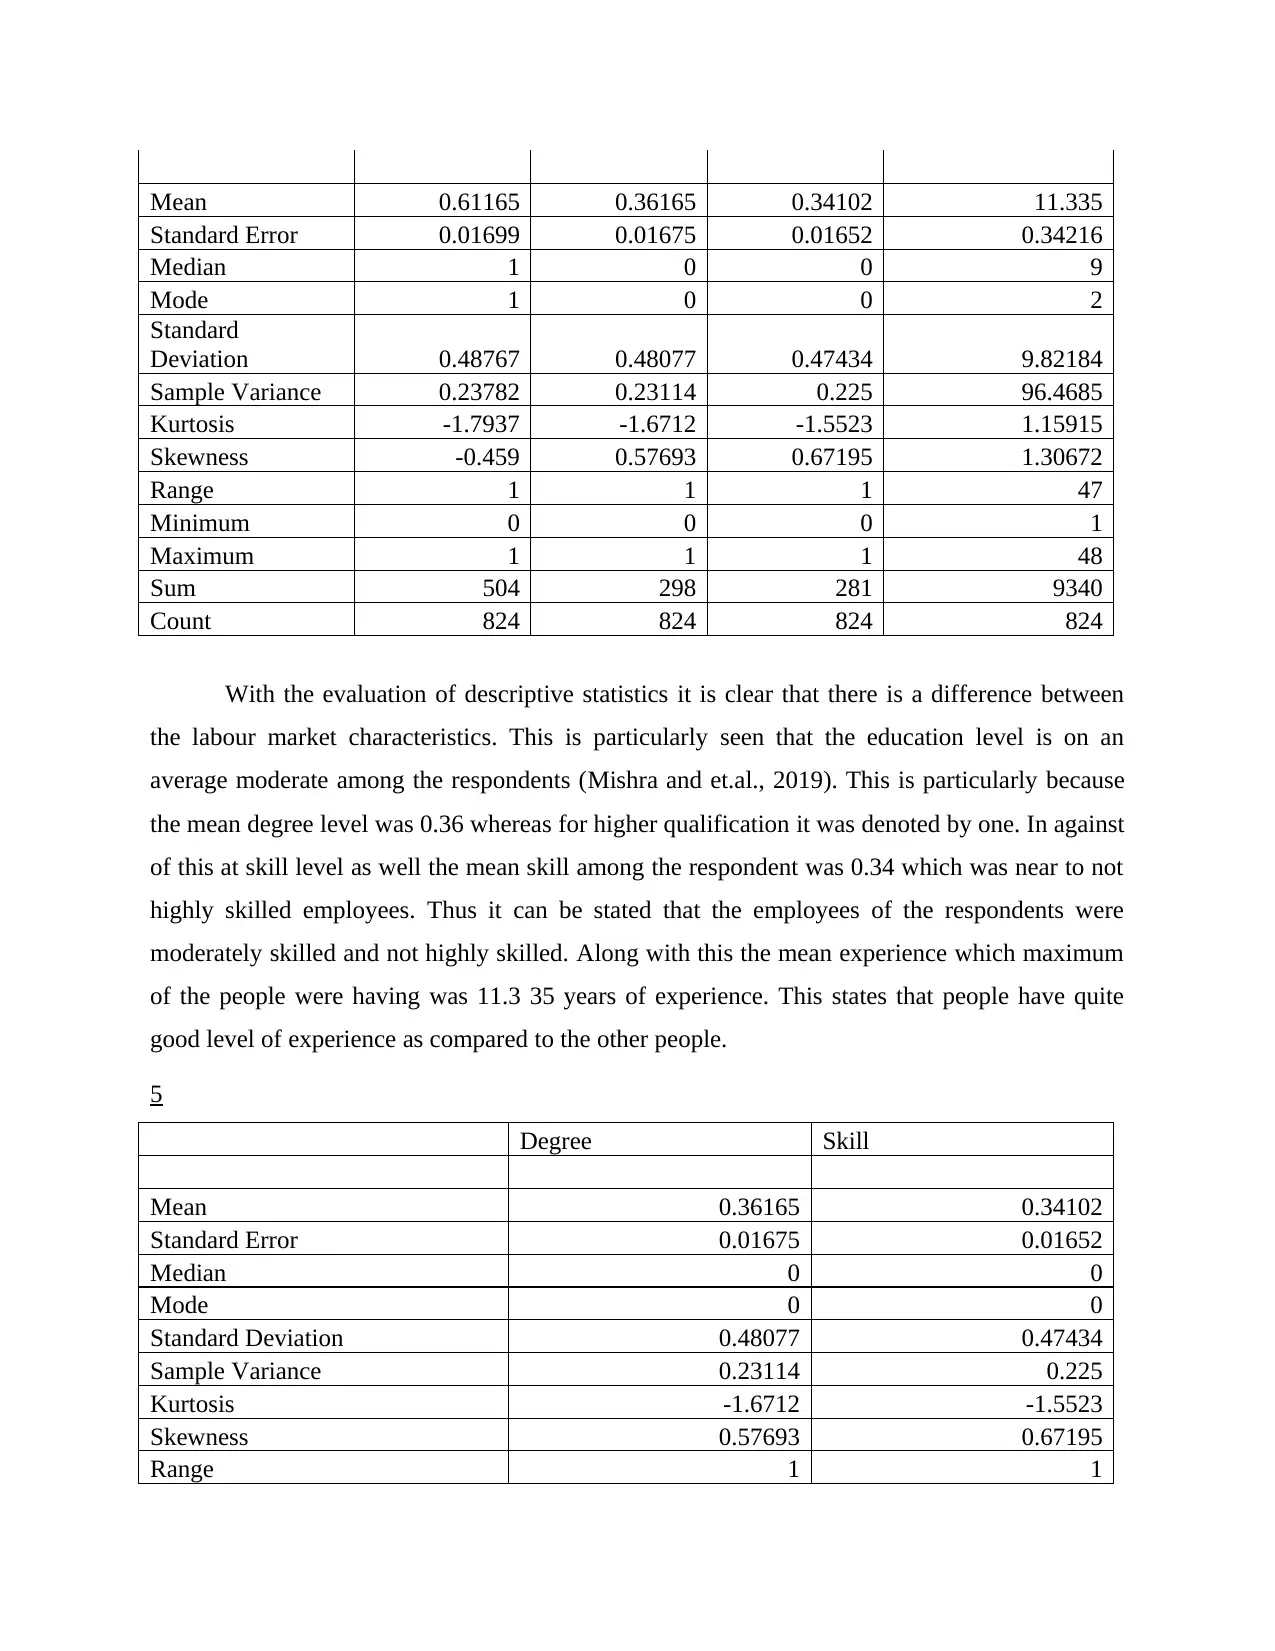
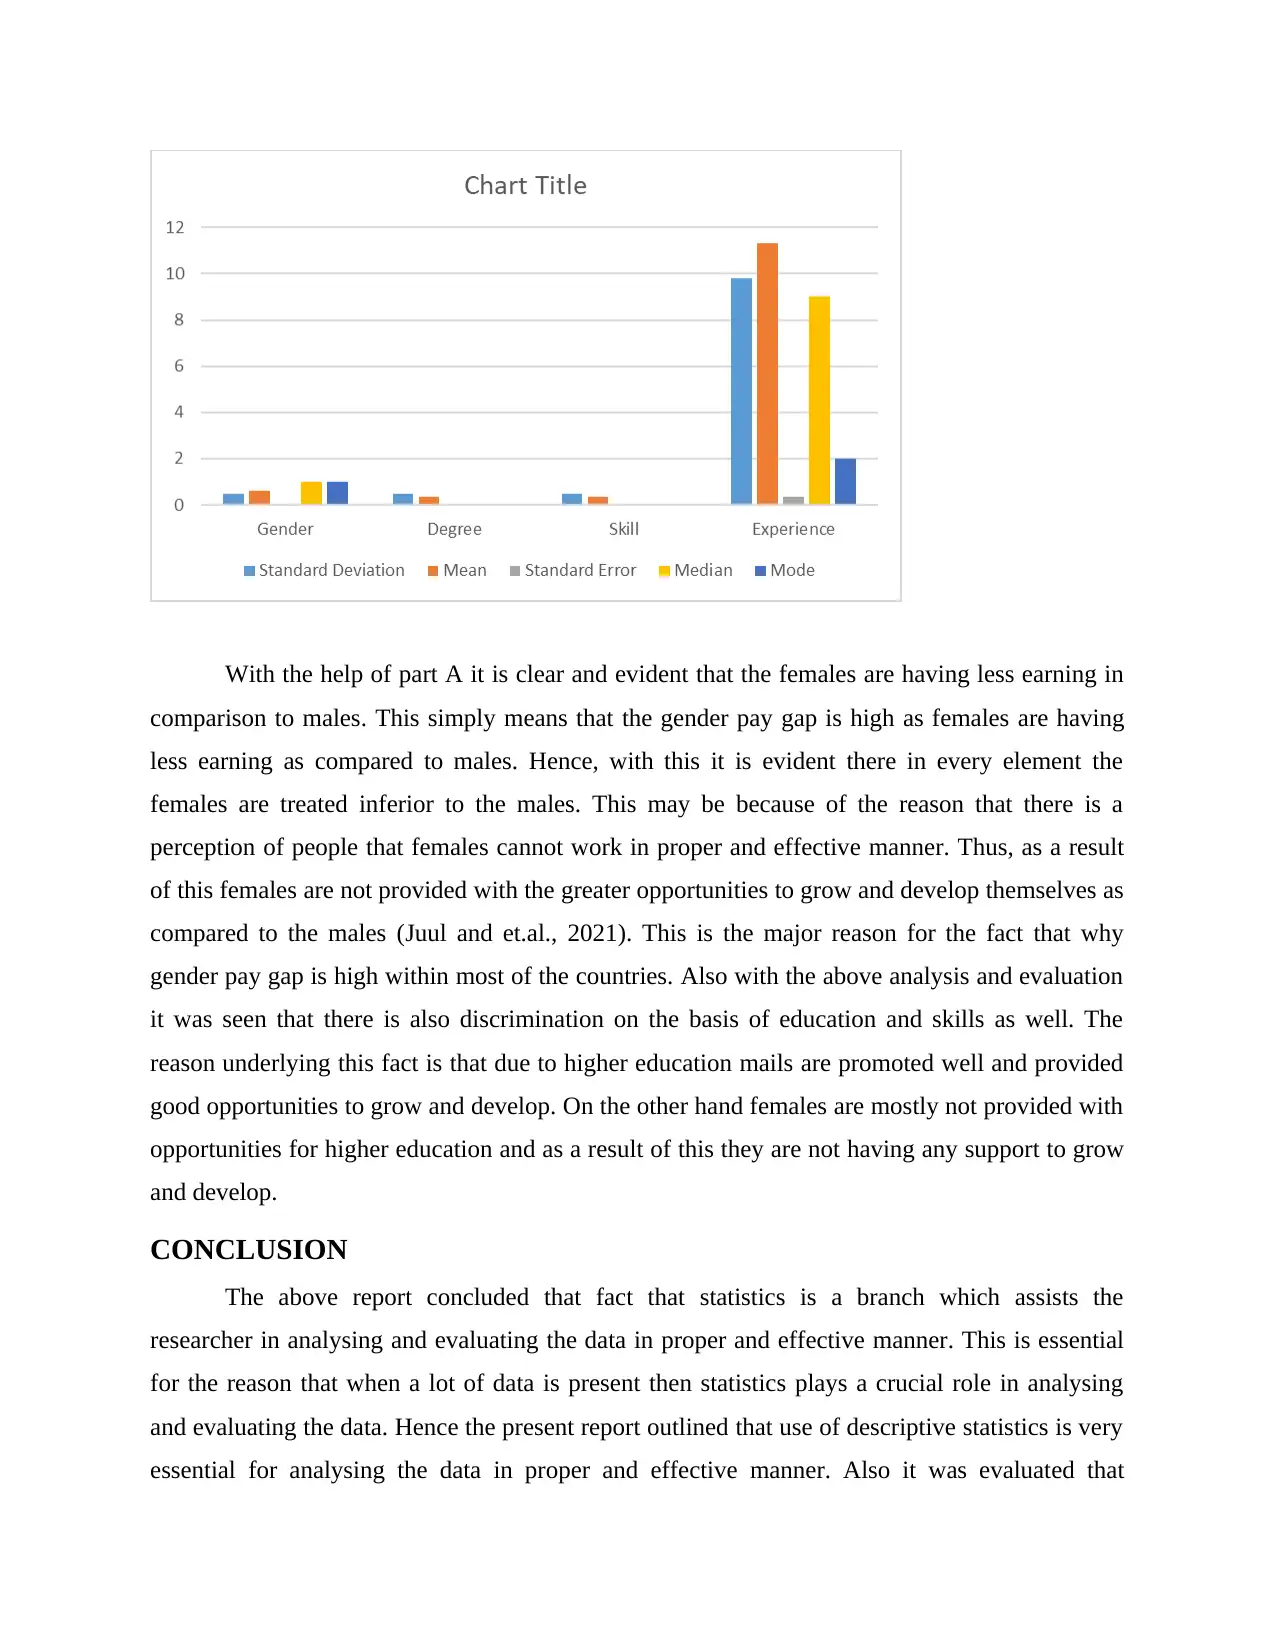
With the evaluation of descriptive statistics it is clear that there is a difference between
the labour market characteristics. This is particularly seen that the education level is on an
average moderate among the respondents (Mishra and et.al., 2019). This is particularly because
the mean degree level was 0.36 whereas for higher qualification it was denoted by one. In against
of this at skill level as well the mean skill among the respondent was 0.34 which was near to not
highly skilled employees. Thus it can be stated that the employees of the respondents were
moderately skilled and not highly skilled. Along with this the mean experience which maximum
of the people were having was 11.3 35 years of experience. This states that people have quite
good level of experience as compared to the other people.
5
Degree Skill
Mean 0.36165 0.34102
Standard Error 0.01675 0.01652
Median 0 0
Mode 0 0
Standard Deviation 0.48077 0.47434
Sample Variance 0.23114 0.225
Kurtosis -1.6712 -1.5523
Skewness 0.57693 0.67195
Range 1 1
Standard Error 0.01699 0.01675 0.01652 0.34216
Median 1 0 0 9
Mode 1 0 0 2
Standard
Deviation 0.48767 0.48077 0.47434 9.82184
Sample Variance 0.23782 0.23114 0.225 96.4685
Kurtosis -1.7937 -1.6712 -1.5523 1.15915
Skewness -0.459 0.57693 0.67195 1.30672
Range 1 1 1 47
Minimum 0 0 0 1
Maximum 1 1 1 48
Sum 504 298 281 9340
Count 824 824 824 824
With the evaluation of descriptive statistics it is clear that there is a difference between
the labour market characteristics. This is particularly seen that the education level is on an
average moderate among the respondents (Mishra and et.al., 2019). This is particularly because
the mean degree level was 0.36 whereas for higher qualification it was denoted by one. In against
of this at skill level as well the mean skill among the respondent was 0.34 which was near to not
highly skilled employees. Thus it can be stated that the employees of the respondents were
moderately skilled and not highly skilled. Along with this the mean experience which maximum
of the people were having was 11.3 35 years of experience. This states that people have quite
good level of experience as compared to the other people.
5
Degree Skill
Mean 0.36165 0.34102
Standard Error 0.01675 0.01652
Median 0 0
Mode 0 0
Standard Deviation 0.48077 0.47434
Sample Variance 0.23114 0.225
Kurtosis -1.6712 -1.5523
Skewness 0.57693 0.67195
Range 1 1
⊘ This is a preview!⊘
Do you want full access?
Subscribe today to unlock all pages.
Trusted by 1+ million students worldwide
Minimum 0 0
Maximum 1 1
Sum 298 281
Count 824 824
With an analysis of the descriptive statistics relating to degree and scale it was clear that on an
average people are not highly educated and 9 highly skilled (Vetter, 2017). This is particularly
because of the reason that the mean degree level was 0.361 which was low and the skill level
was also 0.34 one which is also low. Hence this simply means that people within the respondent
were not highly skilled and highly educated.
6
Male Female
Mean 1774.87 1449.78
Variance 1353543 682354
Observations 504 320
Hypothesized Mean Difference 0
Df 812
t Stat 4.68352
P(T<=t) one-tail 1.7E-06
t Critical one-tail 1.64673
P(T<=t) two-tail 3.3E-06
t Critical two-tail 1.96289
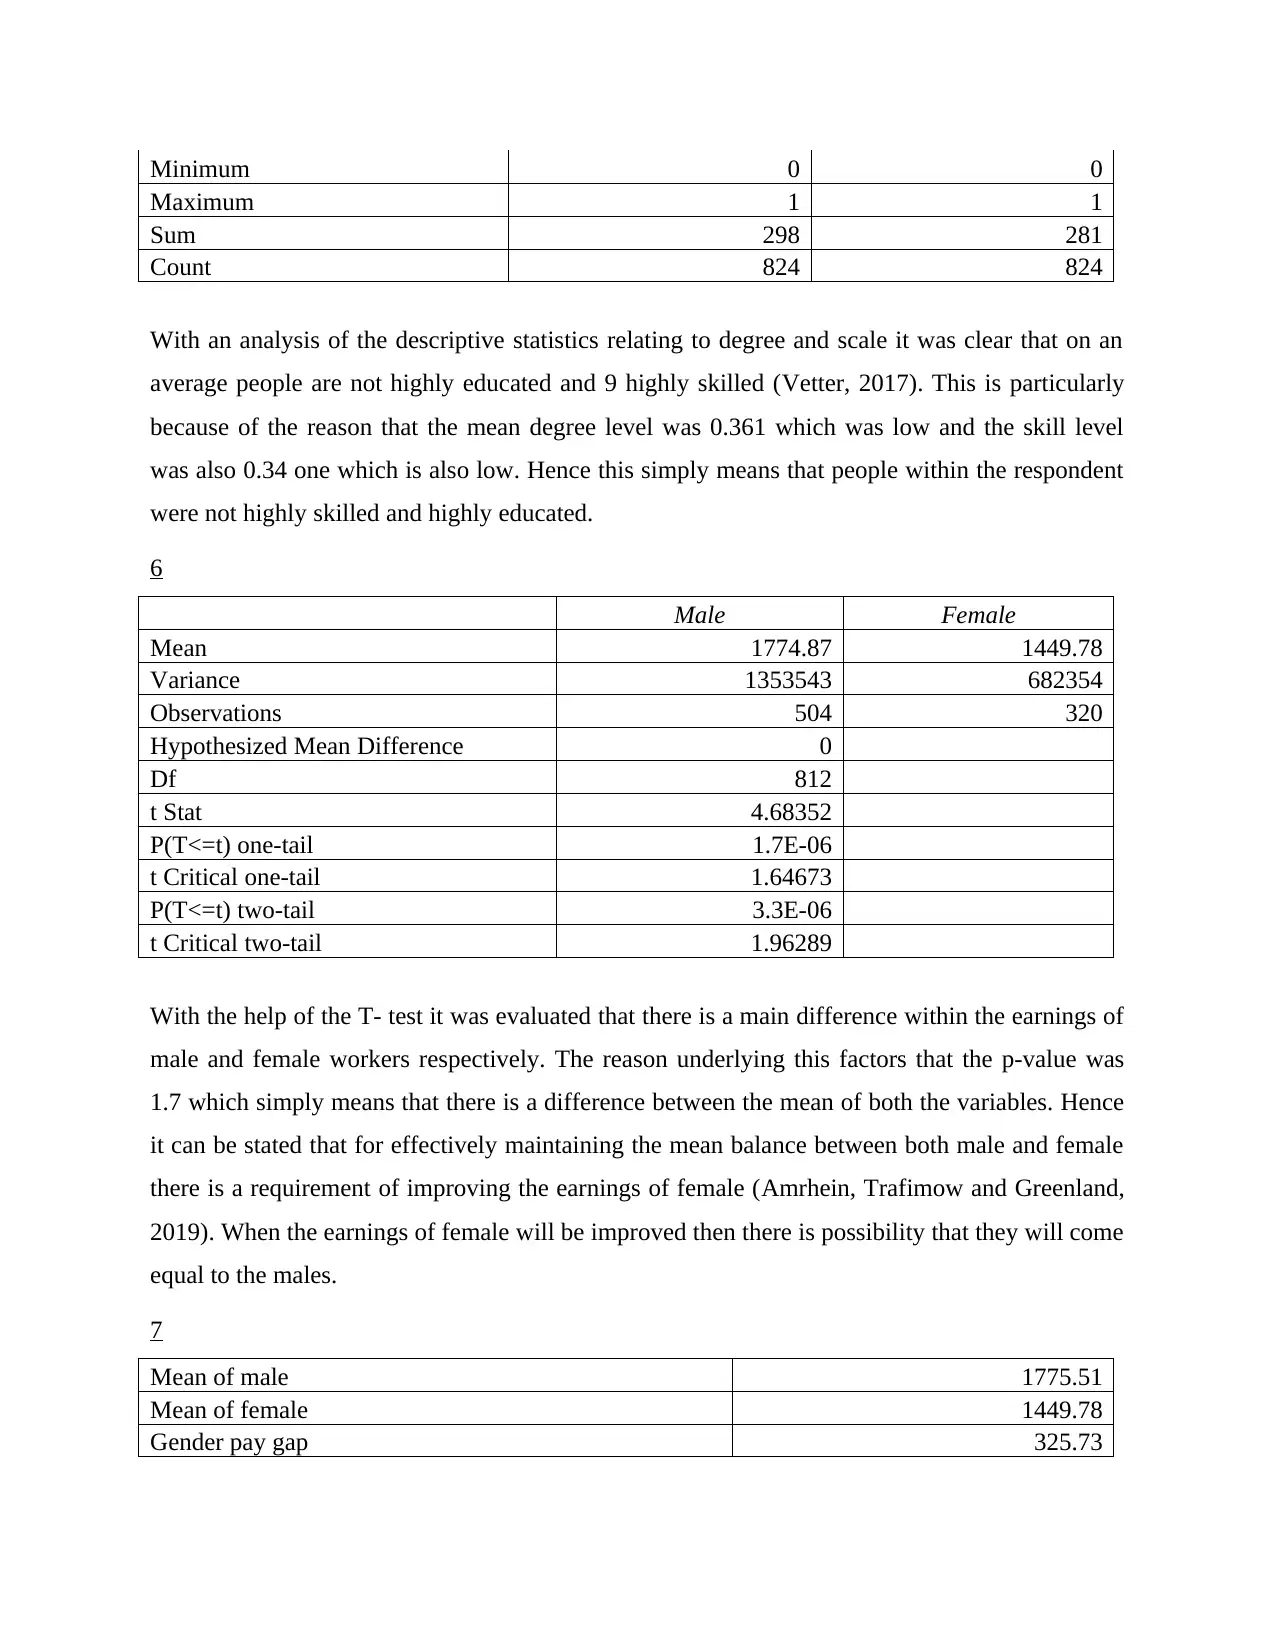
With the help of the T- test it was evaluated that there is a main difference within the earnings of
male and female workers respectively. The reason underlying this factors that the p-value was
1.7 which simply means that there is a difference between the mean of both the variables. Hence
it can be stated that for effectively maintaining the mean balance between both male and female
there is a requirement of improving the earnings of female (Amrhein, Trafimow and Greenland,
2019). When the earnings of female will be improved then there is possibility that they will come
equal to the males.
7
Mean of male 1775.51
Mean of female 1449.78
Gender pay gap 325.73
Maximum 1 1
Sum 298 281
Count 824 824
With an analysis of the descriptive statistics relating to degree and scale it was clear that on an
average people are not highly educated and 9 highly skilled (Vetter, 2017). This is particularly
because of the reason that the mean degree level was 0.361 which was low and the skill level
was also 0.34 one which is also low. Hence this simply means that people within the respondent
were not highly skilled and highly educated.
6
Male Female
Mean 1774.87 1449.78
Variance 1353543 682354
Observations 504 320
Hypothesized Mean Difference 0
Df 812
t Stat 4.68352
P(T<=t) one-tail 1.7E-06
t Critical one-tail 1.64673
P(T<=t) two-tail 3.3E-06
t Critical two-tail 1.96289
With the help of the T- test it was evaluated that there is a main difference within the earnings of
male and female workers respectively. The reason underlying this factors that the p-value was
1.7 which simply means that there is a difference between the mean of both the variables. Hence
it can be stated that for effectively maintaining the mean balance between both male and female
there is a requirement of improving the earnings of female (Amrhein, Trafimow and Greenland,
2019). When the earnings of female will be improved then there is possibility that they will come
equal to the males.
7
Mean of male 1775.51
Mean of female 1449.78
Gender pay gap 325.73
Paraphrase This Document
Need a fresh take? Get an instant paraphrase of this document with our AI Paraphraser
With the analysis of the Australian gender pay gap it was seen that in 2007 the cap was 400 US
dollar (Andrews, Gentzkow and Shapiro, 2020). However in the year 2007 it has decreased
325.73.this simply means Tata as compared to 2007 in the year 2017 the gap has decreased to a
great extent.
8
Mean 1449.78 0
Median 1250 0
Mode 1250 0
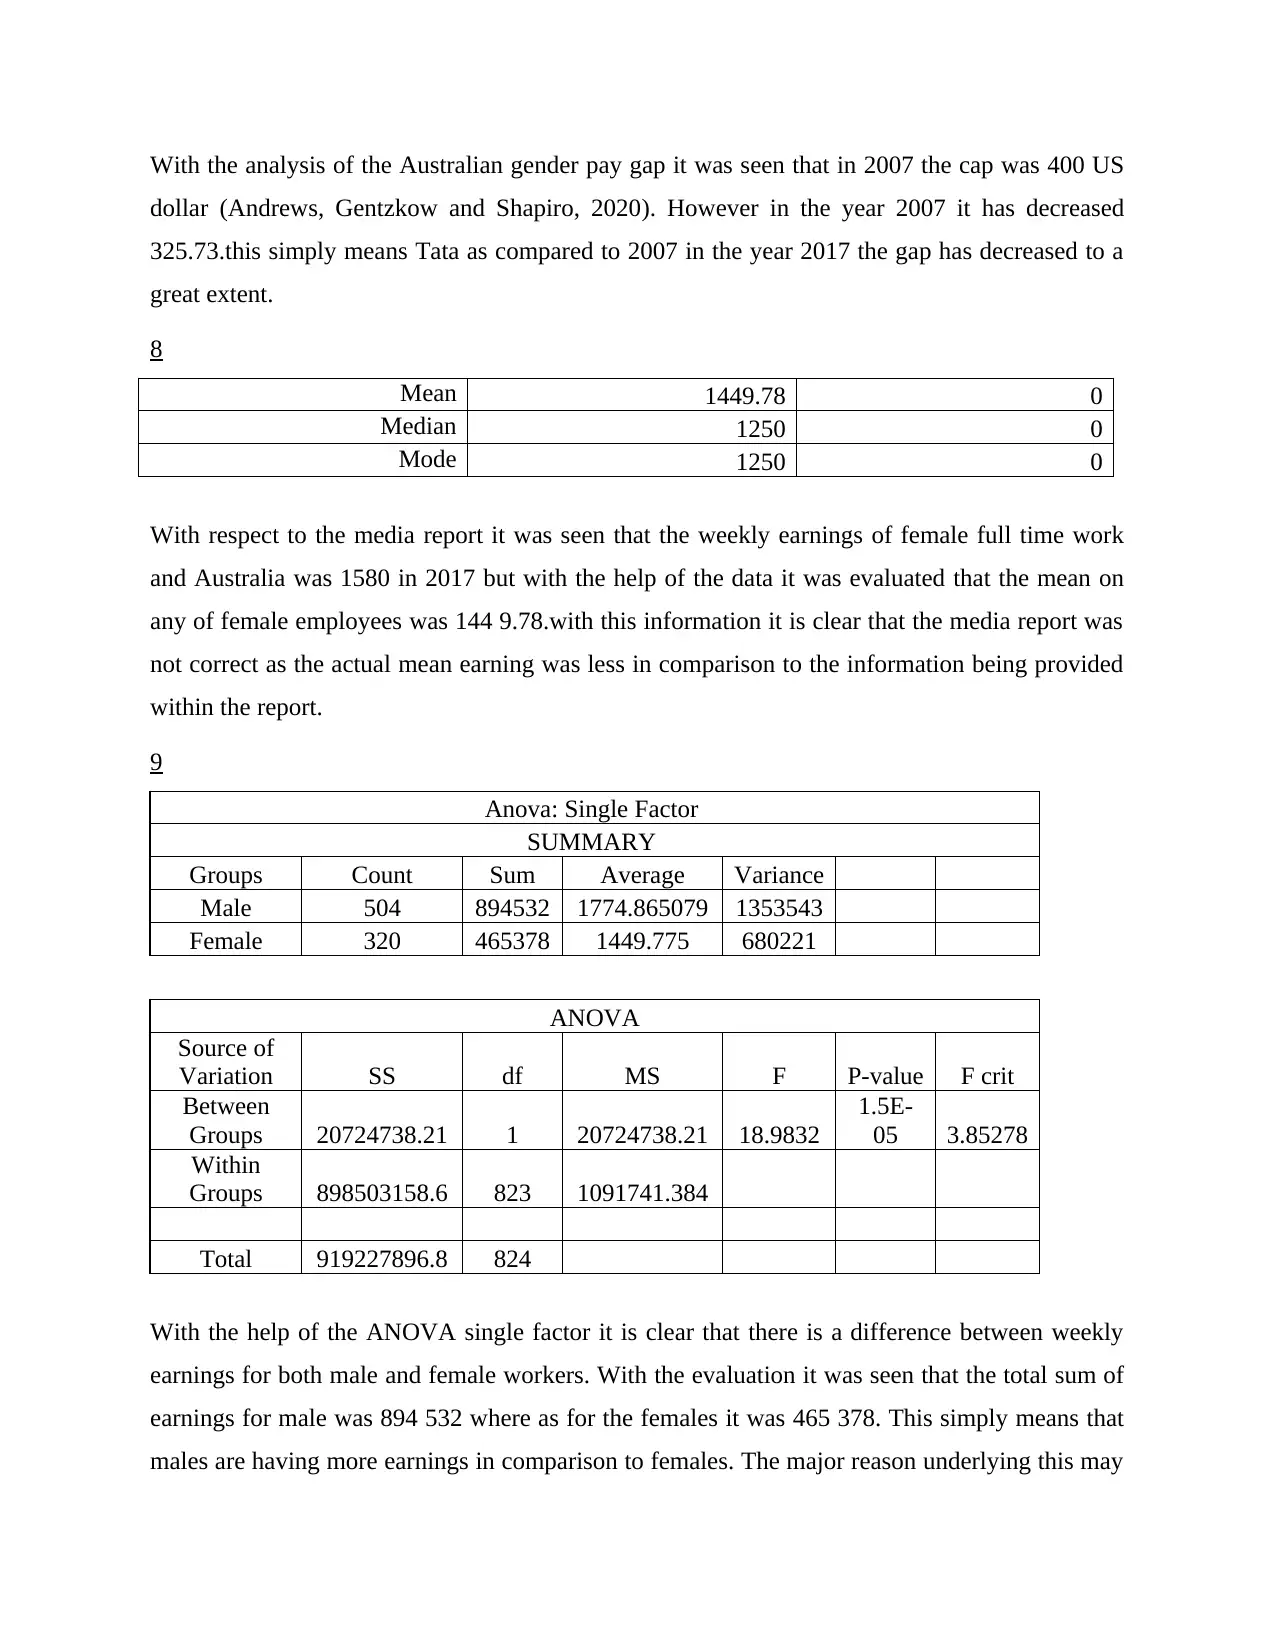
With respect to the media report it was seen that the weekly earnings of female full time work
and Australia was 1580 in 2017 but with the help of the data it was evaluated that the mean on
any of female employees was 144 9.78.with this information it is clear that the media report was
not correct as the actual mean earning was less in comparison to the information being provided
within the report.
9
Anova: Single Factor
SUMMARY
Groups Count Sum Average Variance
Male 504 894532 1774.865079 1353543
Female 320 465378 1449.775 680221
ANOVA
Source of
Variation SS df MS F P-value F crit
Between
Groups 20724738.21 1 20724738.21 18.9832
1.5E-
05 3.85278
Within
Groups 898503158.6 823 1091741.384
Total 919227896.8 824
With the help of the ANOVA single factor it is clear that there is a difference between weekly
earnings for both male and female workers. With the evaluation it was seen that the total sum of
earnings for male was 894 532 where as for the females it was 465 378. This simply means that
males are having more earnings in comparison to females. The major reason underlying this may
dollar (Andrews, Gentzkow and Shapiro, 2020). However in the year 2007 it has decreased
325.73.this simply means Tata as compared to 2007 in the year 2017 the gap has decreased to a
great extent.
8
Mean 1449.78 0
Median 1250 0
Mode 1250 0
With respect to the media report it was seen that the weekly earnings of female full time work
and Australia was 1580 in 2017 but with the help of the data it was evaluated that the mean on
any of female employees was 144 9.78.with this information it is clear that the media report was
not correct as the actual mean earning was less in comparison to the information being provided
within the report.
9
Anova: Single Factor
SUMMARY
Groups Count Sum Average Variance
Male 504 894532 1774.865079 1353543
Female 320 465378 1449.775 680221
ANOVA
Source of
Variation SS df MS F P-value F crit
Between
Groups 20724738.21 1 20724738.21 18.9832
1.5E-
05 3.85278
Within
Groups 898503158.6 823 1091741.384
Total 919227896.8 824
With the help of the ANOVA single factor it is clear that there is a difference between weekly
earnings for both male and female workers. With the evaluation it was seen that the total sum of
earnings for male was 894 532 where as for the females it was 465 378. This simply means that
males are having more earnings in comparison to females. The major reason underlying this may
be because females are not provided with good opportunities to grow and develop. Hence the
variance between the mail was 135 3543 where is females were having the variance of 68022
one. Also the total number of people were 504 where as there were only 320 females out of the
total of 824 respondents.
PART B
Ministerial brief
variance between the mail was 135 3543 where is females were having the variance of 68022
one. Also the total number of people were 504 where as there were only 320 females out of the
total of 824 respondents.
PART B
Ministerial brief
⊘ This is a preview!⊘
Do you want full access?
Subscribe today to unlock all pages.
Trusted by 1+ million students worldwide
With the help of part A it is clear and evident that the females are having less earning in
comparison to males. This simply means that the gender pay gap is high as females are having
less earning as compared to males. Hence, with this it is evident there in every element the
females are treated inferior to the males. This may be because of the reason that there is a
perception of people that females cannot work in proper and effective manner. Thus, as a result
of this females are not provided with the greater opportunities to grow and develop themselves as
compared to the males (Juul and et.al., 2021). This is the major reason for the fact that why
gender pay gap is high within most of the countries. Also with the above analysis and evaluation
it was seen that there is also discrimination on the basis of education and skills as well. The
reason underlying this fact is that due to higher education mails are promoted well and provided
good opportunities to grow and develop. On the other hand females are mostly not provided with
opportunities for higher education and as a result of this they are not having any support to grow
and develop.
CONCLUSION
The above report concluded that fact that statistics is a branch which assists the
researcher in analysing and evaluating the data in proper and effective manner. This is essential
for the reason that when a lot of data is present then statistics plays a crucial role in analysing
and evaluating the data. Hence the present report outlined that use of descriptive statistics is very
essential for analysing the data in proper and effective manner. Also it was evaluated that
Paraphrase This Document
Need a fresh take? Get an instant paraphrase of this document with our AI Paraphraser

undertaking the use of graph representation is also essential to present the data in more effective
and clear manner.
and clear manner.
REFERENCES
Books and Journals
Amrhein, V., Trafimow, D. and Greenland, S., 2019. Inferential statistics as descriptive
statistics: There is no replication crisis if we don’t expect replication. The American
Statistician. 73(sup1). pp.262-270.
Andrews, I., Gentzkow, M. and Shapiro, J.M., 2020. On the informativeness of descriptive
statistics for structural estimates. Econometrica. 88(6). pp.2231-2258.
Juul, J.L. and et.al., 2021. Fixed-time descriptive statistics underestimate extremes of epidemic
curve ensembles. Nature physics. 17(1). pp.5-8.
Kaur, P., Stoltzfus, J. and Yellapu, V., 2018. Descriptive statistics. International Journal of
Academic Medicine. 4(1). p.60.
Mishra, P. and et.al., 2019. Descriptive statistics and normality tests for statistical data. Annals of
cardiac anaesthesia. 22(1). p.67.
Vetter, T.R., 2017. Descriptive statistics: Reporting the answers to the 5 basic questions of who,
what, why, when, where, and a sixth, so what?. Anesthesia & Analgesia. 125(5). pp.1797-
1802.
⊘ This is a preview!⊘
Do you want full access?
Subscribe today to unlock all pages.
Trusted by 1+ million students worldwide
1 out of 12
Related Documents


Your All-in-One AI-Powered Toolkit for Academic Success.
+13062052269
info@desklib.com
Available 24*7 on WhatsApp / Email
![[object Object]](/_next/static/media/star-bottom.7253800d.svg)
Unlock your academic potential
Copyright © 2020–2026 A2Z Services. All Rights Reserved. Developed and managed by ZUCOL.