ECON232: Difference-in-Difference Analysis and Project Evaluations
VerifiedAdded on 2023/06/14
|10
|1932
|395
Homework Assignment
AI Summary
This ECON232 assignment solution provides a detailed analysis of the difference-in-difference (diff-in-diff) method and its application to various project evaluation scenarios. The first part includes summary statistics comparing treatment and control villages, examining differences in age, education, gender, access to electricity, piped water, and distance from the capital. It calculates the naïve diff-in-diff estimate and estimates the treatment effect using regression analysis, discussing the key assumptions for causal interpretation and how to test them. The second part presents hypothetical case studies, such as evaluating the impact of artificial reefs, assessing the effectiveness of computers in improving pirates' skills, analyzing the effect of happy thoughts on flying ability, determining whether coming to Neverland makes children happier, and evaluating the ferocity of pirates recruited from rural areas, suggesting appropriate evaluation approaches like diff-in-diff, instrumental variables (IV), and risk difference (RD) for each scenario.

Running Header: ECON232 1
ECON232
Sunsets name:
ID number:
Institution:
ECON232
Sunsets name:
ID number:
Institution:
Paraphrase This Document
Need a fresh take? Get an instant paraphrase of this document with our AI Paraphraser

ECON232 2
PART 1: Difference-in-difference
Q1) Present summary statistics for treatment villages vs. control villages. Specifically, test
whether differences in age, education, and gender are statistically different between the
treatment and control group.
Summary statistics for treatment villages vs. control villages
ANOVA
The p-values of the different tests have a p-value < 0.05. Thus we, we reject the null hypothesis
that the group has no effect on the two ratings of treatment. Therefore, age, education, and
gender are statistically different between the treatment and control group.
Q2) Present community summary statistics for treatment villages vs. control villages. Are
there any differences? Look at access to electricity, piped water, and distance from the
capital. Do a test to see whether differences are statistically different between the treatment
and control group.
ECON232 3
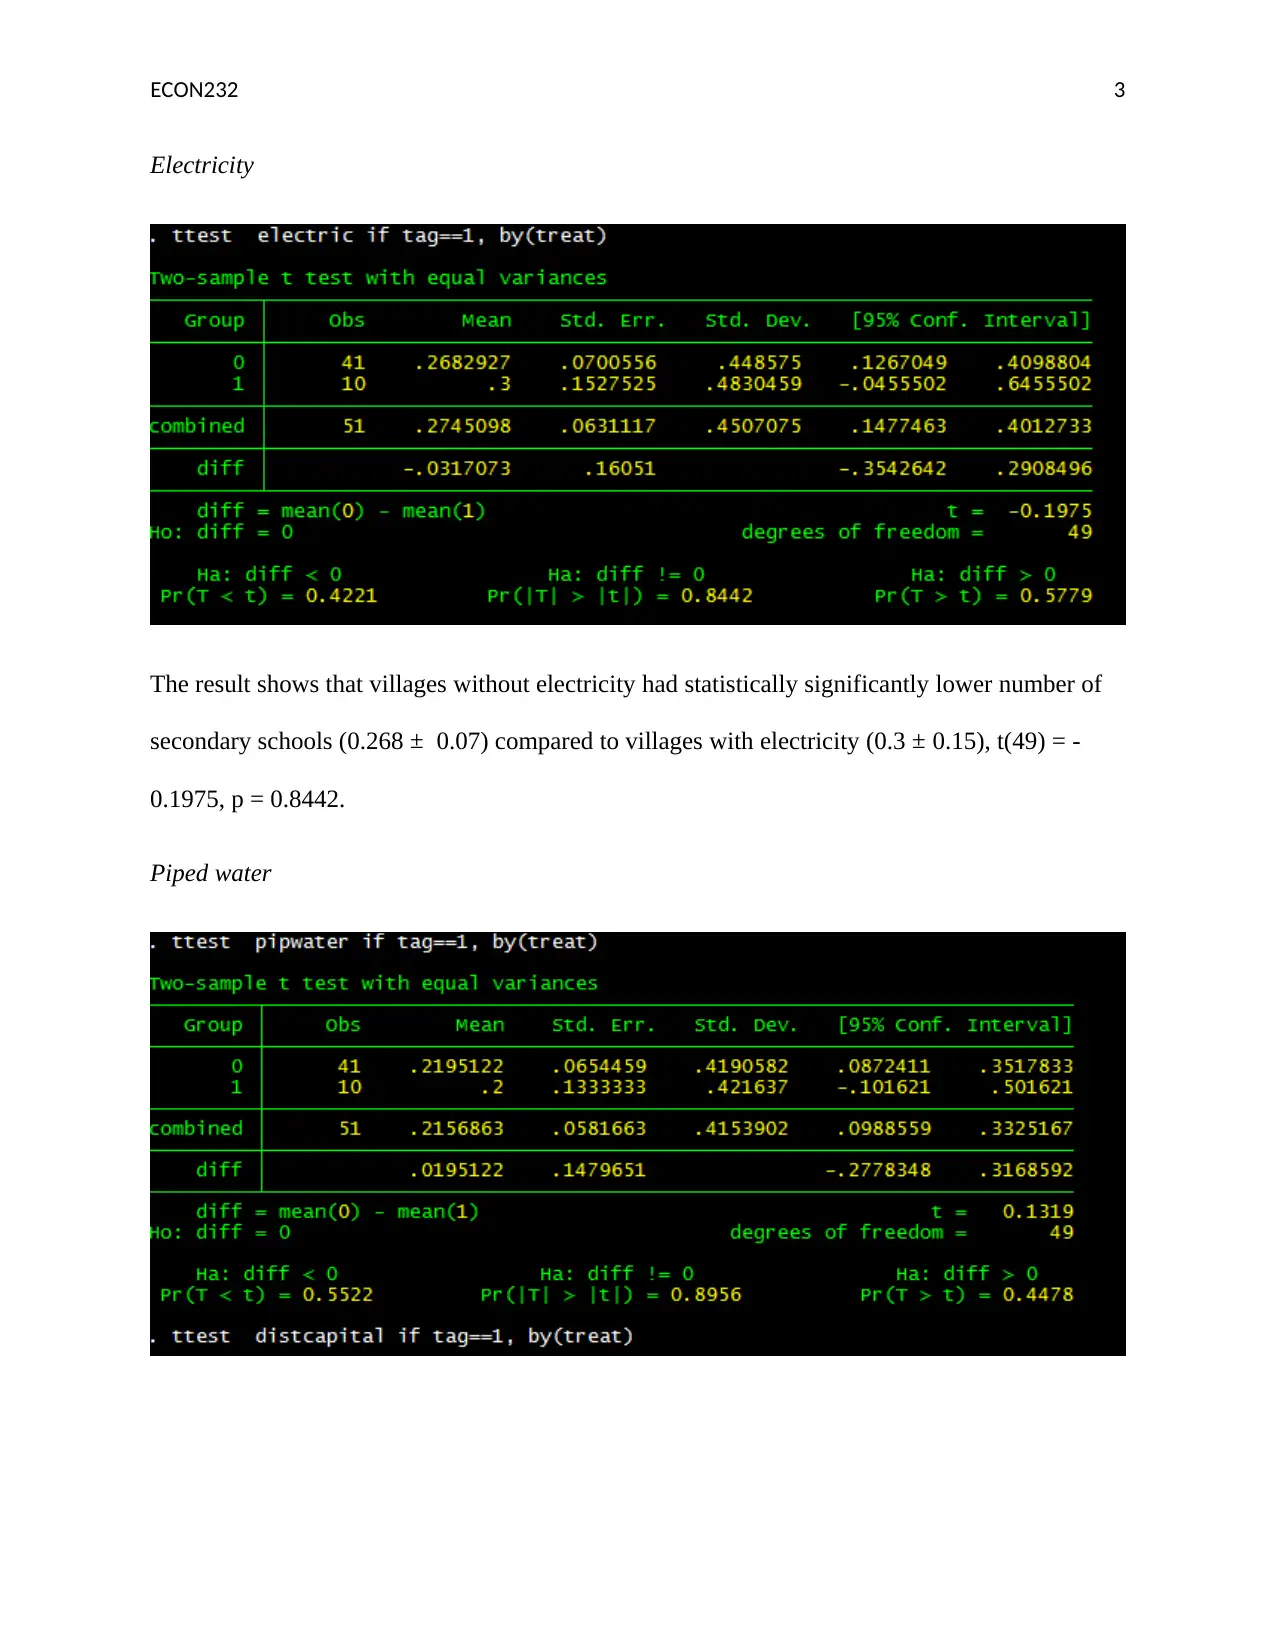
Electricity
The result shows that villages without electricity had statistically significantly lower number of
secondary schools (0.268 ± 0.07) compared to villages with electricity (0.3 ± 0.15), t(49) = -
0.1975, p = 0.8442.
Piped water
Electricity
The result shows that villages without electricity had statistically significantly lower number of
secondary schools (0.268 ± 0.07) compared to villages with electricity (0.3 ± 0.15), t(49) = -
0.1975, p = 0.8442.
Piped water
⊘ This is a preview!⊘
Do you want full access?
Subscribe today to unlock all pages.
Trusted by 1+ million students worldwide
ECON232 4
The result shows that villages without piped water had statistically significantly lower number of
secondary schools (0.22 ± 0.07) compared to villages with piped water (0.2 ± 0.2), t(49) =
0.1319, p = 0.8956.
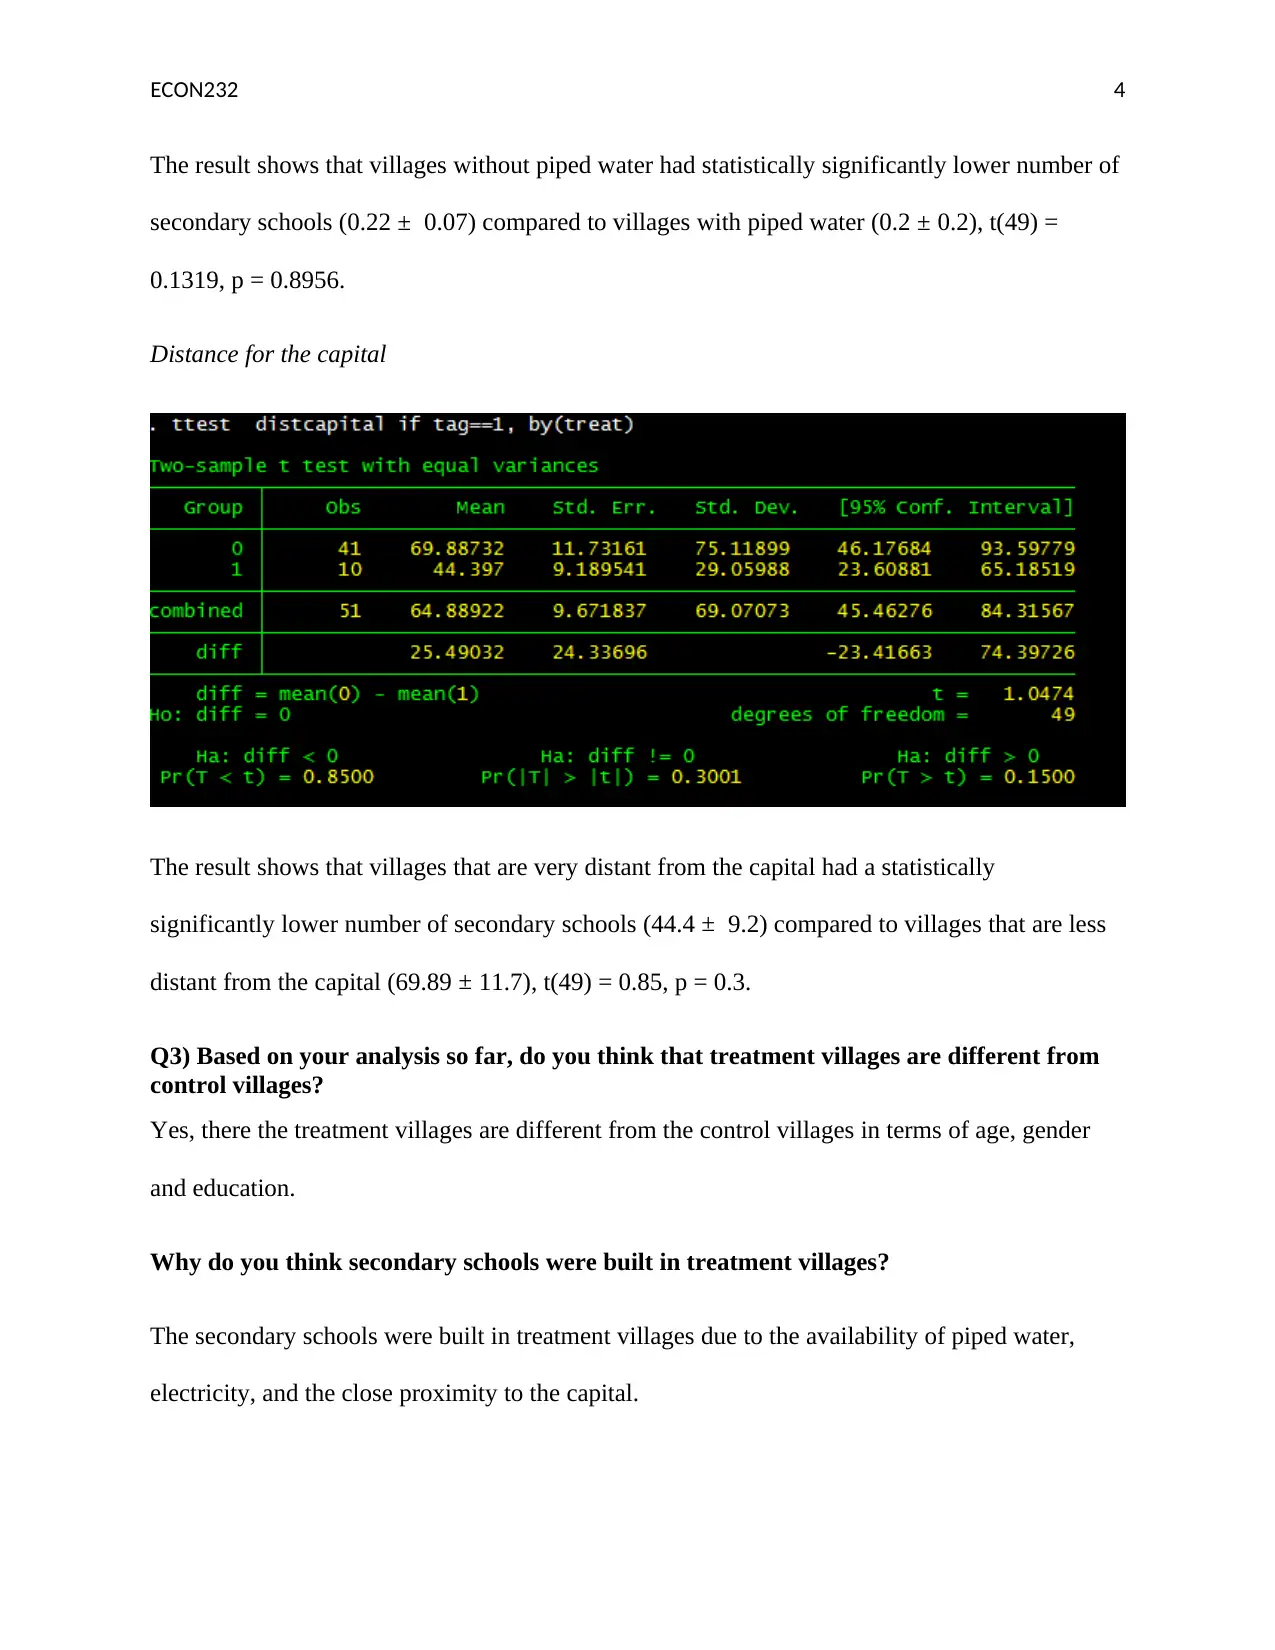
Distance for the capital
The result shows that villages that are very distant from the capital had a statistically
significantly lower number of secondary schools (44.4 ± 9.2) compared to villages that are less
distant from the capital (69.89 ± 11.7), t(49) = 0.85, p = 0.3.
Q3) Based on your analysis so far, do you think that treatment villages are different from
control villages?
Yes, there the treatment villages are different from the control villages in terms of age, gender
and education.
Why do you think secondary schools were built in treatment villages?
The secondary schools were built in treatment villages due to the availability of piped water,
electricity, and the close proximity to the capital.
The result shows that villages without piped water had statistically significantly lower number of
secondary schools (0.22 ± 0.07) compared to villages with piped water (0.2 ± 0.2), t(49) =
0.1319, p = 0.8956.
Distance for the capital
The result shows that villages that are very distant from the capital had a statistically
significantly lower number of secondary schools (44.4 ± 9.2) compared to villages that are less
distant from the capital (69.89 ± 11.7), t(49) = 0.85, p = 0.3.
Q3) Based on your analysis so far, do you think that treatment villages are different from
control villages?
Yes, there the treatment villages are different from the control villages in terms of age, gender
and education.
Why do you think secondary schools were built in treatment villages?
The secondary schools were built in treatment villages due to the availability of piped water,
electricity, and the close proximity to the capital.
Paraphrase This Document
Need a fresh take? Get an instant paraphrase of this document with our AI Paraphraser

ECON232 5
Q4) We are now going to get the naïve diff-in-diff estimate. Please calculate the effect of
having a new secondary school built in your village using the two-by-two table of summary
statistics that characterizes the diff-in-diff models.
From the figure above, it is evident that 342 persons not aged 6 to 16 completed primary school
with no secondary school while 18 of those in the cohort 6 to 16 years completed primary school
with secondary schools available. Conversely, 674 persons not aged 6 to 16 completed primary
school with no secondary school while 165 of those in the cohort 6 to 16 years completed
primary school with secondary schools available.
Q5) We will now estimate the treatment effect using a diff-in-diff regression. Write out the
regression model and estimate it. Which coefficient shows the causal effect of building new
schools? Is it statistically significant (at the 5% level)? How does it compare to your
response in Q4?

ECON232 6
For every unit increase in ycohort, we expect 1.812 increase in the log-odds of the dependent
variable primary. Consequently, for every unit increase in ycohort with access to secondary
school, we expect a 0.865 increase in the log-odds of the dependent variable primary. The
coefficients are statistically significant at p = 0.05. The results compares with Q4 as the presence
of secondary schools does not significantly affects completion of secondary school.
Q6) What is the main assumption you need to make in the difference-in-difference model in
order to interpret the effect you estimate above as causal? (In other words, what is
necessary to happen so that you don’t have biased results?)
The main assumptions to interpret the effect estimated as casual the assumptions of
exchangeability, positivity and stable unit treatment value assumption must hold. The
assumption that is commonly used is parallel trend assumption.
How would you test this assumption?
The parallel trend assumption is tested by ensuring that the absence of treatment, the difference
between control and treatment group is constant over time.
Explain what data you would need and what regression model or graph you would use.
A graph is necessary which is plotted by the treatment group against time.
⊘ This is a preview!⊘
Do you want full access?
Subscribe today to unlock all pages.
Trusted by 1+ million students worldwide

ECON232 7
PART 2:
Q1: The lost boys of Neverland build a few artificial reefs around several of their coastal
villages. Artificial reefs are great for marine life and are believed to stimulate tourism. Yet,
as any good economist, the lost boys don’t want to take things for granted. They want to
know whether the artificial reefs they built indeed helped local businesses. They ask you to
do the evaluation. What evaluation approach would you suggest and what data would you
ask for/collect?
The evaluation approach that should be used is Diff-in-diff. The data to be used is in the
regression model will be the level of business before and after installation of the artificial reefs.
The artificial reefs will be the independent variable while the level of business will be the
dependent variables.
Q2: Captain Cook is fed up with Peter Pan always outsmarting him and his pirates. He
hears that there is a magic box called a “computer” that could give out fighting secrets if
his pirates know how to use it. But he doesn’t really know what this computer thing does
and whether its secrets are actually useful so he wants to formally test whether these metal
boxes are effective in improving the skills of his pirates. He comes to you for help before he
buys any computers. What evaluation approach would you suggest and what data would
you ask for/collect?
The evaluation approach that should be used for Cook is Instrumental Variable (IV). IV is used
in a regression analysis when there is an endogenous variable that is influenced by other
variables (Stock & Yogo, 2005). The data needed for this is the level of skills his pirates have
before and after the boxes are introduced. Then the skills levels will be regressed against the use
of computers.
Q3: As you know, the lost boys can fly if they can generate a certain number of “lovely
wonderful thoughts”. Tinker Bell likes the number 33. So she decided that if they generate
33 or more happy thoughts, they can fly. While most lost boys are pretty happy and can
easily generate at least 25 happy thoughts, some fall short of the required number and
cannot fly. Peter Pan is lobbying for Tinker Bell to get rid of that arbitrary rule and he is
gathering evidence to prove that flying is good because it builds self-confidence. He comes
to you for help. What evaluation approach would you suggest and what data would you ask
for/collect?
Paraphrase This Document
Need a fresh take? Get an instant paraphrase of this document with our AI Paraphraser

ECON232 8
The best evaluation approach is the Risk Difference (RD). RD compares two measures frequency
through the calculation of their ration and compares them in their absolute difference (Cheung,
2007). The data required is the self-confidence index of the boys, number of happy thoughts
generated, and the number of times they have flown. The variables will be tested using a
multivariate ANOVA test.
Q4: Peter Pan is trying to recruit some more lost children! He doesn’t have time to go and
personally invite every little boy and every little girl but he randomly chooses a few dozen
children and visits them at night to tell them all about Neverland. To be fair to everyone, he
also opens up the Neverland gates to any boy (and girl!) who wants to join so that even kids
who didn’t get a personal visit could join. Now, Peter knows that the children who come to
Neverland are happy children but he recently heard about the issue of “selection”. So he is
starting to wonder if the children come to Neverland because they are happy or they are
happy because they came to Neverland. He comes to you and asks you for help in figuring
out whether coming to Neverland actually causes children to be happier. What evaluation
approach would you suggest and what data would you ask for/collect?
A diff in diff approach should be used. Diff in diff calculates the effect of a treated explanatory
variable on an outcome through the comparison of the average change over time (Villa, 2017).
Data that are required the level of happiness of the children coming to Neverland and after
coming to Neverland. The data will be tested using a t-test and a regression analysis.
Q5: Captain Cook is also recruiting pirates! In the sea of one thousand islands, he visits 200
islands to recruit from. In addition, he thinks that men who come from rural areas make
better pirates, so he only recruits in rural areas and doesn’t take anyone who lives in urban
areas. After he completes his recruitment, he brags that his men are the most ferocious of
them all (they have a ferocity index of 52). But he doesn’t have proof for that statement and
he likes to support his words with facts. So he comes to you to ask for help. What
evaluation approach would you suggest and what data would you ask for/collect?
The evaluation approach that should be used in Cook’s scenario is Instrumental Variable (IV).
IV is used in a regression analysis when there is an endogenous variable that is influenced by
other variables (Newey & Powell 2003). The data to collect is the two groups of pirates who
come from the rural areas and the urban areas. Then their ferocity index has to be collected for

ECON232 9
analysis. The independent data will be the areas they come from while ferocity will be the
dependent variables.
analysis. The independent data will be the areas they come from while ferocity will be the
dependent variables.
⊘ This is a preview!⊘
Do you want full access?
Subscribe today to unlock all pages.
Trusted by 1+ million students worldwide

ECON232 10
Reference:
Cheung, Y. B. (2007). A modified least-squares regression approach to the estimation of risk
difference. American journal of epidemiology, 166(11), 1337-1344.
Newey, W. K., & Powell, J. L. (2003). Instrumental variable estimation of nonparametric
models. Econometrica, 71(5), 1565-1578.
Stock, J., & Yogo, M. (2005). Asymptotic distributions of instrumental variables statistics with
many instruments (Vol. 6). Chapter.
Villa, J. (2017). DIFF: Stata module to perform Differences in Differences estimation.
1 out of 10
Your All-in-One AI-Powered Toolkit for Academic Success.
+13062052269
info@desklib.com
Available 24*7 on WhatsApp / Email
![[object Object]](/_next/static/media/star-bottom.7253800d.svg)
Unlock your academic potential
Copyright © 2020–2026 A2Z Services. All Rights Reserved. Developed and managed by ZUCOL.