University Name: ECON2330 Life Expectancy Analysis Project

Verified

Added on  2022/07/28

|7
|966
|36
Project
AI Summary
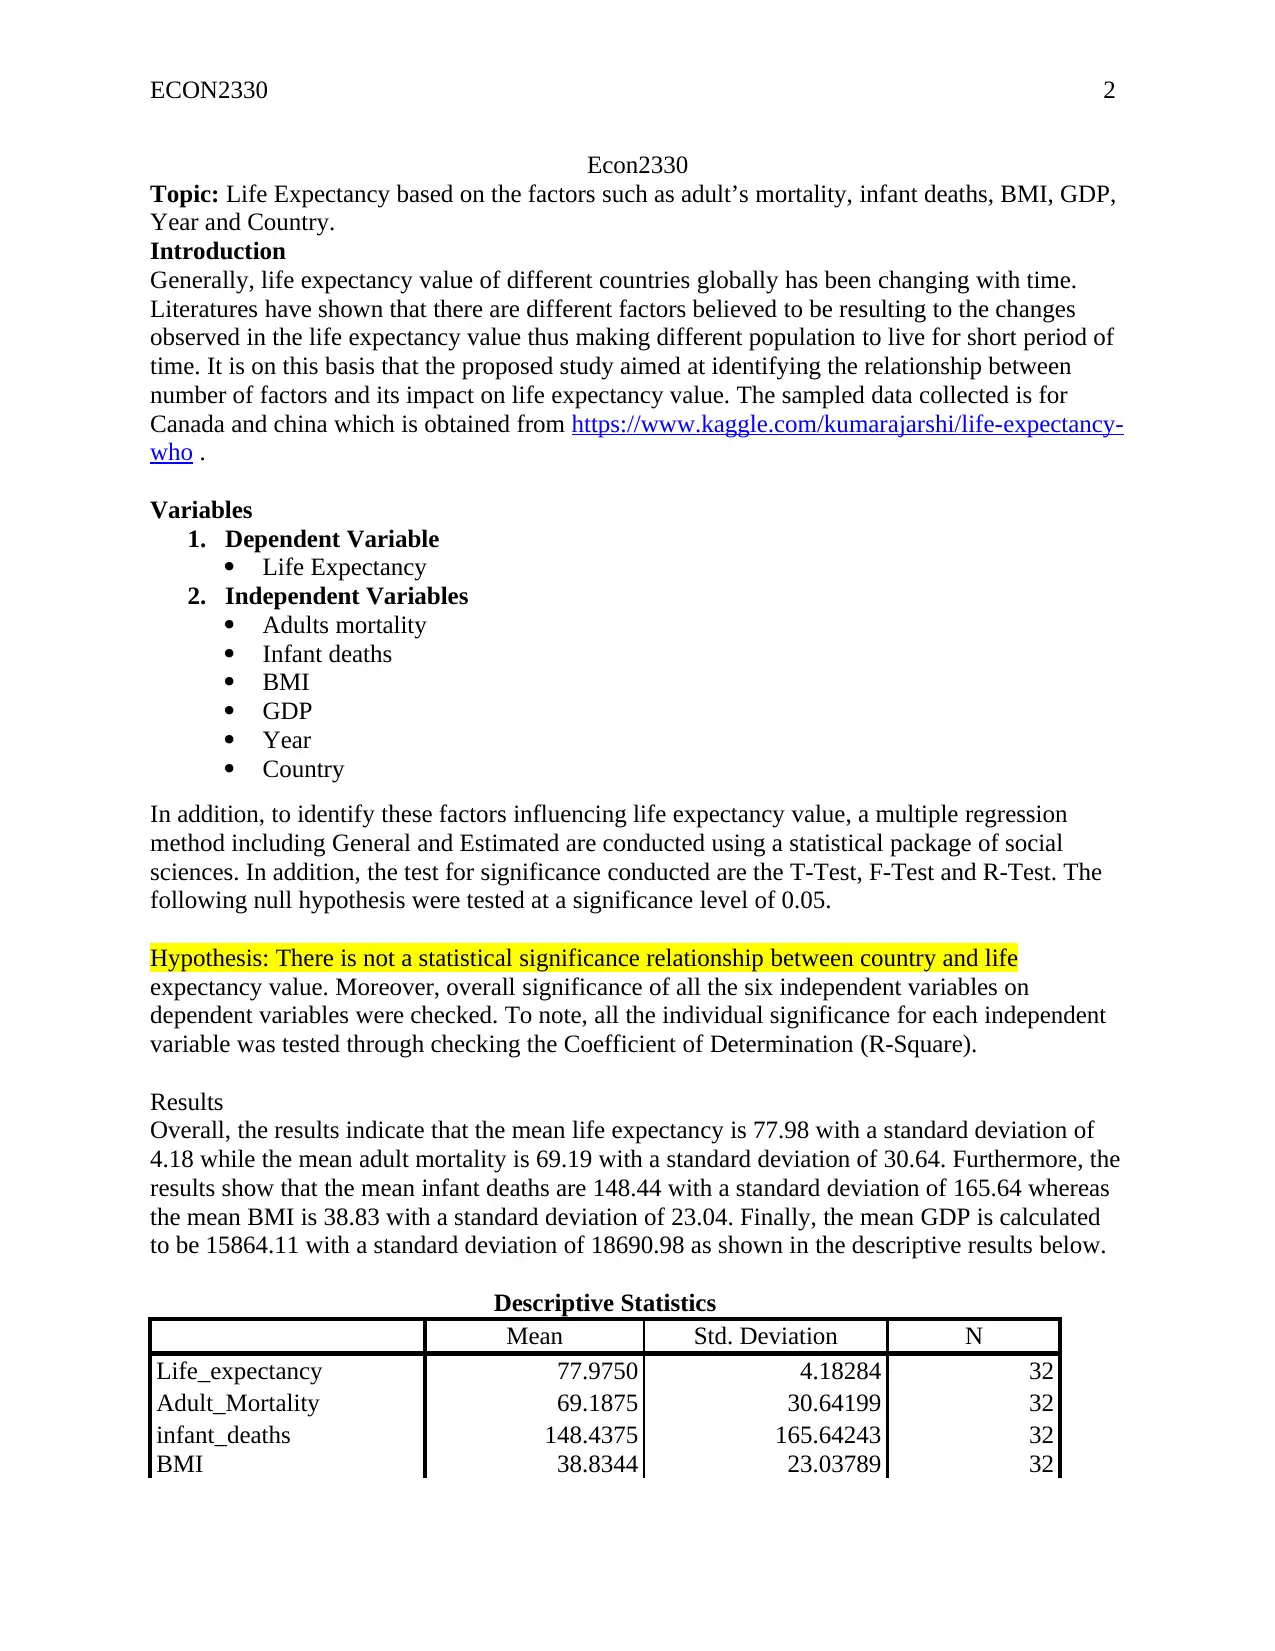
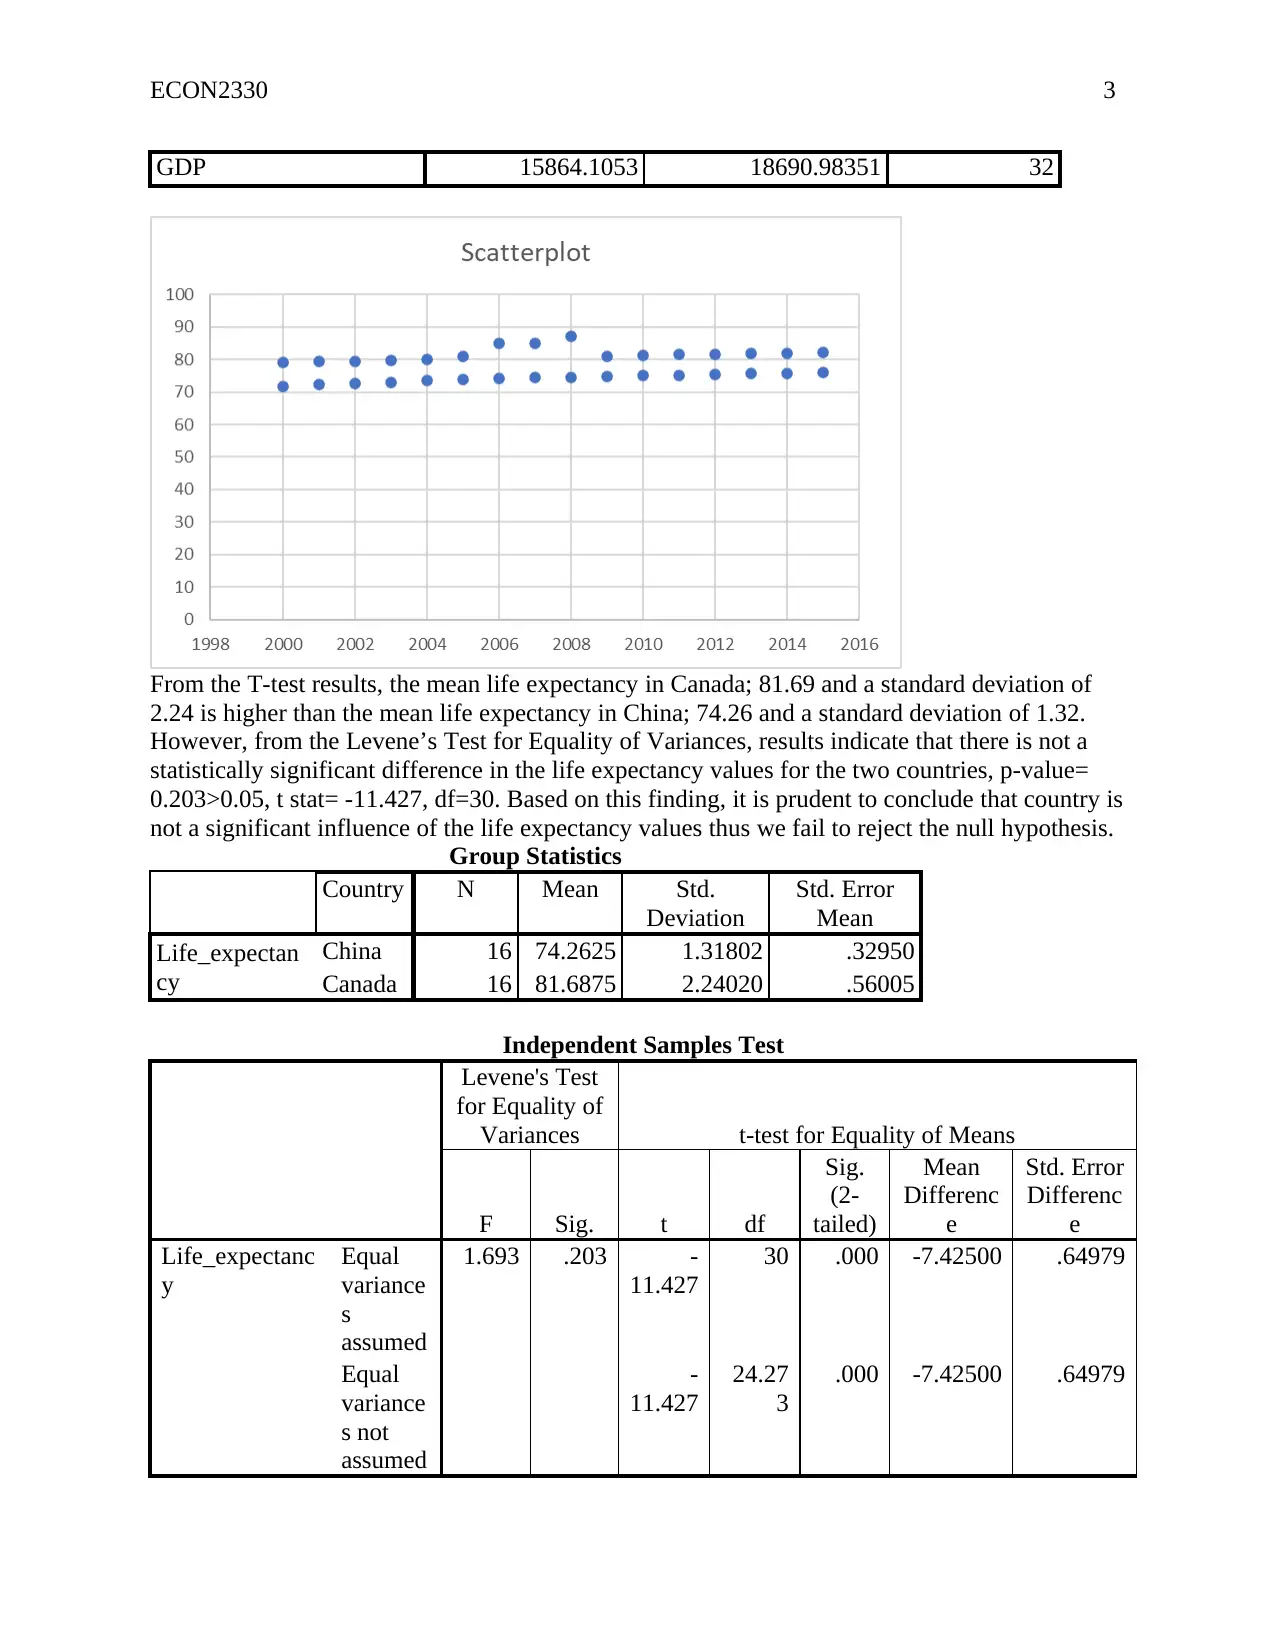
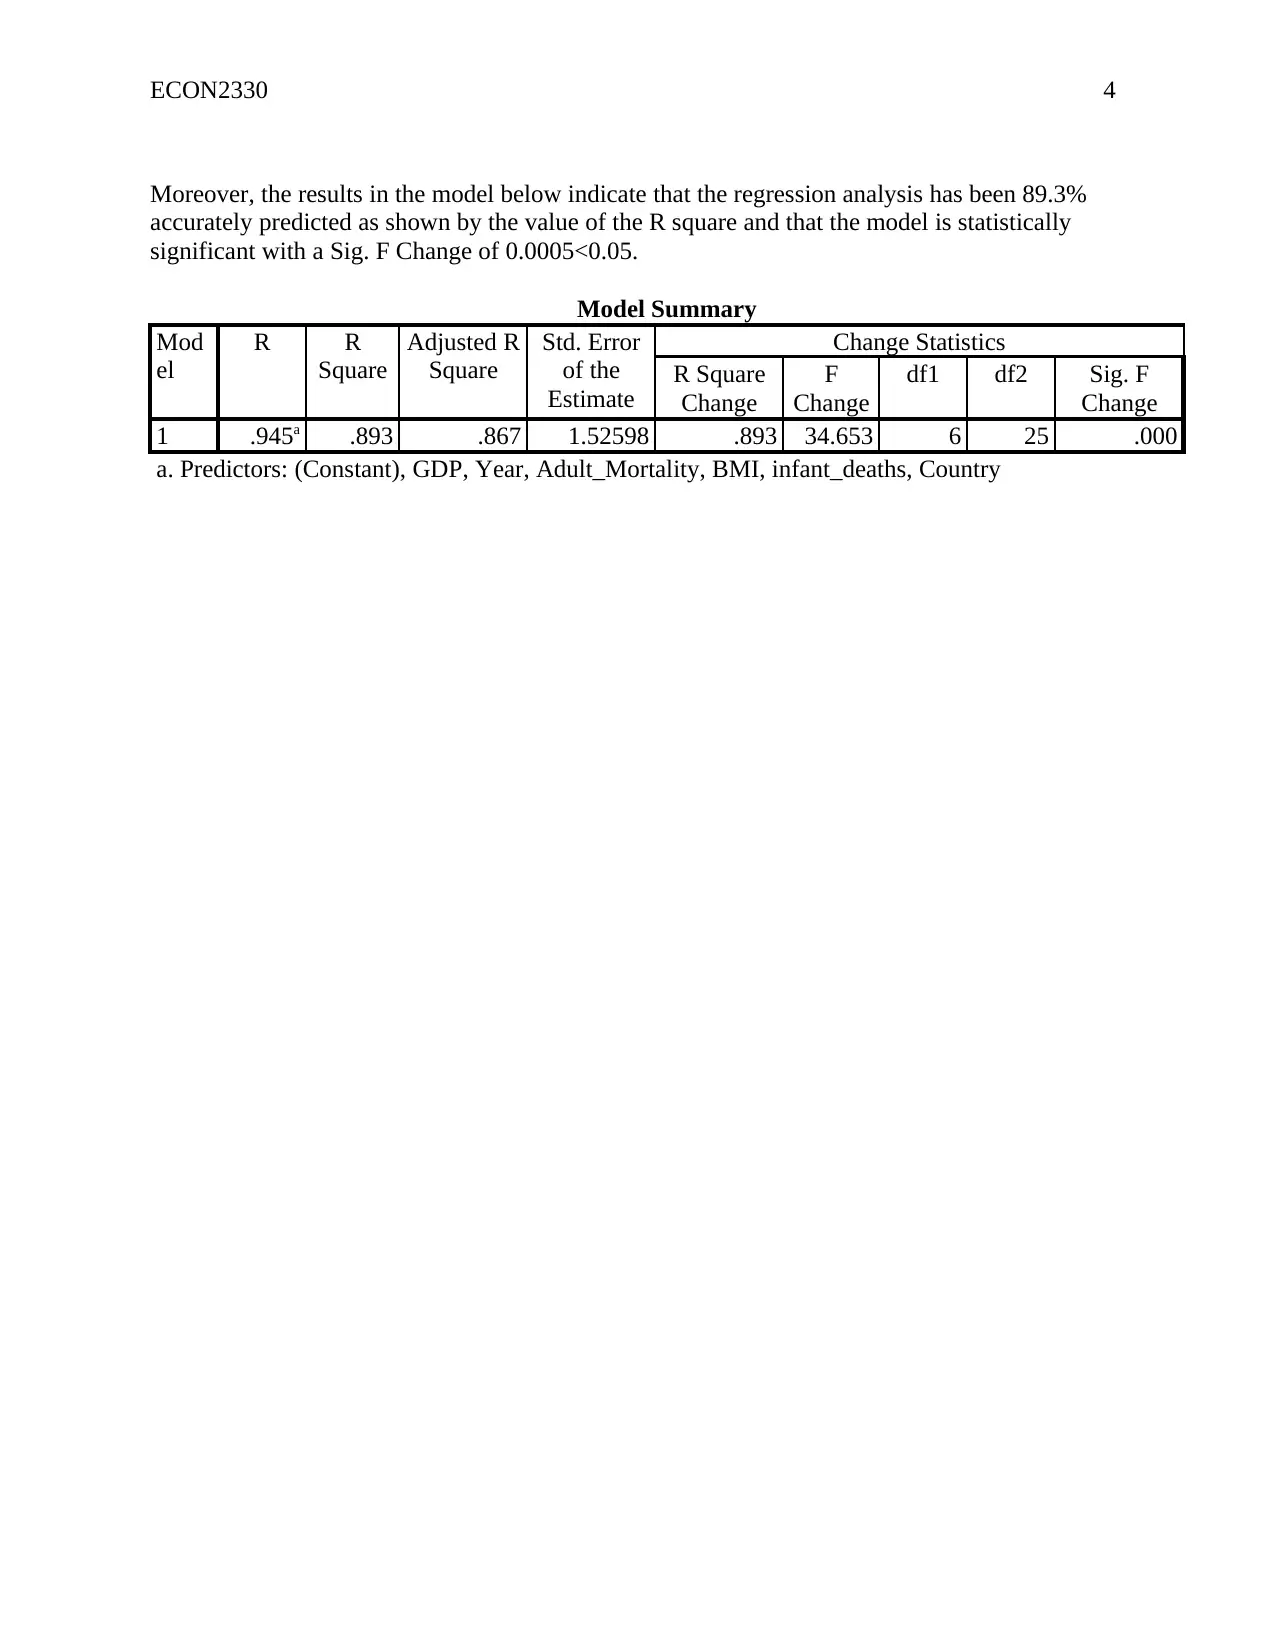
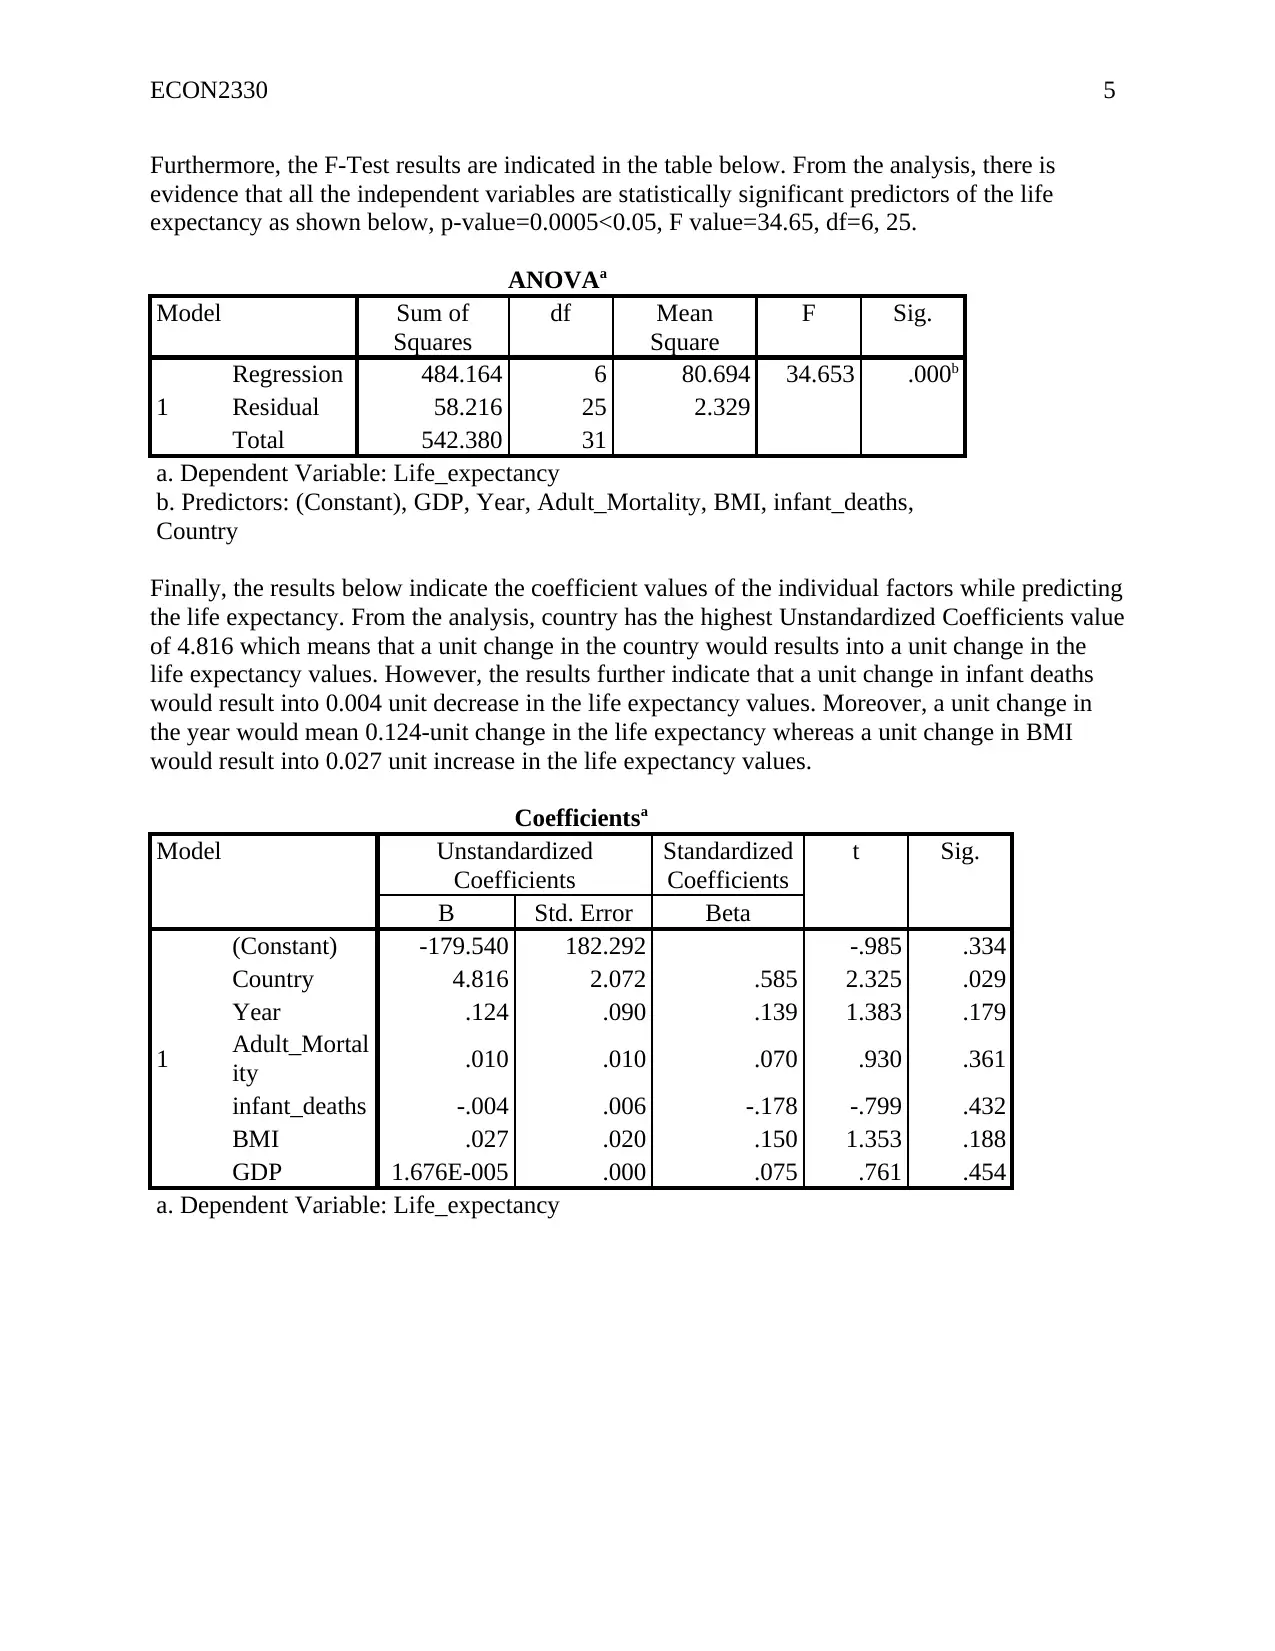
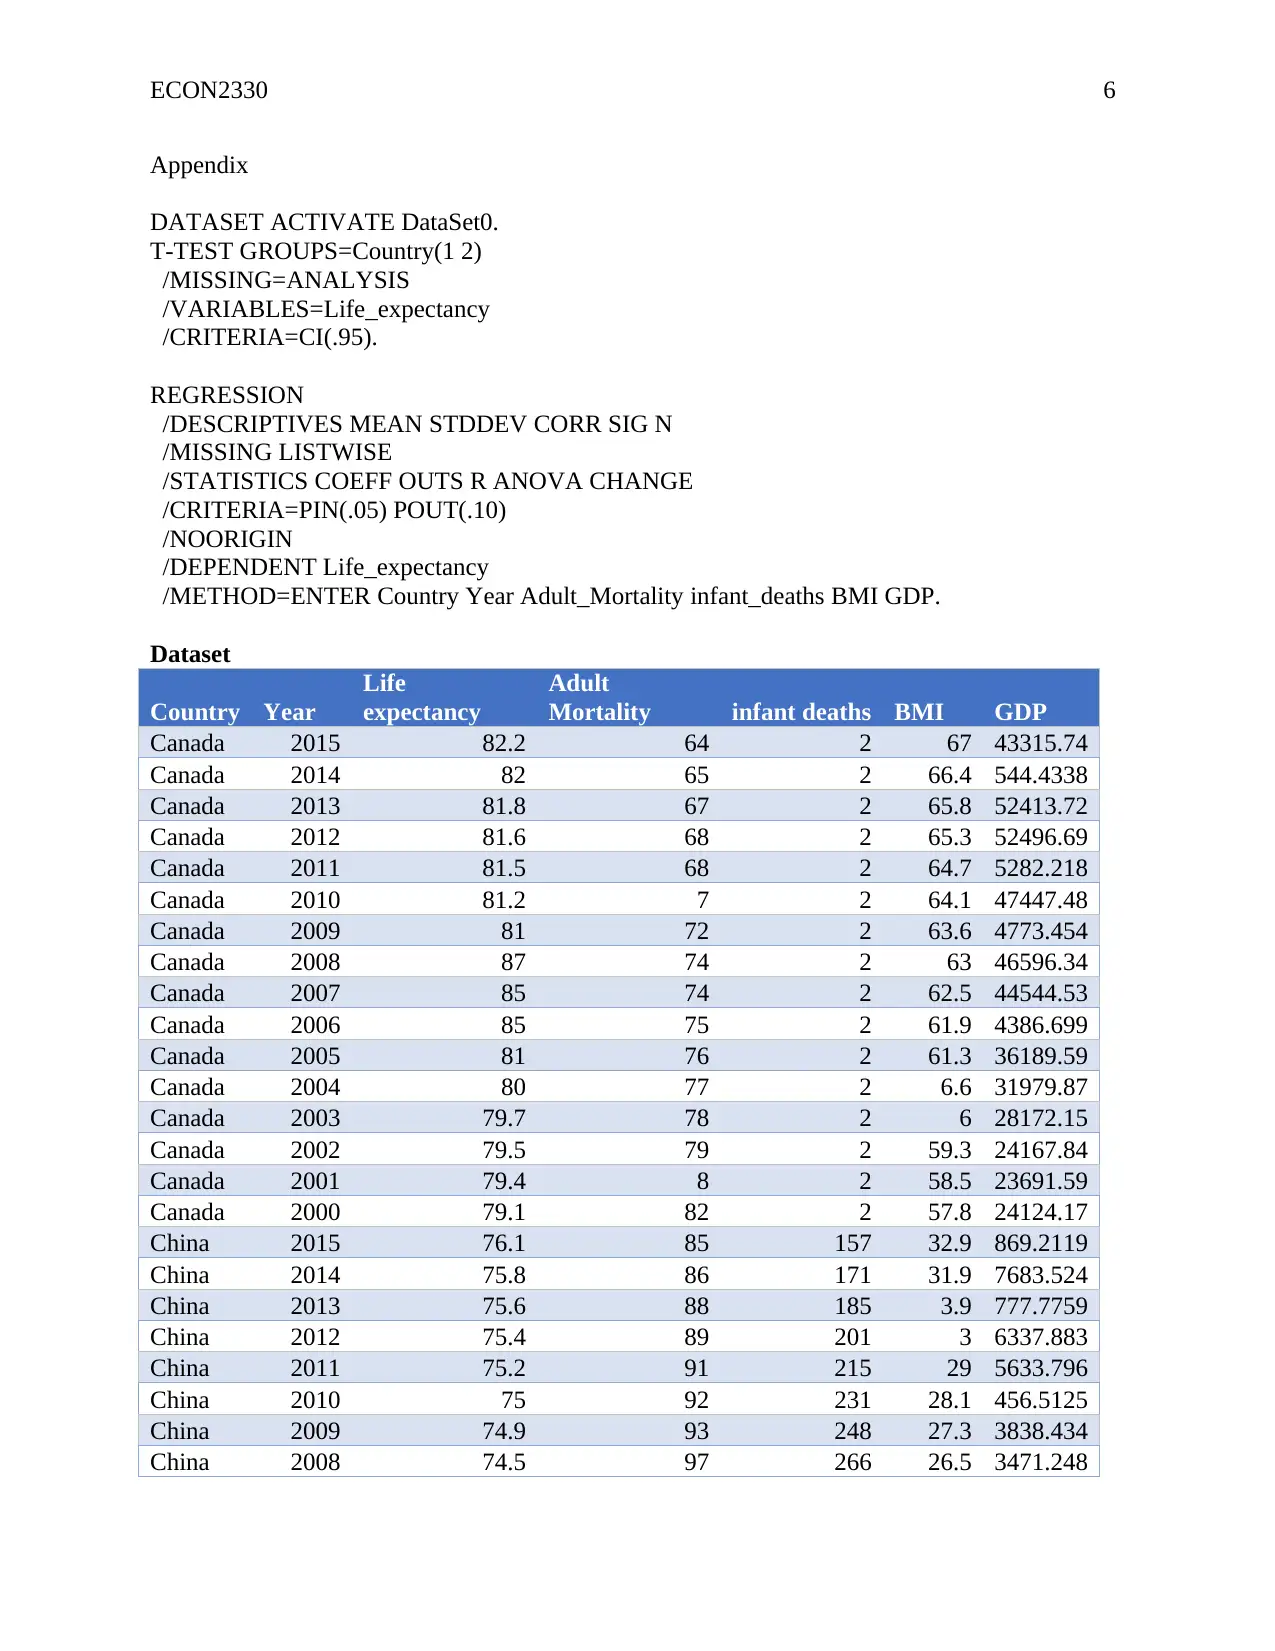
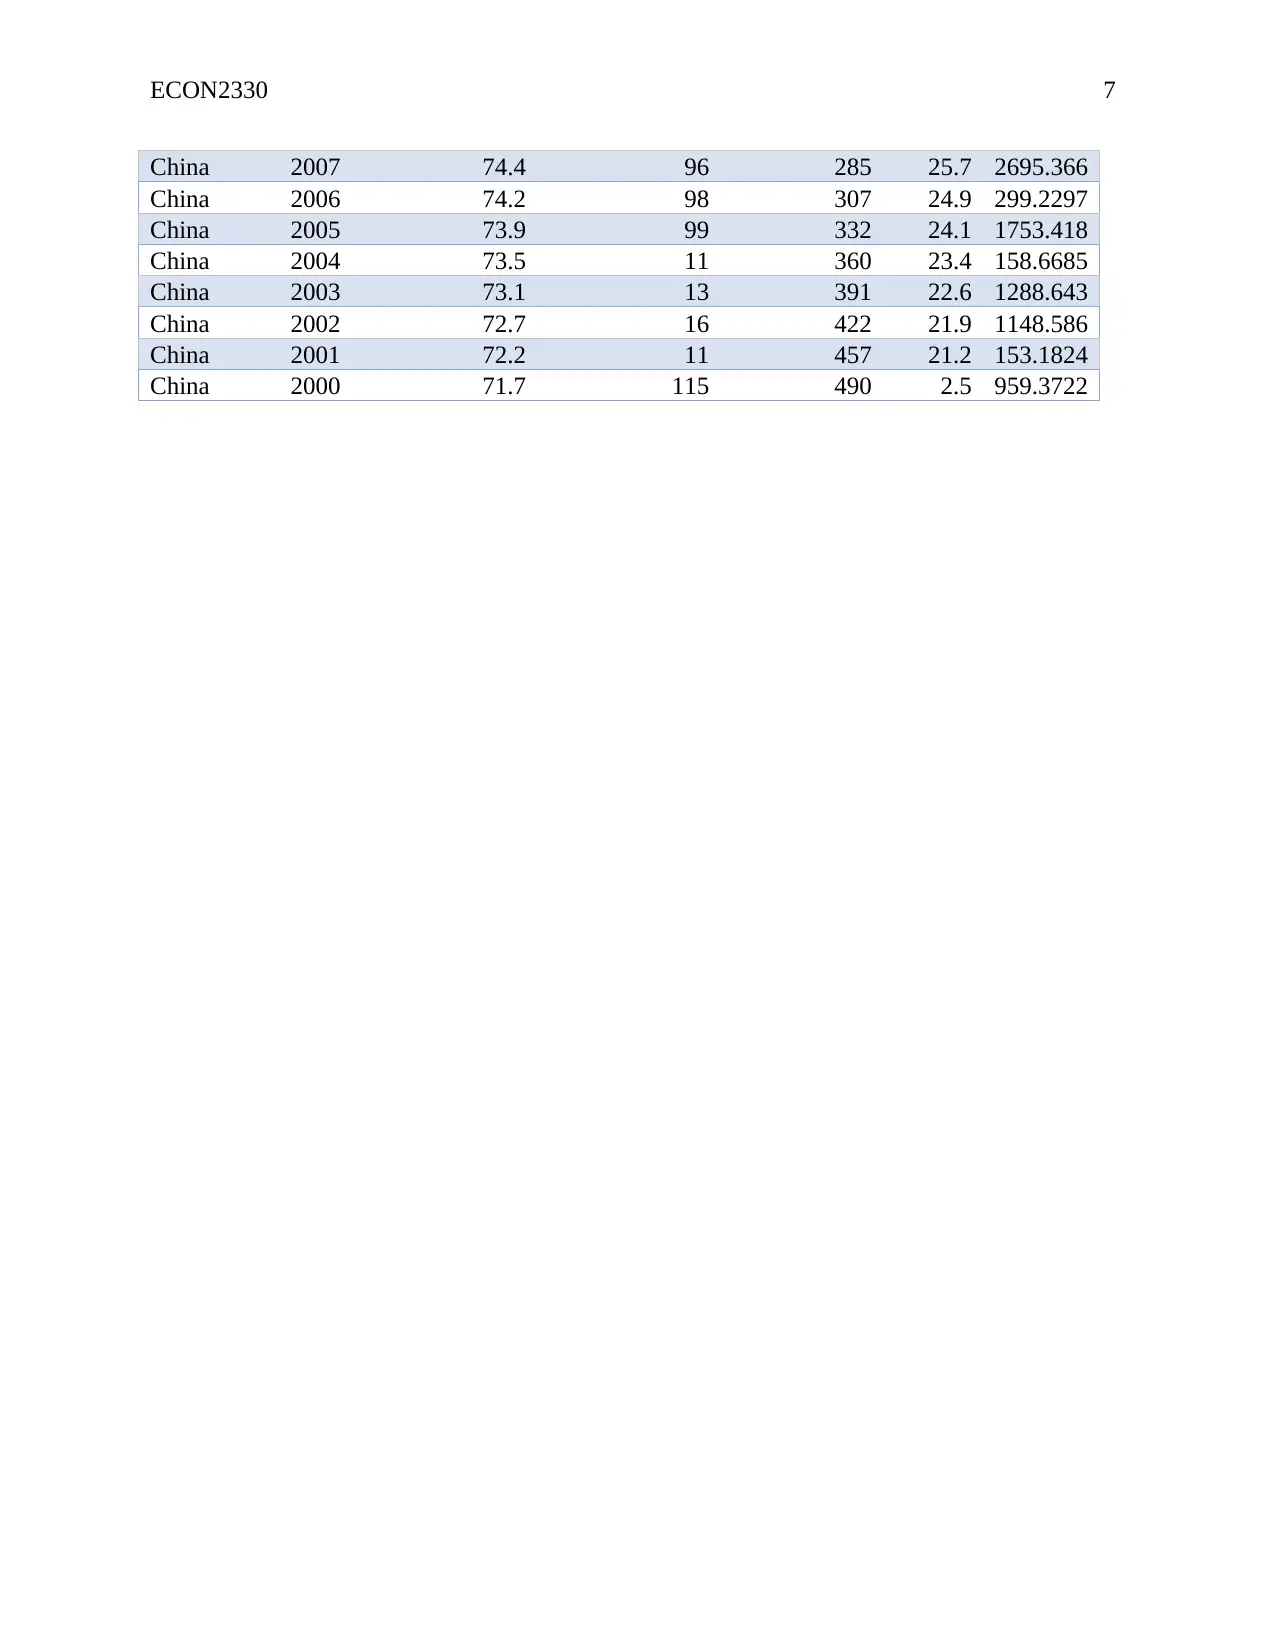
This project analyzes the factors influencing life expectancy using statistical methods. The study examines the relationship between life expectancy and variables such as adult mortality, infant deaths, BMI, GDP, year, and country. Data from Canada and China are used. The analysis includes descriptive statistics, T-tests, F-tests, and multiple regression to determine the significance of each factor. The results indicate that country is not a significant influence on life expectancy, but other factors such as adult mortality, infant deaths, year, and BMI do have a significant impact. The project uses the statistical package of social sciences (SPSS) to conduct the analysis and test various hypotheses. The findings highlight the complex interplay of various factors in determining life expectancy.
tabler-icon-diamond-filled.svg

Contribute Materials

Your contribution can guide someone’s learning journey. Share your documents today.
Document Page
Running head: ECON2330 1
ECON2330
<Name>
<University Name>
tabler-icon-diamond-filled.svg

Secure Best Marks with AI Grader

Need help grading? Try our AI Grader for instant feedback on your assignments.
Document Page
ECON2330 2
Econ2330
Topic: Life Expectancy based on the factors such as adult’s mortality, infant deaths, BMI, GDP,
Year and Country.
Introduction
Generally, life expectancy value of different countries globally has been changing with time.
Literatures have shown that there are different factors believed to be resulting to the changes
observed in the life expectancy value thus making different population to live for short period of
time. It is on this basis that the proposed study aimed at identifying the relationship between
number of factors and its impact on life expectancy value. The sampled data collected is for
Canada and china which is obtained from https://www.kaggle.com/kumarajarshi/life-expectancy-
who .
Variables
1. Dependent Variable
ï‚· Life Expectancy
2. Independent Variables
ï‚· Adults mortality
ï‚· Infant deaths
ï‚· BMI
ï‚· GDP
ï‚· Year
ï‚· Country
In addition, to identify these factors influencing life expectancy value, a multiple regression
method including General and Estimated are conducted using a statistical package of social
sciences. In addition, the test for significance conducted are the T-Test, F-Test and R-Test. The
following null hypothesis were tested at a significance level of 0.05.
Hypothesis: There is not a statistical significance relationship between country and life
expectancy value. Moreover, overall significance of all the six independent variables on
dependent variables were checked. To note, all the individual significance for each independent
variable was tested through checking the Coefficient of Determination (R-Square).
Results
Overall, the results indicate that the mean life expectancy is 77.98 with a standard deviation of
4.18 while the mean adult mortality is 69.19 with a standard deviation of 30.64. Furthermore, the
results show that the mean infant deaths are 148.44 with a standard deviation of 165.64 whereas
the mean BMI is 38.83 with a standard deviation of 23.04. Finally, the mean GDP is calculated
to be 15864.11 with a standard deviation of 18690.98 as shown in the descriptive results below.
Descriptive Statistics
Mean Std. Deviation N
Life_expectancy 77.9750 4.18284 32
Adult_Mortality 69.1875 30.64199 32
infant_deaths 148.4375 165.64243 32
BMI 38.8344 23.03789 32
Document Page
ECON2330 3
GDP 15864.1053 18690.98351 32
From the T-test results, the mean life expectancy in Canada; 81.69 and a standard deviation of
2.24 is higher than the mean life expectancy in China; 74.26 and a standard deviation of 1.32.
However, from the Levene’s Test for Equality of Variances, results indicate that there is not a
statistically significant difference in the life expectancy values for the two countries, p-value=
0.203>0.05, t stat= -11.427, df=30. Based on this finding, it is prudent to conclude that country is
not a significant influence of the life expectancy values thus we fail to reject the null hypothesis.
Group Statistics
Country N Mean Std.
Deviation
Std. Error
Mean
Life_expectan
cy
China 16 74.2625 1.31802 .32950
Canada 16 81.6875 2.24020 .56005
Independent Samples Test
Levene's Test
for Equality of
Variances t-test for Equality of Means
F Sig. t df
Sig.
(2-
tailed)
Mean
Differenc
e
Std. Error
Differenc
e
Life_expectanc
y
Equal
variance
s
assumed
1.693 .203 -
11.427
30 .000 -7.42500 .64979
Equal
variance
s not
assumed
-
11.427
24.27
3
.000 -7.42500 .64979
Document Page
ECON2330 4
Moreover, the results in the model below indicate that the regression analysis has been 89.3%
accurately predicted as shown by the value of the R square and that the model is statistically
significant with a Sig. F Change of 0.0005<0.05.
Model Summary
Mod
el
R R
Square
Adjusted R
Square
Std. Error
of the
Estimate
Change Statistics
R Square
Change
F
Change
df1 df2 Sig. F
Change
1 .945a .893 .867 1.52598 .893 34.653 6 25 .000
a. Predictors: (Constant), GDP, Year, Adult_Mortality, BMI, infant_deaths, Country
tabler-icon-diamond-filled.svg

Secure Best Marks with AI Grader

Need help grading? Try our AI Grader for instant feedback on your assignments.
Document Page
ECON2330 5
Furthermore, the F-Test results are indicated in the table below. From the analysis, there is
evidence that all the independent variables are statistically significant predictors of the life
expectancy as shown below, p-value=0.0005<0.05, F value=34.65, df=6, 25.
ANOVAa
Model Sum of
Squares
df Mean
Square
F Sig.
1
Regression 484.164 6 80.694 34.653 .000b
Residual 58.216 25 2.329
Total 542.380 31
a. Dependent Variable: Life_expectancy
b. Predictors: (Constant), GDP, Year, Adult_Mortality, BMI, infant_deaths,
Country
Finally, the results below indicate the coefficient values of the individual factors while predicting
the life expectancy. From the analysis, country has the highest Unstandardized Coefficients value
of 4.816 which means that a unit change in the country would results into a unit change in the
life expectancy values. However, the results further indicate that a unit change in infant deaths
would result into 0.004 unit decrease in the life expectancy values. Moreover, a unit change in
the year would mean 0.124-unit change in the life expectancy whereas a unit change in BMI
would result into 0.027 unit increase in the life expectancy values.
Coefficientsa
Model Unstandardized
Coefficients
Standardized
Coefficients
t Sig.
B Std. Error Beta
1
(Constant) -179.540 182.292 -.985 .334
Country 4.816 2.072 .585 2.325 .029
Year .124 .090 .139 1.383 .179
Adult_Mortal
ity .010 .010 .070 .930 .361
infant_deaths -.004 .006 -.178 -.799 .432
BMI .027 .020 .150 1.353 .188
GDP 1.676E-005 .000 .075 .761 .454
a. Dependent Variable: Life_expectancy
Document Page
ECON2330 6
Appendix
DATASET ACTIVATE DataSet0.
T-TEST GROUPS=Country(1 2)
/MISSING=ANALYSIS
/VARIABLES=Life_expectancy
/CRITERIA=CI(.95).
REGRESSION
/DESCRIPTIVES MEAN STDDEV CORR SIG N
/MISSING LISTWISE
/STATISTICS COEFF OUTS R ANOVA CHANGE
/CRITERIA=PIN(.05) POUT(.10)
/NOORIGIN
/DEPENDENT Life_expectancy
/METHOD=ENTER Country Year Adult_Mortality infant_deaths BMI GDP.
Dataset
Country Year
Life
expectancy
Adult
Mortality infant deaths BMI GDP
Canada 2015 82.2 64 2 67 43315.74
Canada 2014 82 65 2 66.4 544.4338
Canada 2013 81.8 67 2 65.8 52413.72
Canada 2012 81.6 68 2 65.3 52496.69
Canada 2011 81.5 68 2 64.7 5282.218
Canada 2010 81.2 7 2 64.1 47447.48
Canada 2009 81 72 2 63.6 4773.454
Canada 2008 87 74 2 63 46596.34
Canada 2007 85 74 2 62.5 44544.53
Canada 2006 85 75 2 61.9 4386.699
Canada 2005 81 76 2 61.3 36189.59
Canada 2004 80 77 2 6.6 31979.87
Canada 2003 79.7 78 2 6 28172.15
Canada 2002 79.5 79 2 59.3 24167.84
Canada 2001 79.4 8 2 58.5 23691.59
Canada 2000 79.1 82 2 57.8 24124.17
China 2015 76.1 85 157 32.9 869.2119
China 2014 75.8 86 171 31.9 7683.524
China 2013 75.6 88 185 3.9 777.7759
China 2012 75.4 89 201 3 6337.883
China 2011 75.2 91 215 29 5633.796
China 2010 75 92 231 28.1 456.5125
China 2009 74.9 93 248 27.3 3838.434
China 2008 74.5 97 266 26.5 3471.248
Document Page
ECON2330 7
China 2007 74.4 96 285 25.7 2695.366
China 2006 74.2 98 307 24.9 299.2297
China 2005 73.9 99 332 24.1 1753.418
China 2004 73.5 11 360 23.4 158.6685
China 2003 73.1 13 391 22.6 1288.643
China 2002 72.7 16 422 21.9 1148.586
China 2001 72.2 11 457 21.2 153.1824
China 2000 71.7 115 490 2.5 959.3722
chevron_up_icon
1 out of 7
circle_padding
hide_on_mobile
zoom_out_icon
logo.png

Your All-in-One AI-Powered Toolkit for Academic Success.

Available 24*7 on WhatsApp / Email

[object Object]