ECON6000 Economic Principles: Demand, Tariffs, and Regression Analysis

Verified

Added on  2023/06/08

|7
|697
|396
Homework Assignment
AI Summary
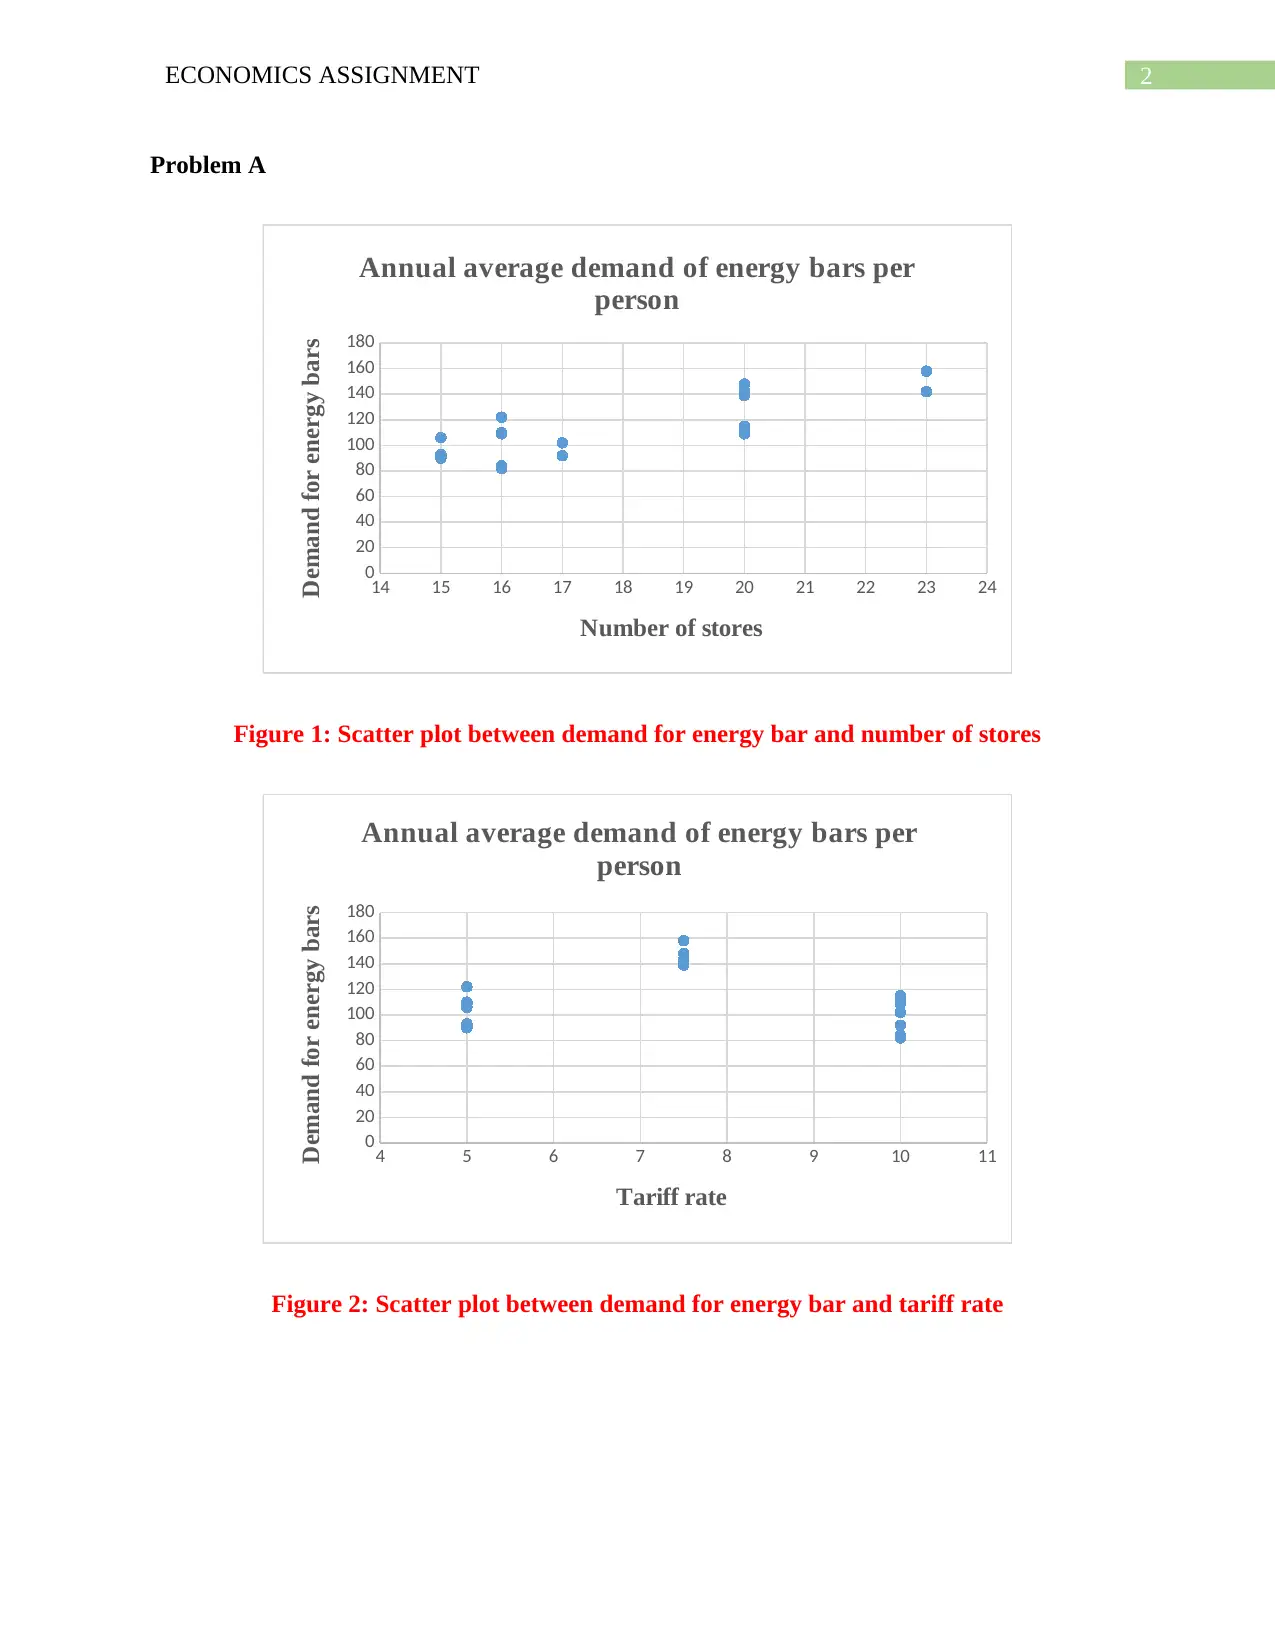
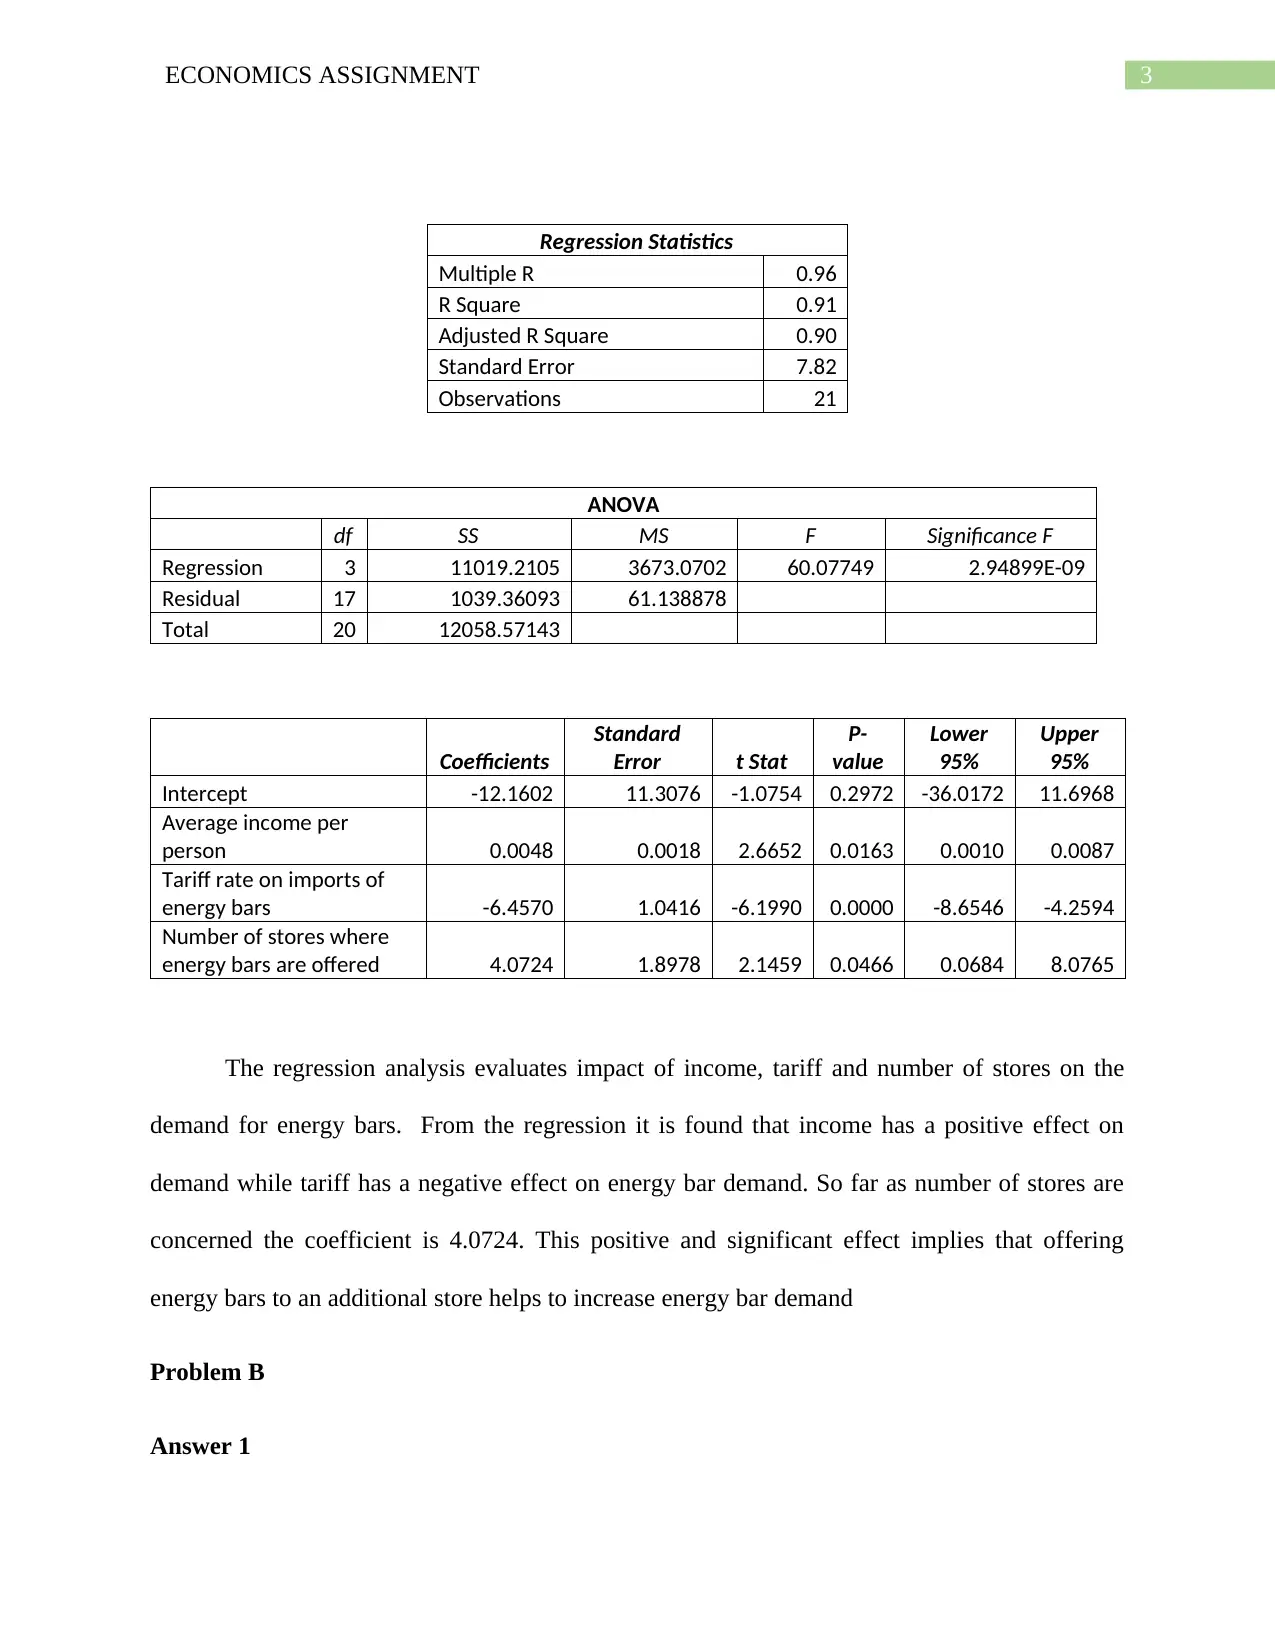
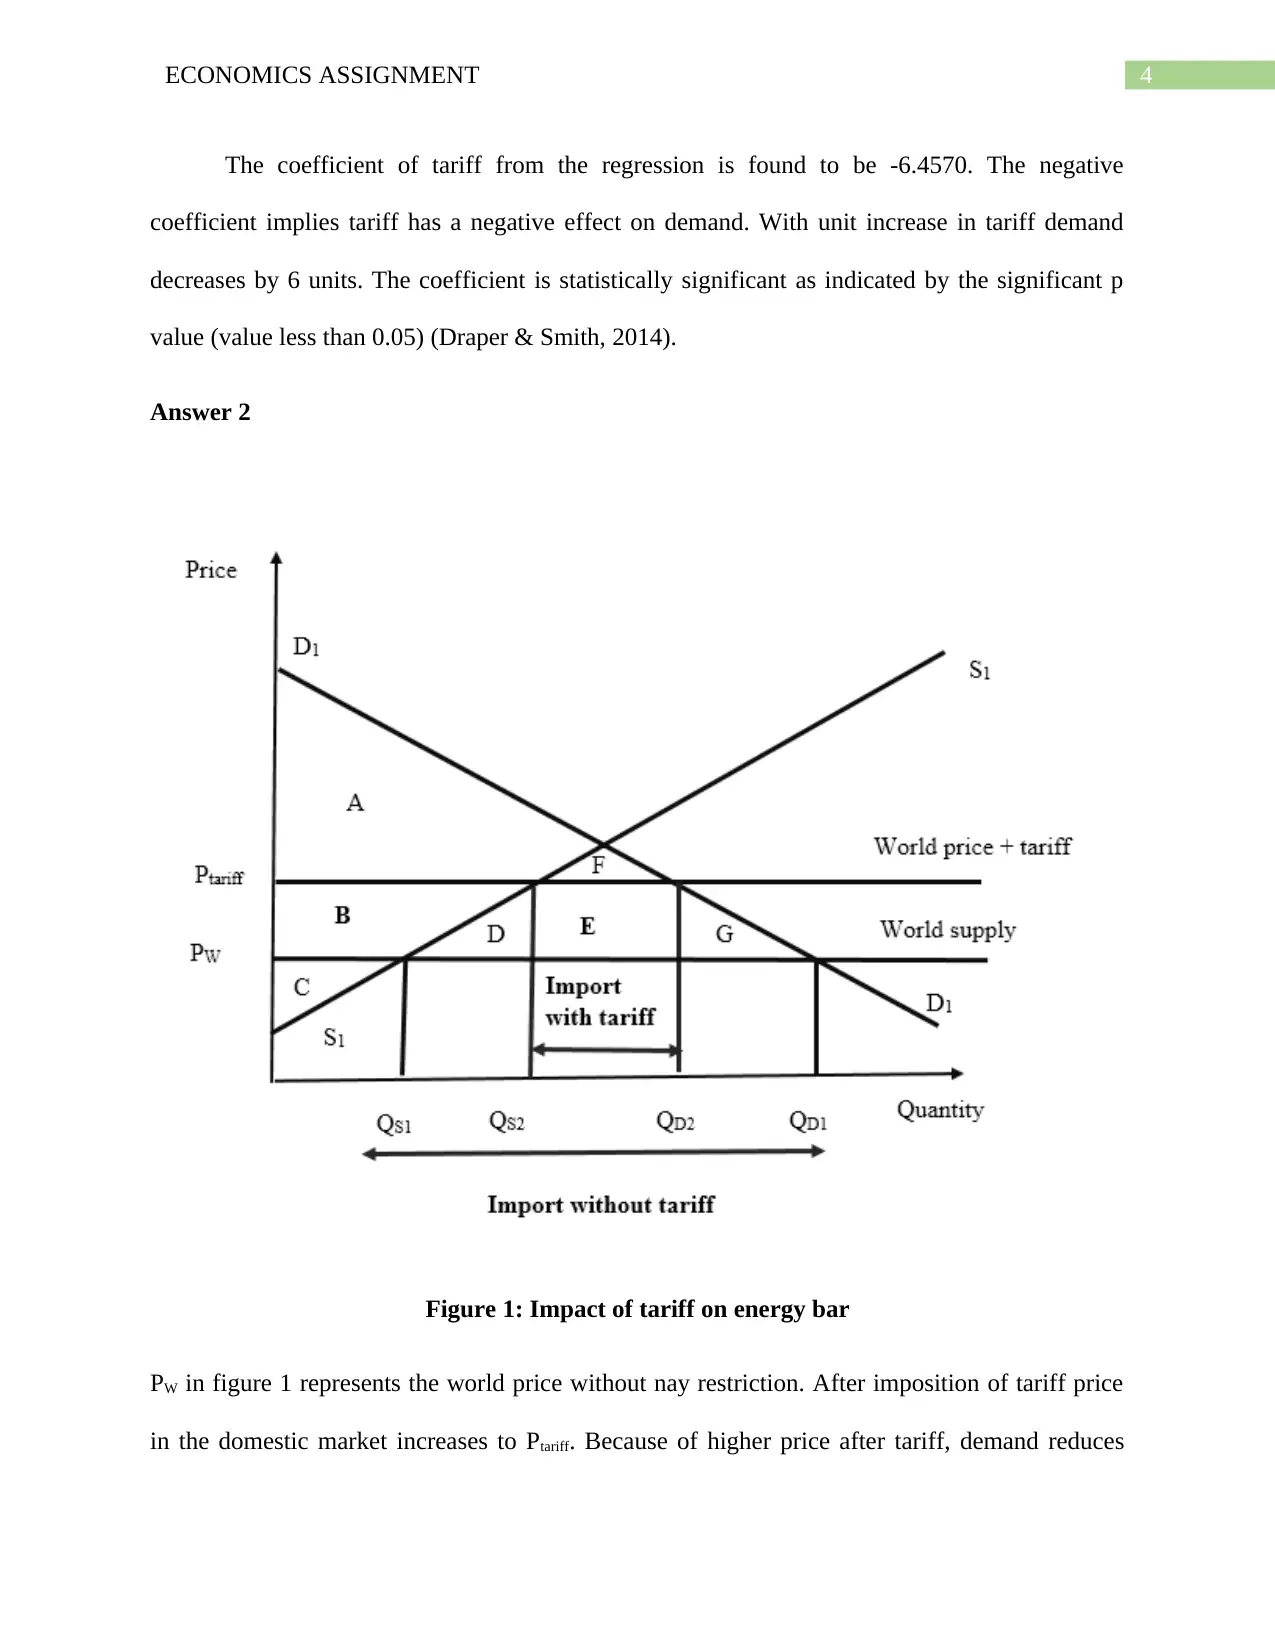
This economics assignment delves into the relationship between energy bar demand, tariffs, and the number of stores offering the product. It includes a regression analysis that evaluates the impact of income, tariff rates, and store availability on demand, revealing that income positively affects demand, while tariffs have a negative impact. The assignment further discusses the welfare loss caused by tariff imposition, leading to potential substitution with cheaper brands and a loss in market share. It concludes that free trade between nations is mutually beneficial, supported by the regression analysis indicating a significant negative effect of tariffs on energy bar demand and overall welfare. Desklib offers a wealth of similar solved assignments and past papers to aid students in their studies.
Document Page
Running Head: ECONOMICS ASSIGNMENT
Economics Assignment
Name of the Student
Name of the University
Course ID
tabler-icon-diamond-filled.svg

Secure Best Marks with AI Grader

Need help grading? Try our AI Grader for instant feedback on your assignments.
Document Page
1ECONOMICS ASSIGNMENT
Table of Contents
Problem A........................................................................................................................................2
Problem B........................................................................................................................................3
Answer 1......................................................................................................................................3
Answer 2......................................................................................................................................4
Problem C........................................................................................................................................5
Reference list...................................................................................................................................6
Document Page
2ECONOMICS ASSIGNMENT
Problem A
14 15 16 17 18 19 20 21 22 23 24
0
20
40
60
80
100
120
140
160
180
Annual average demand of energy bars per
person
Number of stores
Demand for energy bars
Figure 1: Scatter plot between demand for energy bar and number of stores
4 5 6 7 8 9 10 11
0
20
40
60
80
100
120
140
160
180
Annual average demand of energy bars per
person
Tariff rate
Demand for energy bars
Figure 2: Scatter plot between demand for energy bar and tariff rate
Document Page
3ECONOMICS ASSIGNMENT
Regression Statistics
Multiple R 0.96
R Square 0.91
Adjusted R Square 0.90
Standard Error 7.82
Observations 21
ANOVA
df SS MS F Significance F
Regression 3 11019.2105 3673.0702 60.07749 2.94899E-09
Residual 17 1039.36093 61.138878
Total 20 12058.57143
Coefficients
Standard
Error t Stat
P-
value
Lower
95%
Upper
95%
Intercept -12.1602 11.3076 -1.0754 0.2972 -36.0172 11.6968
Average income per
person 0.0048 0.0018 2.6652 0.0163 0.0010 0.0087
Tariff rate on imports of
energy bars -6.4570 1.0416 -6.1990 0.0000 -8.6546 -4.2594
Number of stores where
energy bars are offered 4.0724 1.8978 2.1459 0.0466 0.0684 8.0765
The regression analysis evaluates impact of income, tariff and number of stores on the
demand for energy bars. From the regression it is found that income has a positive effect on
demand while tariff has a negative effect on energy bar demand. So far as number of stores are
concerned the coefficient is 4.0724. This positive and significant effect implies that offering
energy bars to an additional store helps to increase energy bar demand
Problem B
Answer 1
tabler-icon-diamond-filled.svg

Secure Best Marks with AI Grader

Need help grading? Try our AI Grader for instant feedback on your assignments.
Document Page
4ECONOMICS ASSIGNMENT
The coefficient of tariff from the regression is found to be -6.4570. The negative
coefficient implies tariff has a negative effect on demand. With unit increase in tariff demand
decreases by 6 units. The coefficient is statistically significant as indicated by the significant p
value (value less than 0.05) (Draper & Smith, 2014).
Answer 2
Figure 1: Impact of tariff on energy bar
PW in figure 1 represents the world price without nay restriction. After imposition of tariff price
in the domestic market increases to Ptariff. Because of higher price after tariff, demand reduces
Document Page
5ECONOMICS ASSIGNMENT
from QD1 to QD2. The higher price reduces consumer surplus to A. Producer surplus increases to B
+ C. The lost consumer surplus however does not completely transfers to producers (Feenstra,
2015). This causes a misallocation of resources leading to a welfare loss represented by the area
D + G.
Problem C
As discussed in the previous section imposition of tariff in Industria causes a welfare loss
in the market. In response to higher price of Scmeckt Gut’s energy bar people in Industria would
substitute Schmeckt Gut’s energy bar with some cheaper brand that might affect consumer’s
health. Because of tariff Schmeckt Gut would face a loss in the market share in Industria.
Followed by standard theory of trade, it is thus mutually beneficial for both the nation to
encourage free trade between the two nations (Viner, 2016). The theoretical overview of trade is
further supported by the regression analysis. The regression analysis suggests indicates a
significant negative effect of tariff on energy bar demand and welfare.
Document Page
6ECONOMICS ASSIGNMENT
Reference list
Draper, N. R., & Smith, H. (2014). Applied regression analysis(Vol. 326). John Wiley & Sons.
Feenstra, R. C. (2015). Advanced international trade: theory and evidence. Princeton university
press.
Viner, J. (2016). Studies in the theory of international trade. Routledge.
chevron_up_icon
1 out of 7
circle_padding
hide_on_mobile
zoom_out_icon
[object Object]