ECON6000 Economic Principles and Decision Making - Assessment 2
VerifiedAdded on 2023/06/04
|7
|902
|108
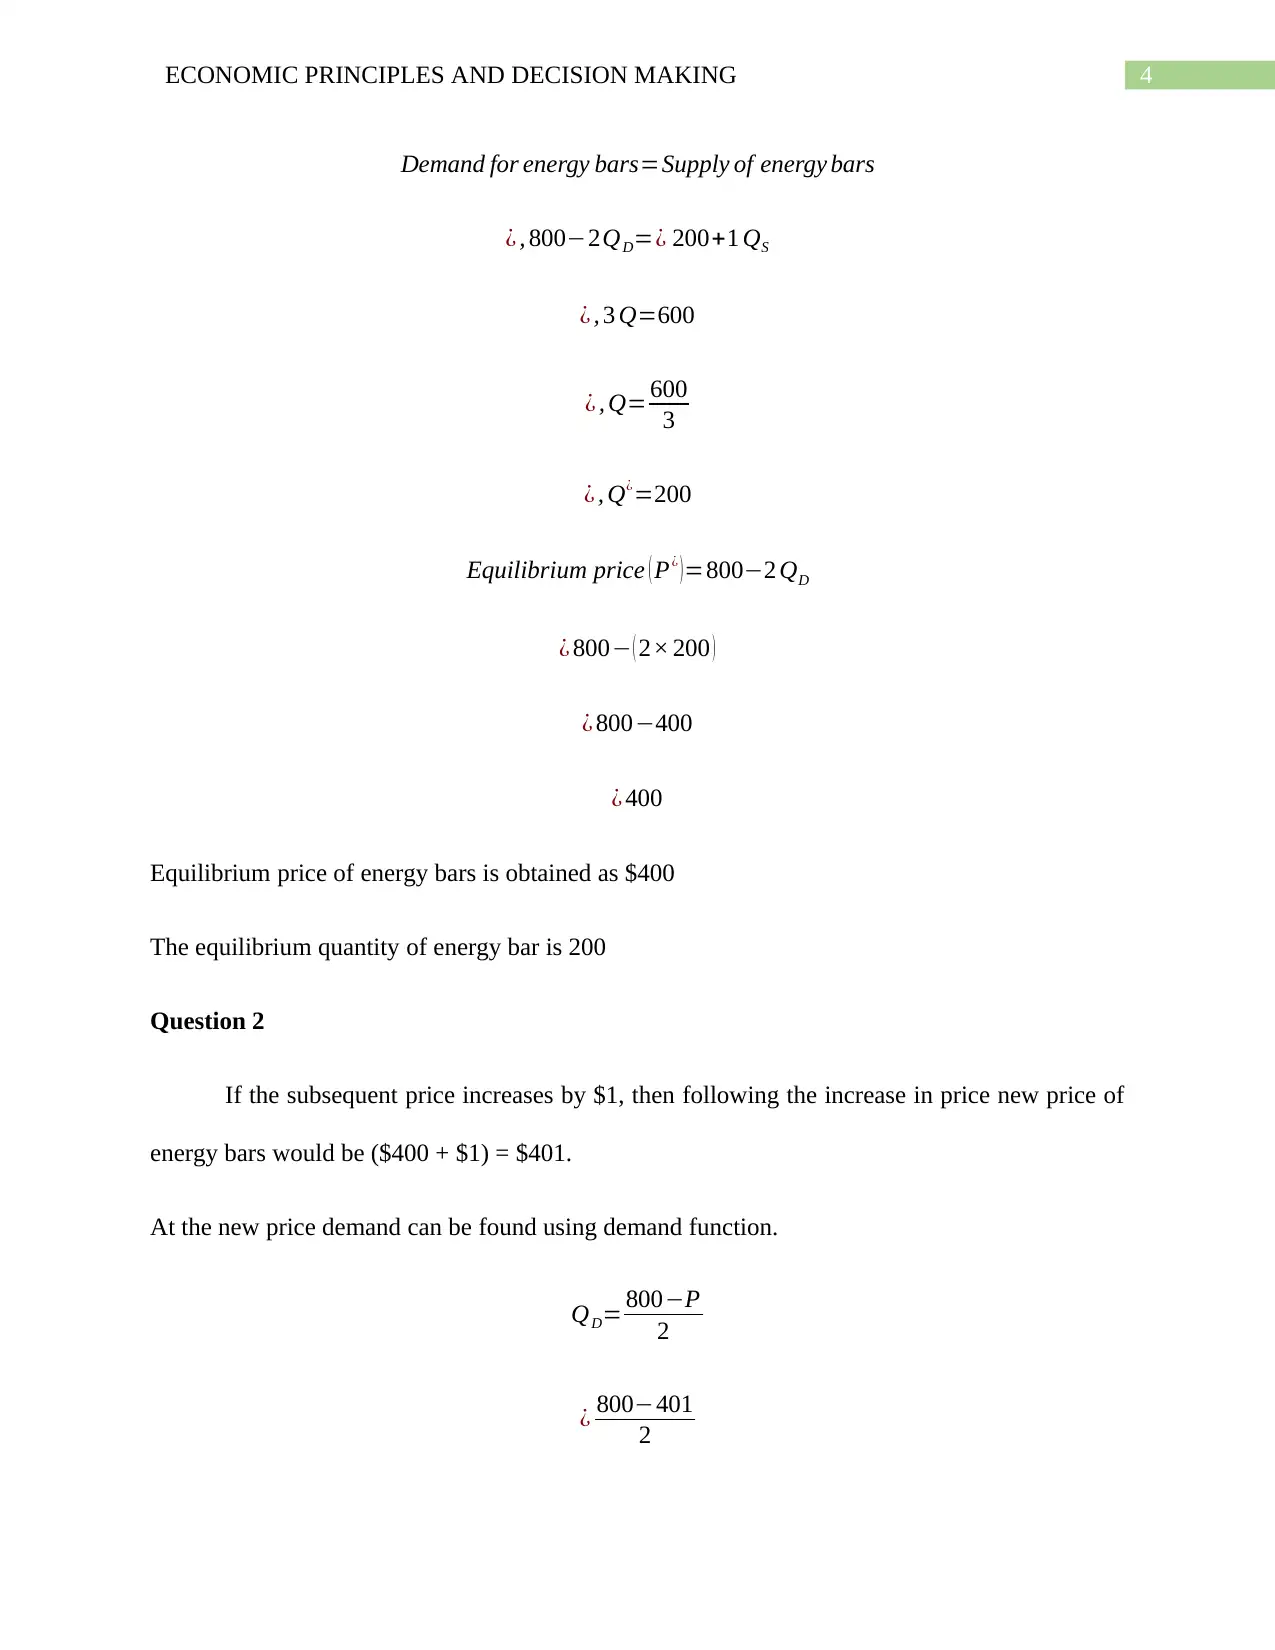
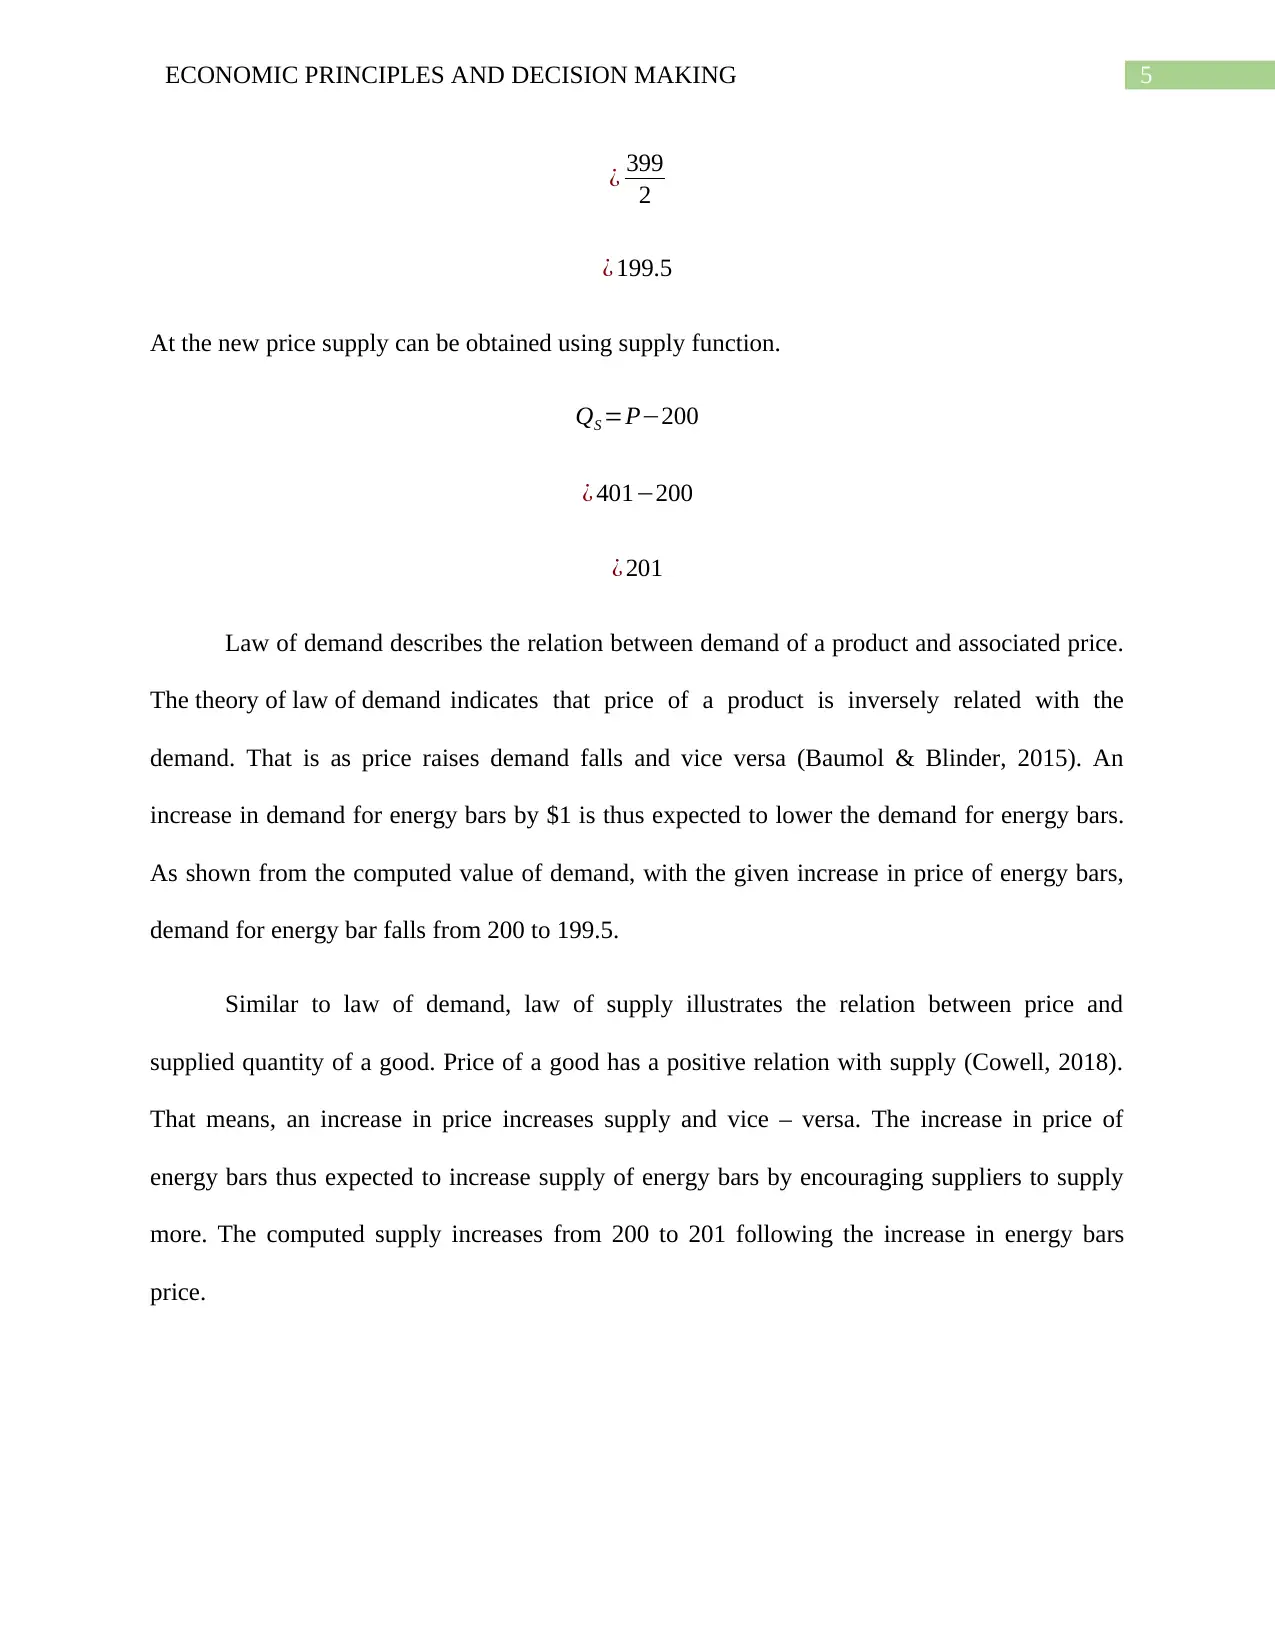
Homework Assignment
AI Summary
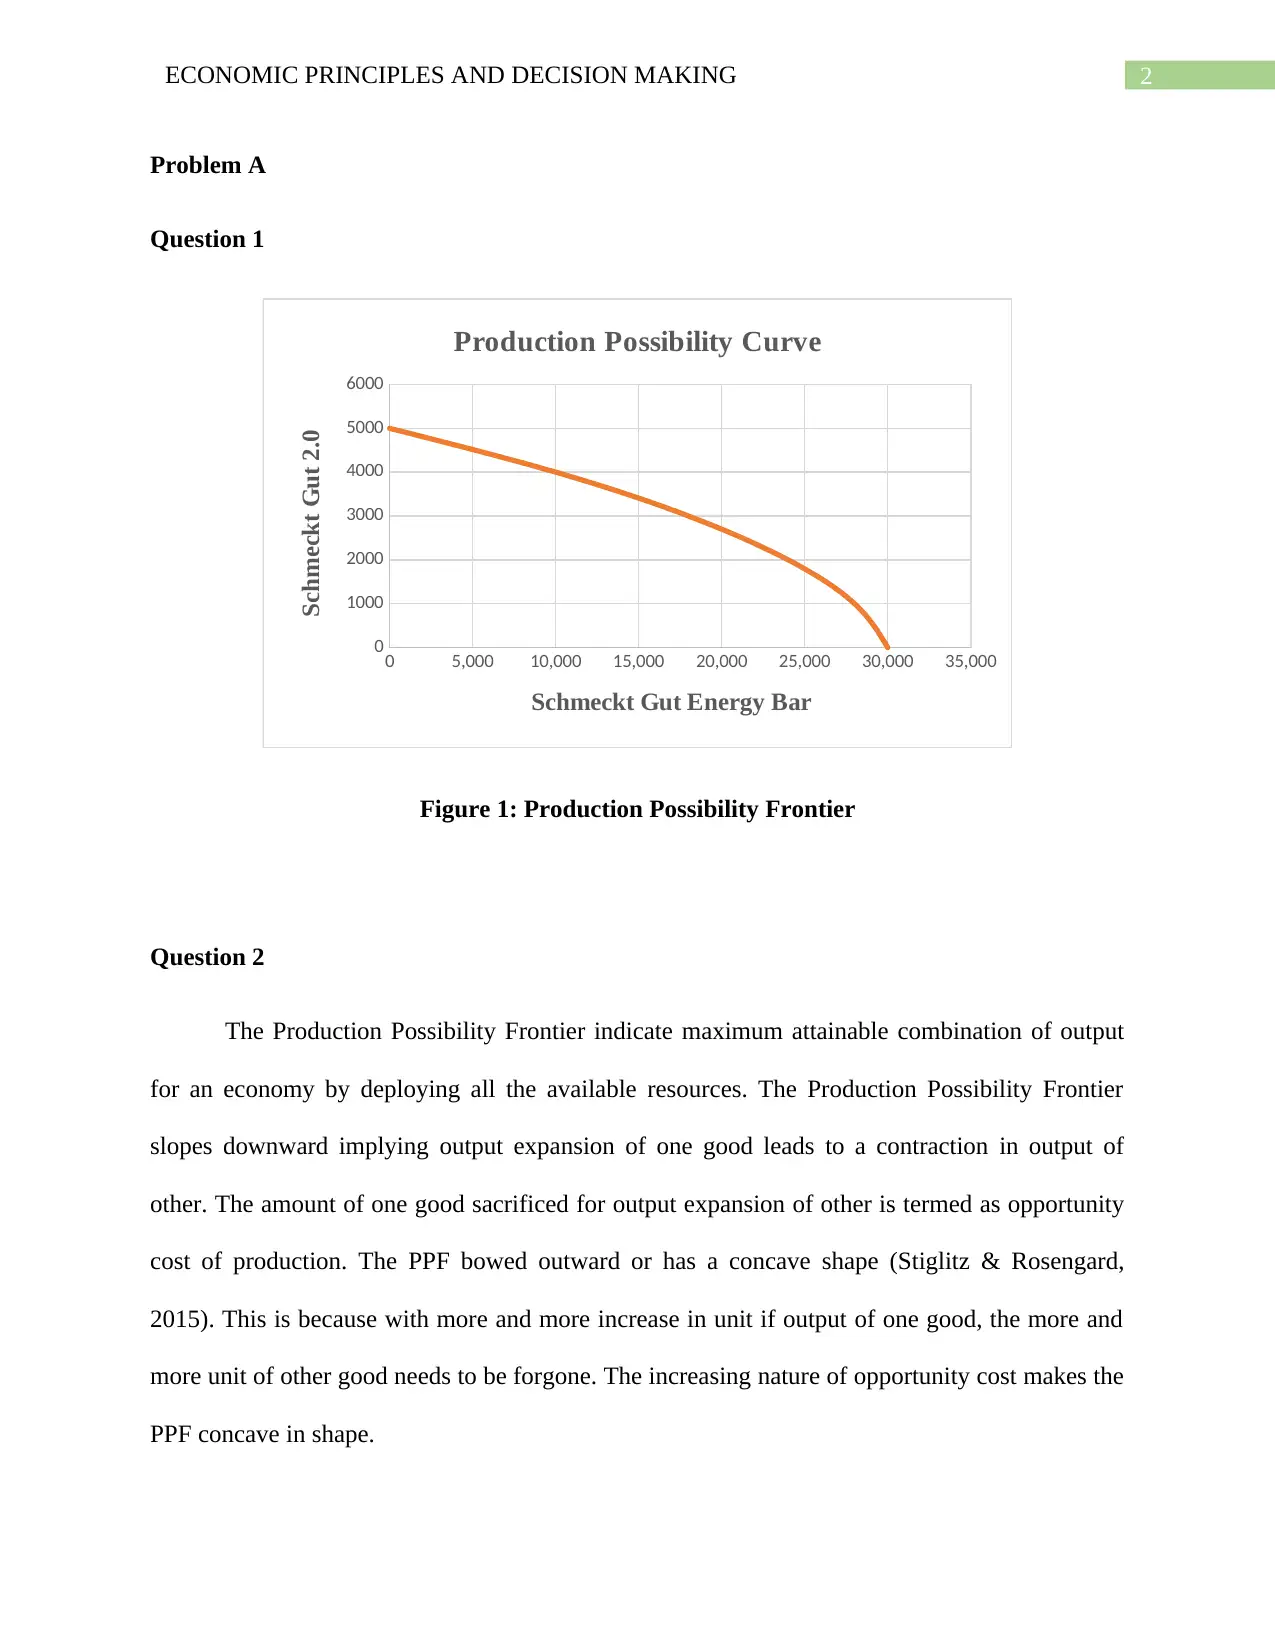
This assignment solution focuses on applying economic principles to decision-making, specifically within a business context. It addresses two main problems. Problem A involves analyzing a production possibility frontier (PPF) for Schmeckt Gut, examining the impact of increased demand and strategies to meet it, such as exploring new resources, improving production technology, or specializing inputs. Problem B delves into market equilibrium, determining the equilibrium price and quantity for energy bars using given demand and supply functions. It further analyzes the effect of a price increase on demand and supply, illustrating the laws of demand and supply. The solution uses calculations and explanations to demonstrate these economic concepts. Desklib offers a variety of similar solved assignments and study resources for students.
1 out of 7
Related Documents


Your All-in-One AI-Powered Toolkit for Academic Success.
+13062052269
info@desklib.com
Available 24*7 on WhatsApp / Email
![[object Object]](/_next/static/media/star-bottom.7253800d.svg)
Copyright © 2020–2026 A2Z Services. All Rights Reserved. Developed and managed by ZUCOL.