ECON940 Statistics: Analyzing Luxury Car Brand Preference Factors
VerifiedAdded on 2023/06/10
|18
|3893
|139
Report
AI Summary
This report analyzes the factors influencing luxury car brand preferences, focusing on BMW, Mercedes, and Lexus. A survey of 420 people examined the relationship between car choice and customer demographics, including age, income, and education. The findings indicate that Mercedes is the most preferred brand, followed by Lexus and BMW. Younger individuals with lower incomes and less education tend to favor BMW, while older, wealthier, and more educated individuals prefer Mercedes. Statistical analysis reveals significant differences in the average age, education, and annual income of respondents who prefer different luxury car brands. Logistic regression is used to evaluate the influence of these factors on brand preference. The report concludes with recommendations for targeted marketing strategies based on the identified customer profiles. Desklib offers this assignment solution and other resources for students.
Running Head: STATISTICS FOR DECISION MAKING
Statistics for Decision Making
Name of the Student
Name of the University
Author Note
Statistics for Decision Making
Name of the Student
Name of the University
Author Note
Paraphrase This Document
Need a fresh take? Get an instant paraphrase of this document with our AI Paraphraser
1STATISTICS FOR DECISION MAKING
Executive Summary
The demand for a commodity depends on various factors. For luxury cars, the demand is
dependent on the taste and preference of the customer, to choose the brand and the model of
the cars they are to buy. The differences in the choices are observed for different brands of
cars when all of them belong to the same price range and possess almost the same
specifications. Thus, it becomes a problem for the sellers at times to find out which model
should be imposed more on which type of buyer. In this report, an analysis of the problem
related to this business to set up a marketing strategy for the luxury cars of different brands
will be presented. The chosen car brands for the analysis are BMW, Mercedes and Lexus.
Other information such as the age, the income and the years of education completed by the
customers are also considered along with the choice of their cars. The survey was conducted
on 420 people in total for the purpose of the analysis. The results obtained from the survey
show that Mercedes is preferred by most people followed by the preference for Lexus and
BMW. Younger people having lower annual income and lesser years of education have been
found to be preferring BMW. On the other hand, older people having much higher annual
income and more years of education have been found to be preferring Mercedes. According
to further analysis, it has been observed that there are significant differences in the average
age, education and annual income of the respondents, who are preferring different types of
luxury car brands.
2STATISTICS FOR DECISION MAKING
Table of Contents
1.0 Introduction..........................................................................................................................3
1.1 Introduction to the Business Problem..............................................................................3
1.2 Introduction to the Statistical Problem.............................................................................3
2.0 Data Analysis.......................................................................................................................3
2.1 Summary of the Age Groups............................................................................................3
2.2 Summary of Annual Income............................................................................................6
2.3 Summary of Years of Education......................................................................................9
2.4 Test for Difference in Ages............................................................................................12
2.5 Test for Difference in Annual Income...........................................................................13
2.6 Test for Difference in Years of Education.....................................................................14
2.7 Logistic Regression........................................................................................................15
3.0 Conclusion and Recommendation......................................................................................16
⊘ This is a preview!⊘
Do you want full access?
Subscribe today to unlock all pages.
Trusted by 1+ million students worldwide
3STATISTICS FOR DECISION MAKING
1.0 Introduction
1.1 Introduction to the Business Problem
The Automobile association has been facing problems in targeting the population
group to whom which brand of car should be more advertised. The taste and preferences of
the people differ with different age group, income and education. Thus, the company wanted
to analyse the demand for the luxury cars in the households considering the factors such as
age, income and years of education. The main aim of this research will be to identify how
each of the considered attributes such as age, income and education of the buyers of luxury
cars define their preferences towards any particular brands. The customer profile information
will be useful for the association to analyse their demands so that they can come up with
some strategies to sell the cars to the potential buyers and attract new customers as well.
1.2 Introduction to the Statistical Problem
The business problem that has been discussed already needs to be evaluated with the
help of the application of appropriate statistical techniques and interpretation of the results as
well. Measures of shape and location will be used to determine the shape of the distribution
of the profiles of the customers. The Association is also interested to know the differences in
the age, annual income and years of education of the buyers of the different brands of cars.
Appropriate testing strategies will be used in order to test these differences. The preference of
the brands of the luxury cars with respect to the influence of age, education and annual
income of the customers will be evaluated with the help of logistic regression technique.
2.0 Data Analysis
2.1 Summary of the Age Groups
Paraphrase This Document
Need a fresh take? Get an instant paraphrase of this document with our AI Paraphraser

4STATISTICS FOR DECISION MAKING
It can be seen from table that in the lower age group of 35 – 44 years, preference of
people is more towards BMW rather than Lexus and Mercedes, in the age group of 45 – 54
years, people can be seen to be preferring Lexus and between 55 – 64 years, people mostly
prefer Mercedes. Thus, it can be said that the older people are more likely to prefer Mercedes
than BMW or Lexus and the Younger People are more likely to prefer BMW over Mercedes
and Lexus. Lexus is preferred by the middle aged people mostly.
Table 1: Preference of Luxury Cars with respect to Age Groups
Car Type and Age Car Types
Age Group (In Years) BMW Lexus Mercedes Grand Total
35-44 58 20 24 102
45-54 66 82 74 222
55-64 6 34 50 90
65-74 4 2 6
Grand Total 130 140 150 420
35-44 45-54 55-64 65-74
0
10
20
30
40
50
60
70
80
90
Preference of Car Types with Age
BMW
Lexus
Mercedes
Age Group (In Years)
Frequency
Figure 1: Bar Graph Showing preference of Luxury Cars with respect to Age group
It can be seen that the average age of the people preferring BMW cars is 45.22 years,
preferring Lexus cars is 50.46 years and preferring Mercedes cars is 51.99 years. It can also
be seen that the standard deviation of the ages of the people preferring the three types of cars
namely BMW, Lexus and Mercedes are 4.4 years, 6.1 years and 6.7 years respectively, which
5STATISTICS FOR DECISION MAKING
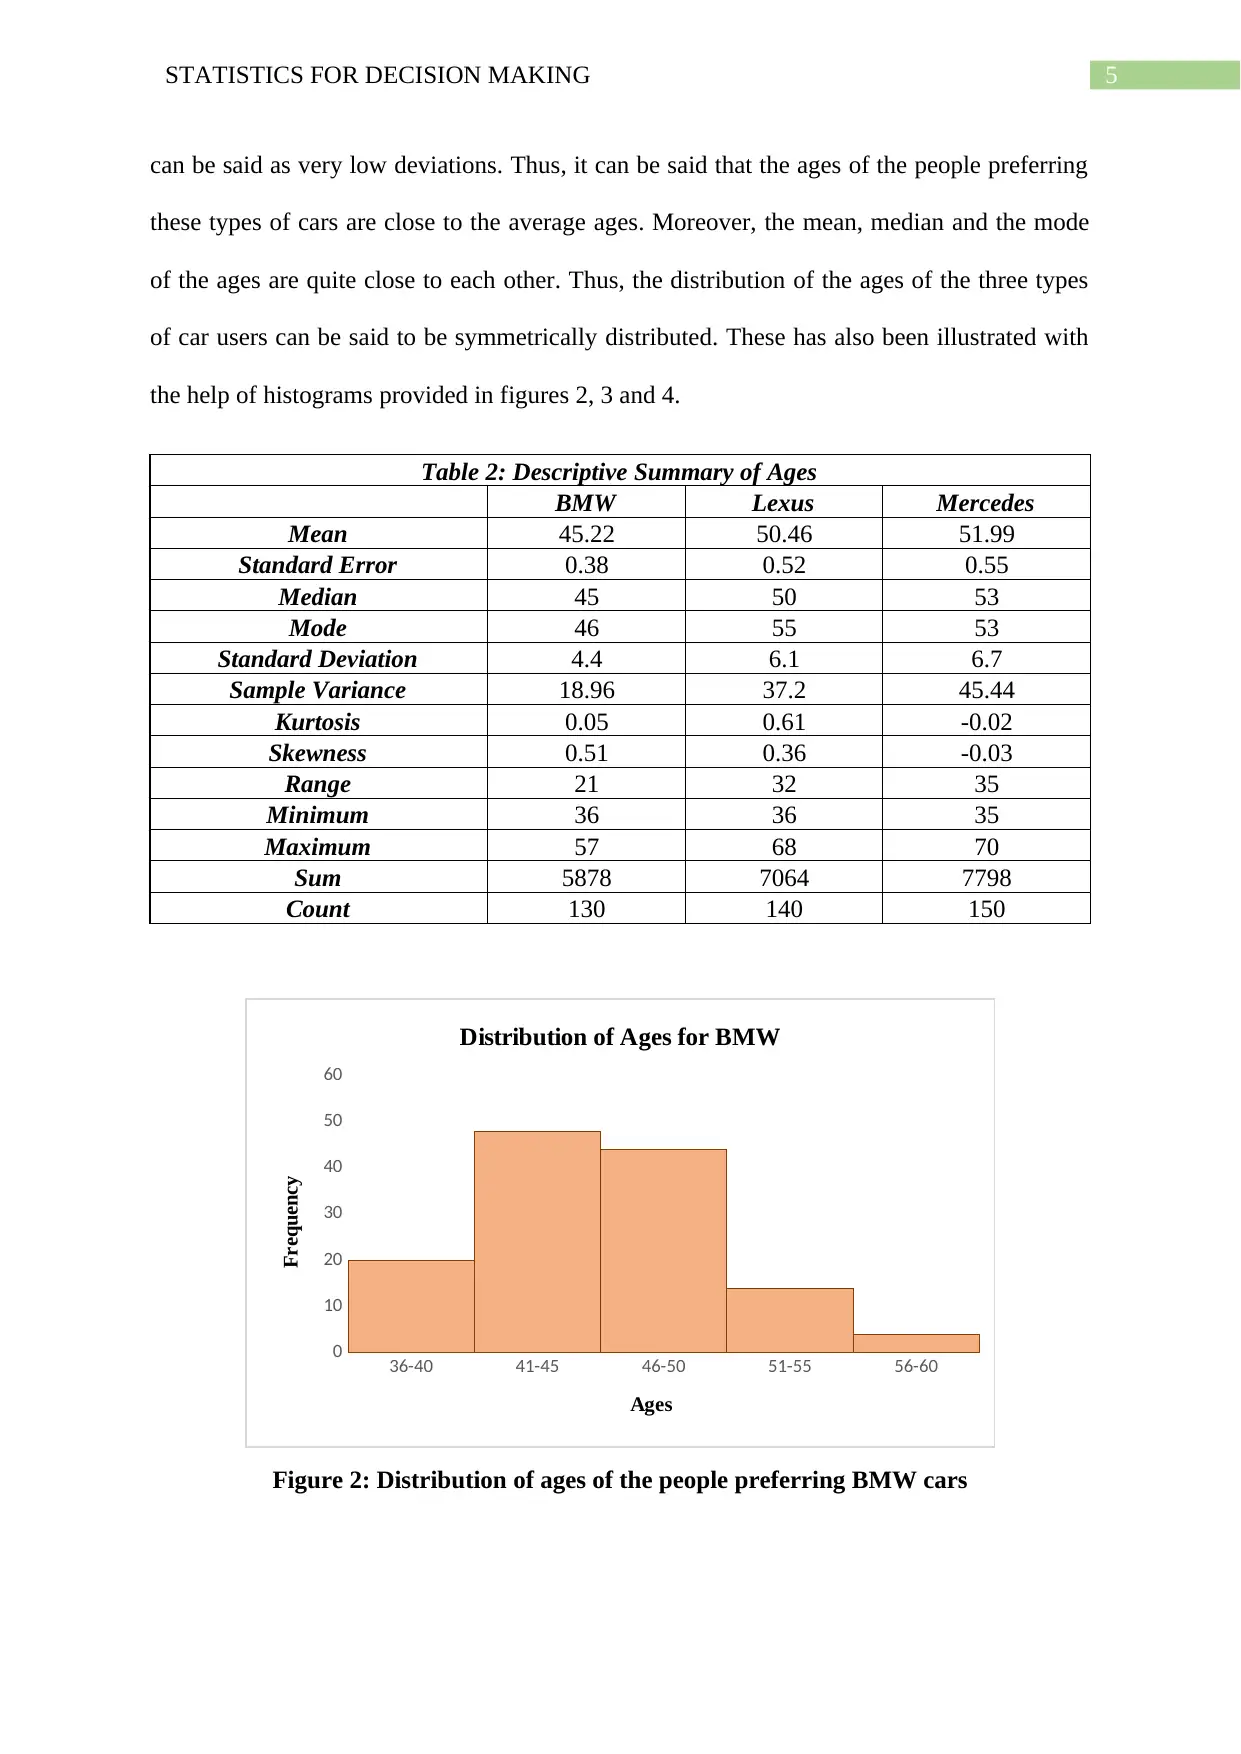
can be said as very low deviations. Thus, it can be said that the ages of the people preferring
these types of cars are close to the average ages. Moreover, the mean, median and the mode
of the ages are quite close to each other. Thus, the distribution of the ages of the three types
of car users can be said to be symmetrically distributed. These has also been illustrated with
the help of histograms provided in figures 2, 3 and 4.
Table 2: Descriptive Summary of Ages
BMW Lexus Mercedes
Mean 45.22 50.46 51.99
Standard Error 0.38 0.52 0.55
Median 45 50 53
Mode 46 55 53
Standard Deviation 4.4 6.1 6.7
Sample Variance 18.96 37.2 45.44
Kurtosis 0.05 0.61 -0.02
Skewness 0.51 0.36 -0.03
Range 21 32 35
Minimum 36 36 35
Maximum 57 68 70
Sum 5878 7064 7798
Count 130 140 150
36-40 41-45 46-50 51-55 56-60
0
10
20
30
40
50
60
Distribution of Ages for BMW
Ages
Frequency
Figure 2: Distribution of ages of the people preferring BMW cars
⊘ This is a preview!⊘
Do you want full access?
Subscribe today to unlock all pages.
Trusted by 1+ million students worldwide
6STATISTICS FOR DECISION MAKING
36-45 46-55 56-65 66-75
0
10
20
30
40
50
60
70
80
90
100
Distribution of Ages for Lexus
Ages
Frequency
Figure 3: Distribution of ages of the people preferring Lexus cars
35-44 45-54 55-64 65-74
0
10
20
30
40
50
60
70
80
Distribution of Ages for Mercedes
Ages
Frequency
Figure 4: Distribution of ages of the people preferring Mercedes cars
2.2 Summary of Annual Income
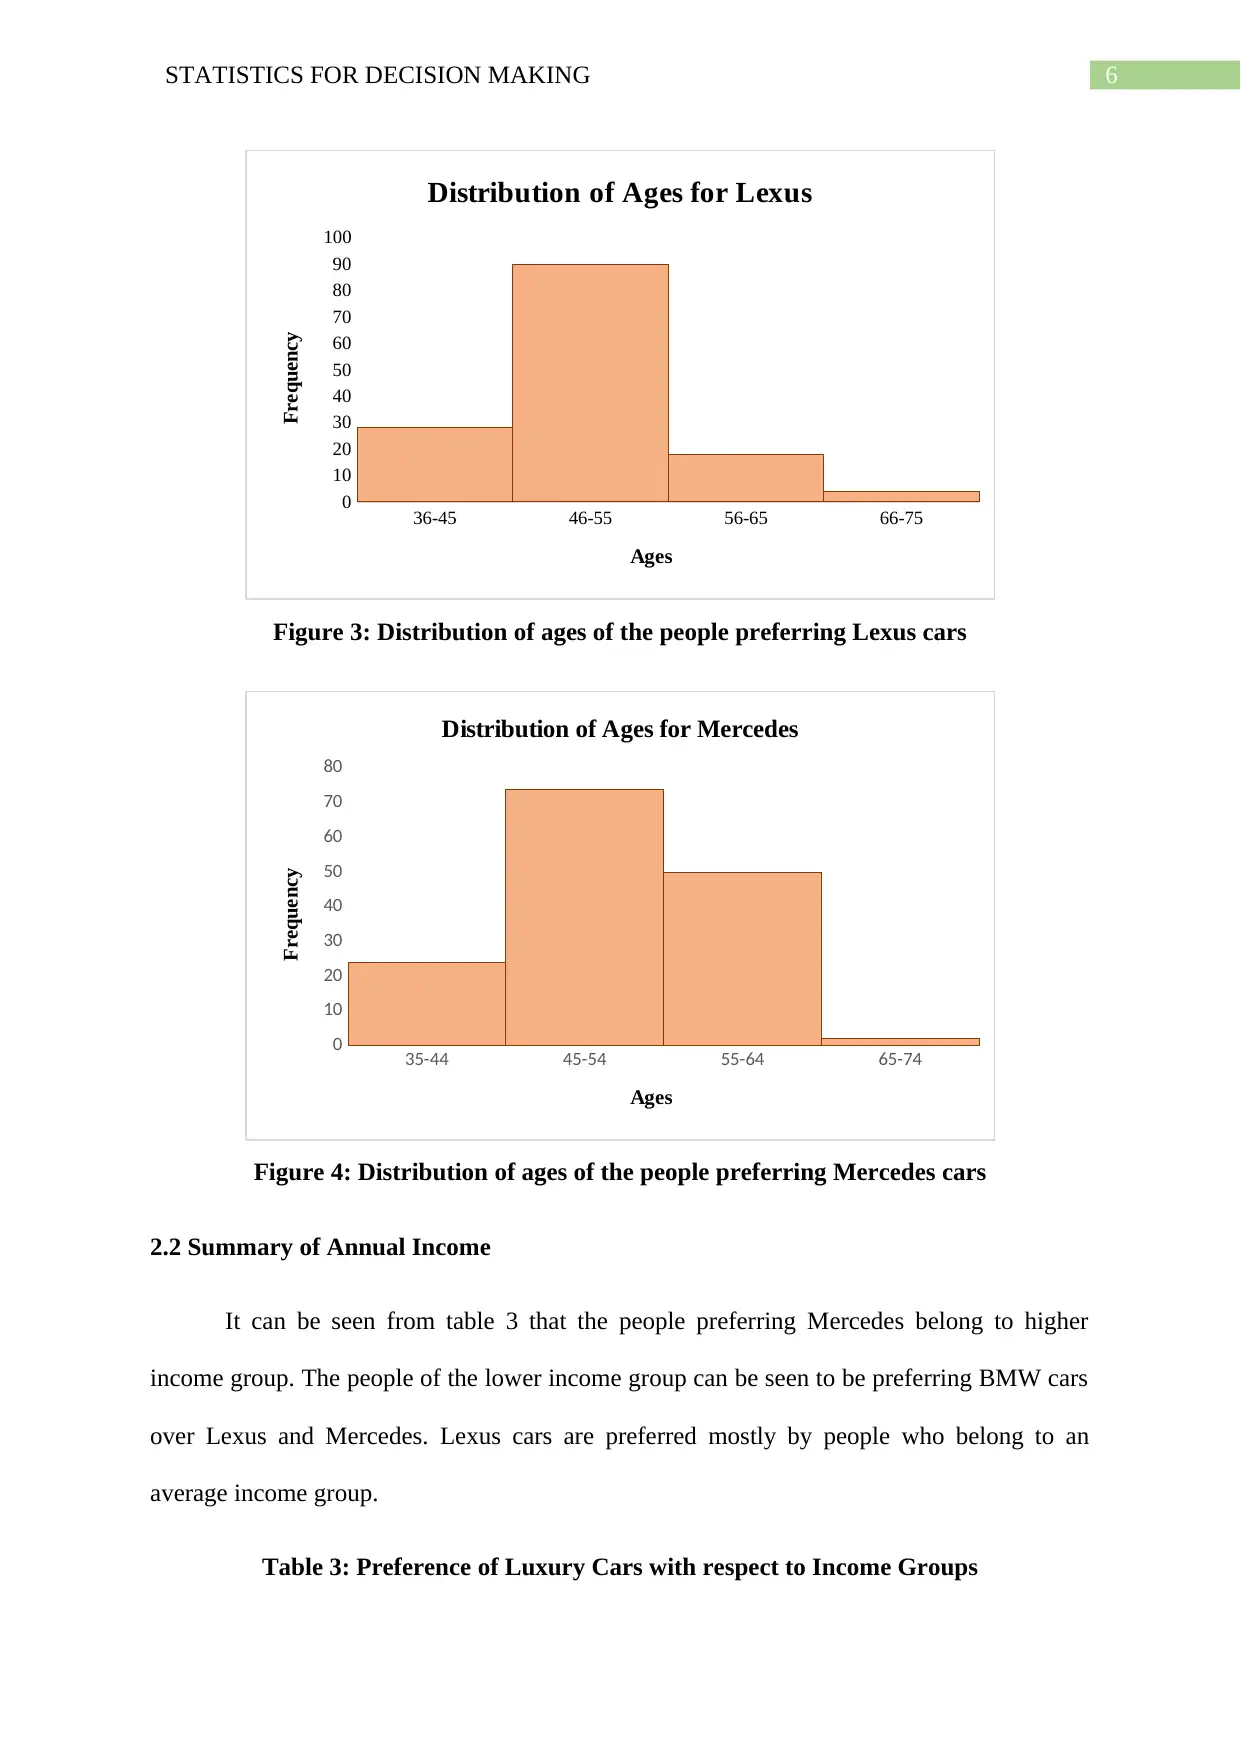
It can be seen from table 3 that the people preferring Mercedes belong to higher
income group. The people of the lower income group can be seen to be preferring BMW cars
over Lexus and Mercedes. Lexus cars are preferred mostly by people who belong to an
average income group.
Table 3: Preference of Luxury Cars with respect to Income Groups
36-45 46-55 56-65 66-75
0
10
20
30
40
50
60
70
80
90
100
Distribution of Ages for Lexus
Ages
Frequency
Figure 3: Distribution of ages of the people preferring Lexus cars
35-44 45-54 55-64 65-74
0
10
20
30
40
50
60
70
80
Distribution of Ages for Mercedes
Ages
Frequency
Figure 4: Distribution of ages of the people preferring Mercedes cars
2.2 Summary of Annual Income
It can be seen from table 3 that the people preferring Mercedes belong to higher
income group. The people of the lower income group can be seen to be preferring BMW cars
over Lexus and Mercedes. Lexus cars are preferred mostly by people who belong to an
average income group.
Table 3: Preference of Luxury Cars with respect to Income Groups
Paraphrase This Document
Need a fresh take? Get an instant paraphrase of this document with our AI Paraphraser
7STATISTICS FOR DECISION MAKING
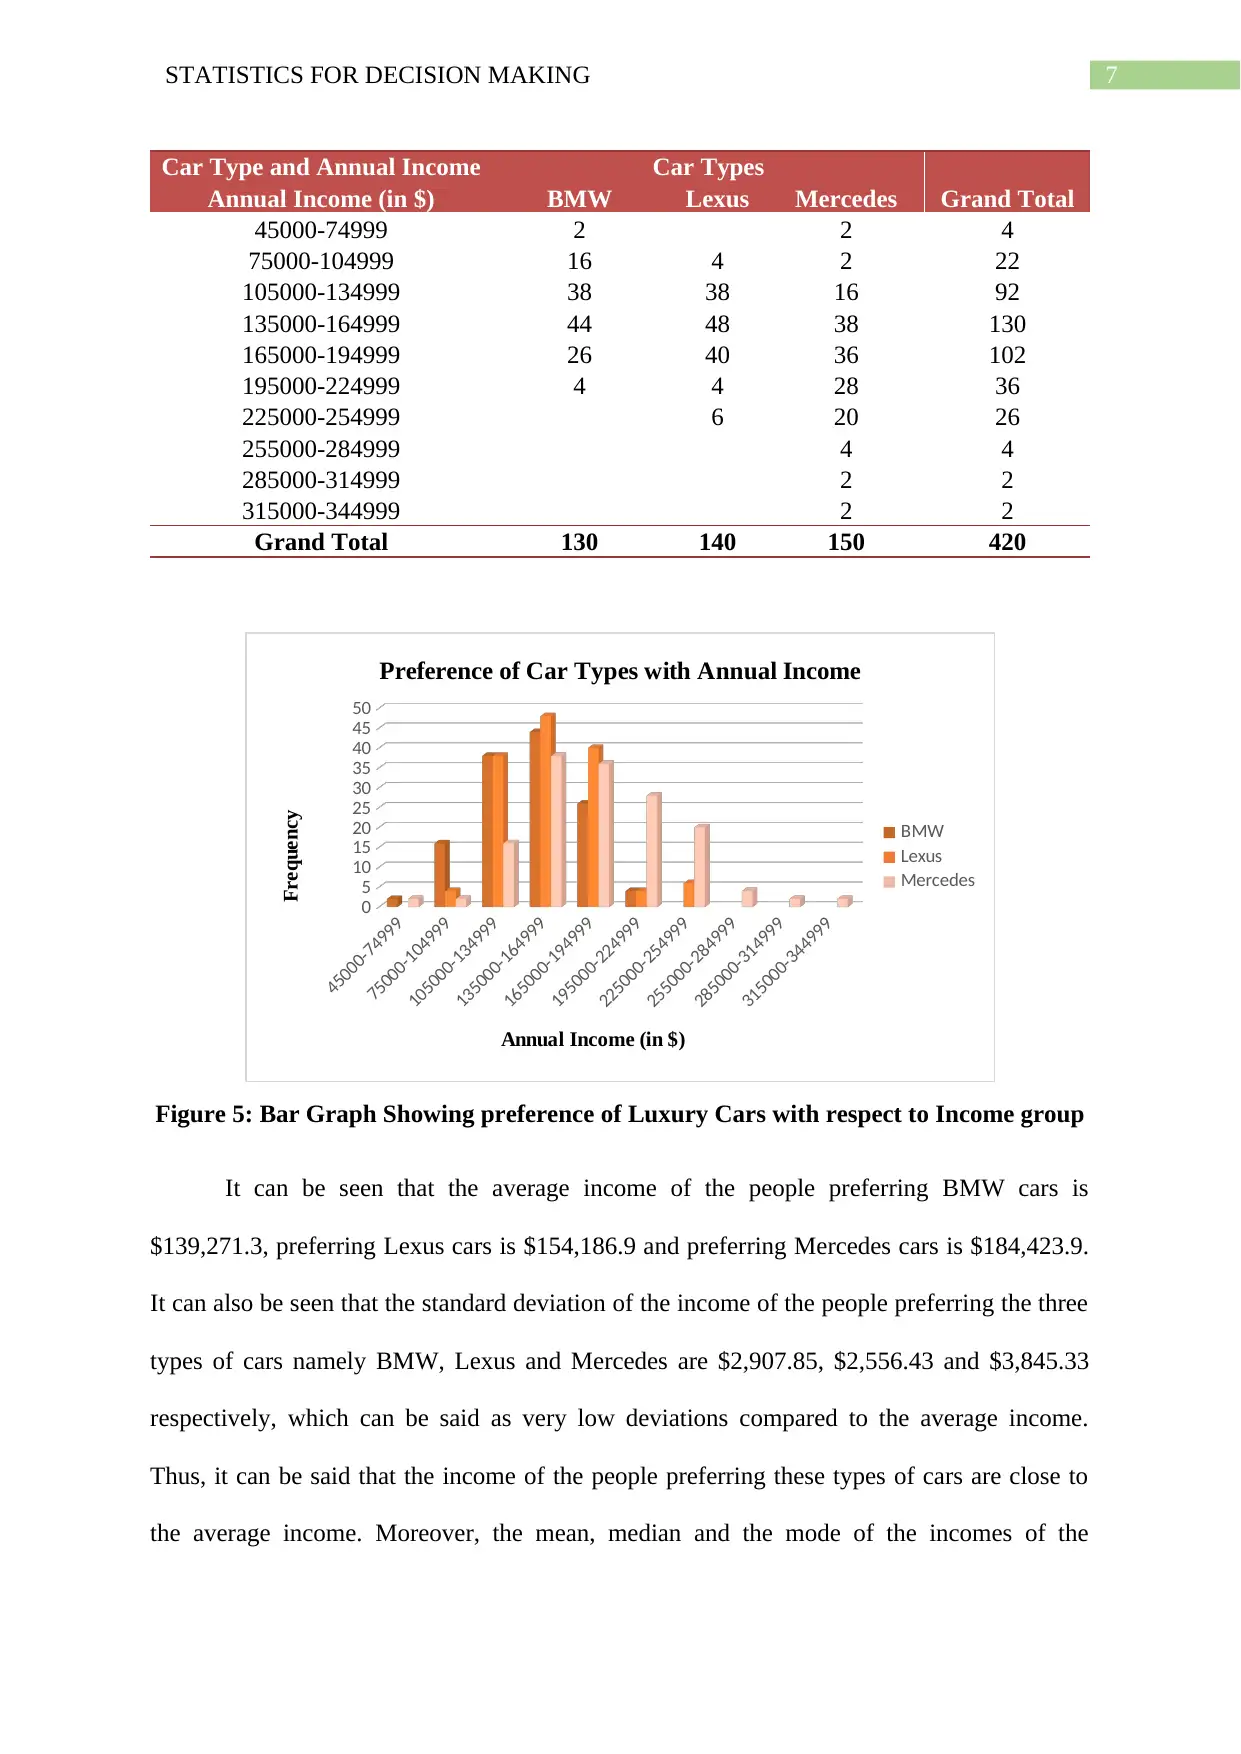
Car Type and Annual Income Car Types
Annual Income (in $) BMW Lexus Mercedes Grand Total
45000-74999 2 2 4
75000-104999 16 4 2 22
105000-134999 38 38 16 92
135000-164999 44 48 38 130
165000-194999 26 40 36 102
195000-224999 4 4 28 36
225000-254999 6 20 26
255000-284999 4 4
285000-314999 2 2
315000-344999 2 2
Grand Total 130 140 150 420
45000-74999
75000-104999
105000-134999
135000-164999
165000-194999
195000-224999
225000-254999
255000-284999
285000-314999
315000-344999
0
5
10
15
20
25
30
35
40
45
50
Preference of Car Types with Annual Income
BMW
Lexus
Mercedes
Annual Income (in $)
Frequency
Figure 5: Bar Graph Showing preference of Luxury Cars with respect to Income group
It can be seen that the average income of the people preferring BMW cars is
$139,271.3, preferring Lexus cars is $154,186.9 and preferring Mercedes cars is $184,423.9.
It can also be seen that the standard deviation of the income of the people preferring the three
types of cars namely BMW, Lexus and Mercedes are $2,907.85, $2,556.43 and $3,845.33
respectively, which can be said as very low deviations compared to the average income.
Thus, it can be said that the income of the people preferring these types of cars are close to
the average income. Moreover, the mean, median and the mode of the incomes of the
8STATISTICS FOR DECISION MAKING
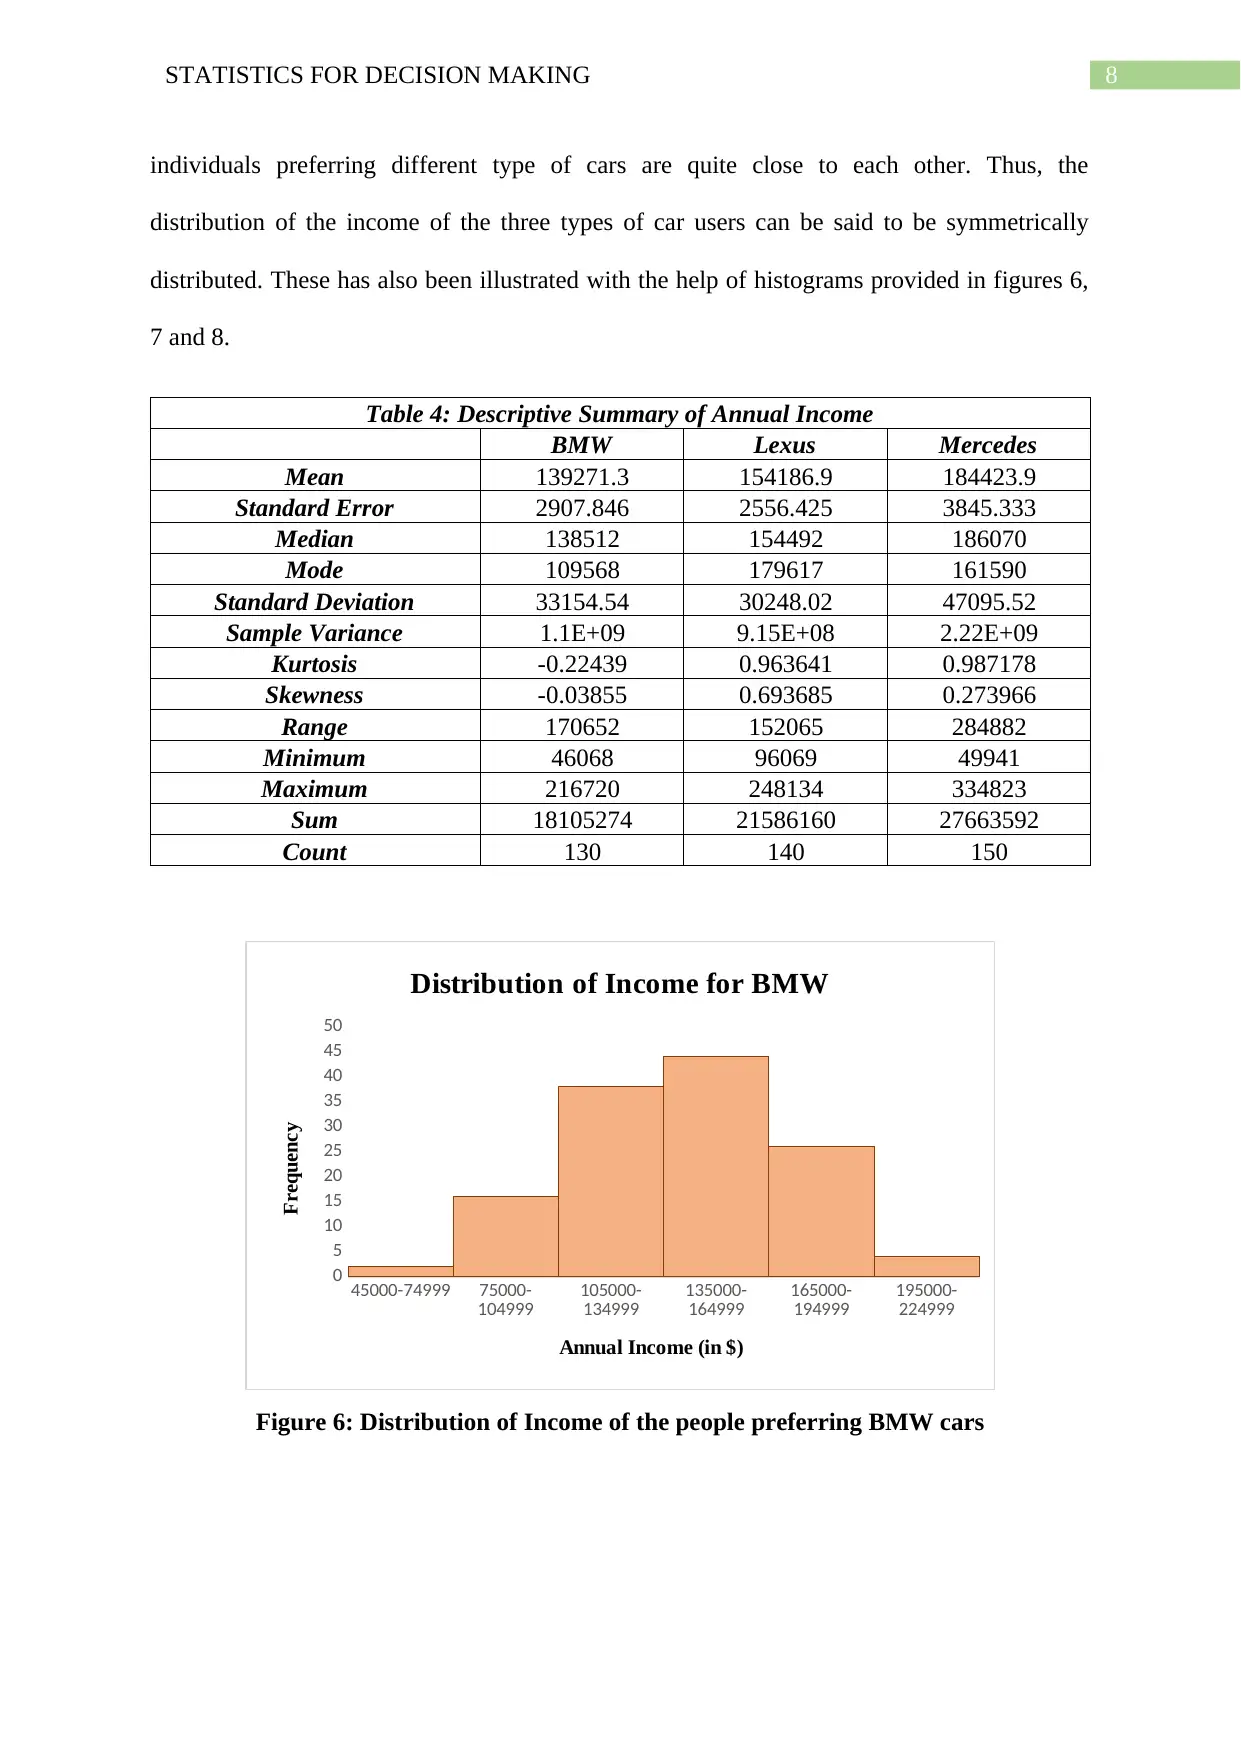
individuals preferring different type of cars are quite close to each other. Thus, the
distribution of the income of the three types of car users can be said to be symmetrically
distributed. These has also been illustrated with the help of histograms provided in figures 6,
7 and 8.
Table 4: Descriptive Summary of Annual Income
BMW Lexus Mercedes
Mean 139271.3 154186.9 184423.9
Standard Error 2907.846 2556.425 3845.333
Median 138512 154492 186070
Mode 109568 179617 161590
Standard Deviation 33154.54 30248.02 47095.52
Sample Variance 1.1E+09 9.15E+08 2.22E+09
Kurtosis -0.22439 0.963641 0.987178
Skewness -0.03855 0.693685 0.273966
Range 170652 152065 284882
Minimum 46068 96069 49941
Maximum 216720 248134 334823
Sum 18105274 21586160 27663592
Count 130 140 150
45000-74999 75000-
104999 105000-
134999 135000-
164999 165000-
194999 195000-
224999
0
5
10
15
20
25
30
35
40
45
50
Distribution of Income for BMW
Annual Income (in $)
Frequency
Figure 6: Distribution of Income of the people preferring BMW cars
⊘ This is a preview!⊘
Do you want full access?
Subscribe today to unlock all pages.
Trusted by 1+ million students worldwide

9STATISTICS FOR DECISION MAKING
95000-
124999 125000-
154999 155000-
184999 185000-
214999 215000-
244999 245000-
274999
0
10
20
30
40
50
60
70
Distribution of Income for Lexus
Annual Income ($)
Frequency
Figure 7: Distribution of Income of the people preferring Lexus cars
45000-
74999 75000-
104999 105000
-
134999
135000
-
164999
165000
-
194999
195000
-
224999
225000
-
254999
255000
-
284999
285000
-
314999
315000
-
344999
0
5
10
15
20
25
30
35
40
Distribution of Income for Mercedes
Annual Income ($)
Frequency
Figure 8: Distribution of Income of the people preferring Mercedes cars
2.3 Summary of Years of Education
It can be seen from table 5 that in the lower education group of 11 – 13 years,
preference of people is more towards Lexus rather than BMW and Mercedes, in the education
group of 14 – 16 years, people can be seen to be preferring BMW and between 17 – 22 years,
people mostly prefer Mercedes. Thus, it can be said that the people with higher education are
more likely to prefer Mercedes than BMW or Lexus and the people with lower income
Paraphrase This Document
Need a fresh take? Get an instant paraphrase of this document with our AI Paraphraser
10STATISTICS FOR DECISION MAKING
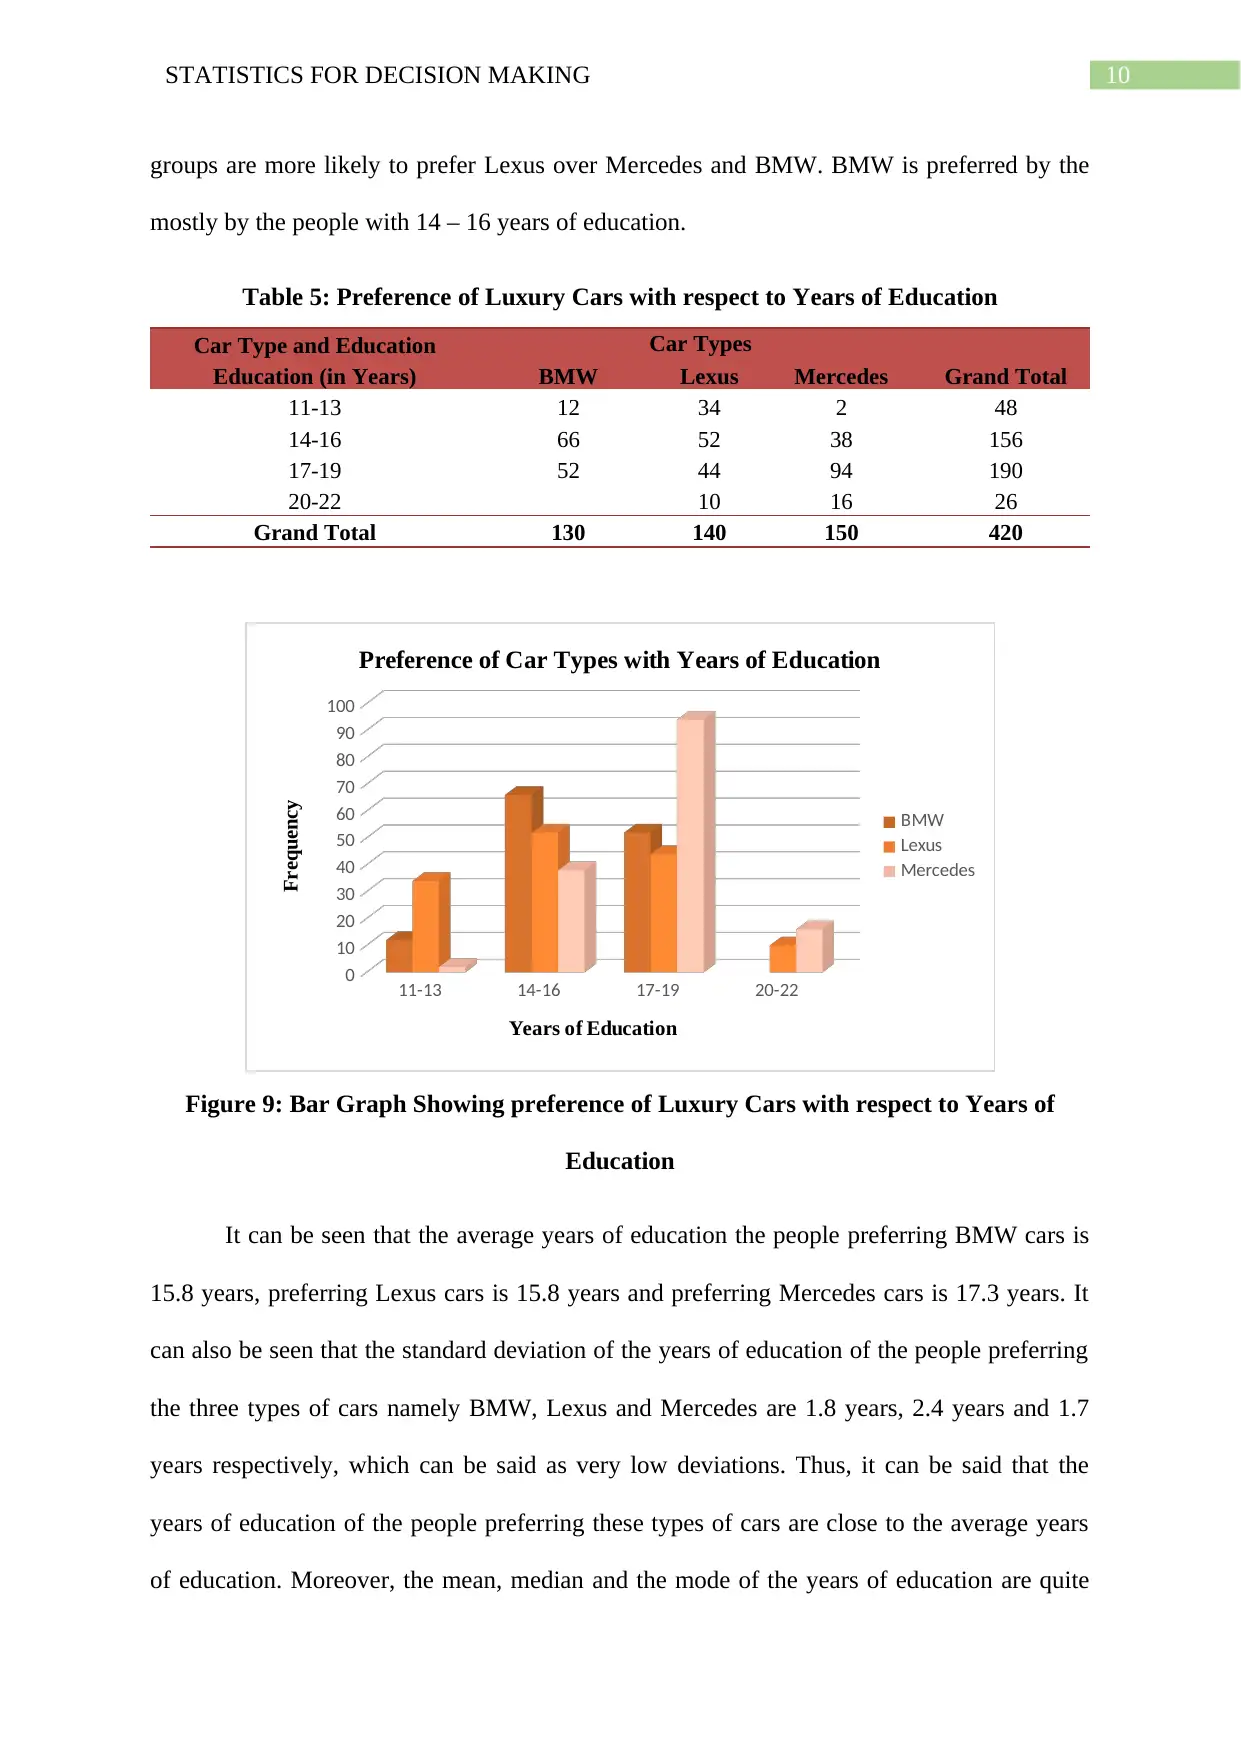
groups are more likely to prefer Lexus over Mercedes and BMW. BMW is preferred by the
mostly by the people with 14 – 16 years of education.
Table 5: Preference of Luxury Cars with respect to Years of Education
Car Type and Education Car Types
Education (in Years) BMW Lexus Mercedes Grand Total
11-13 12 34 2 48
14-16 66 52 38 156
17-19 52 44 94 190
20-22 10 16 26
Grand Total 130 140 150 420
11-13 14-16 17-19 20-22
0
10
20
30
40
50
60
70
80
90
100
Preference of Car Types with Years of Education
BMW
Lexus
Mercedes
Years of Education
Frequency
Figure 9: Bar Graph Showing preference of Luxury Cars with respect to Years of
Education
It can be seen that the average years of education the people preferring BMW cars is
15.8 years, preferring Lexus cars is 15.8 years and preferring Mercedes cars is 17.3 years. It
can also be seen that the standard deviation of the years of education of the people preferring
the three types of cars namely BMW, Lexus and Mercedes are 1.8 years, 2.4 years and 1.7
years respectively, which can be said as very low deviations. Thus, it can be said that the
years of education of the people preferring these types of cars are close to the average years
of education. Moreover, the mean, median and the mode of the years of education are quite
11STATISTICS FOR DECISION MAKING
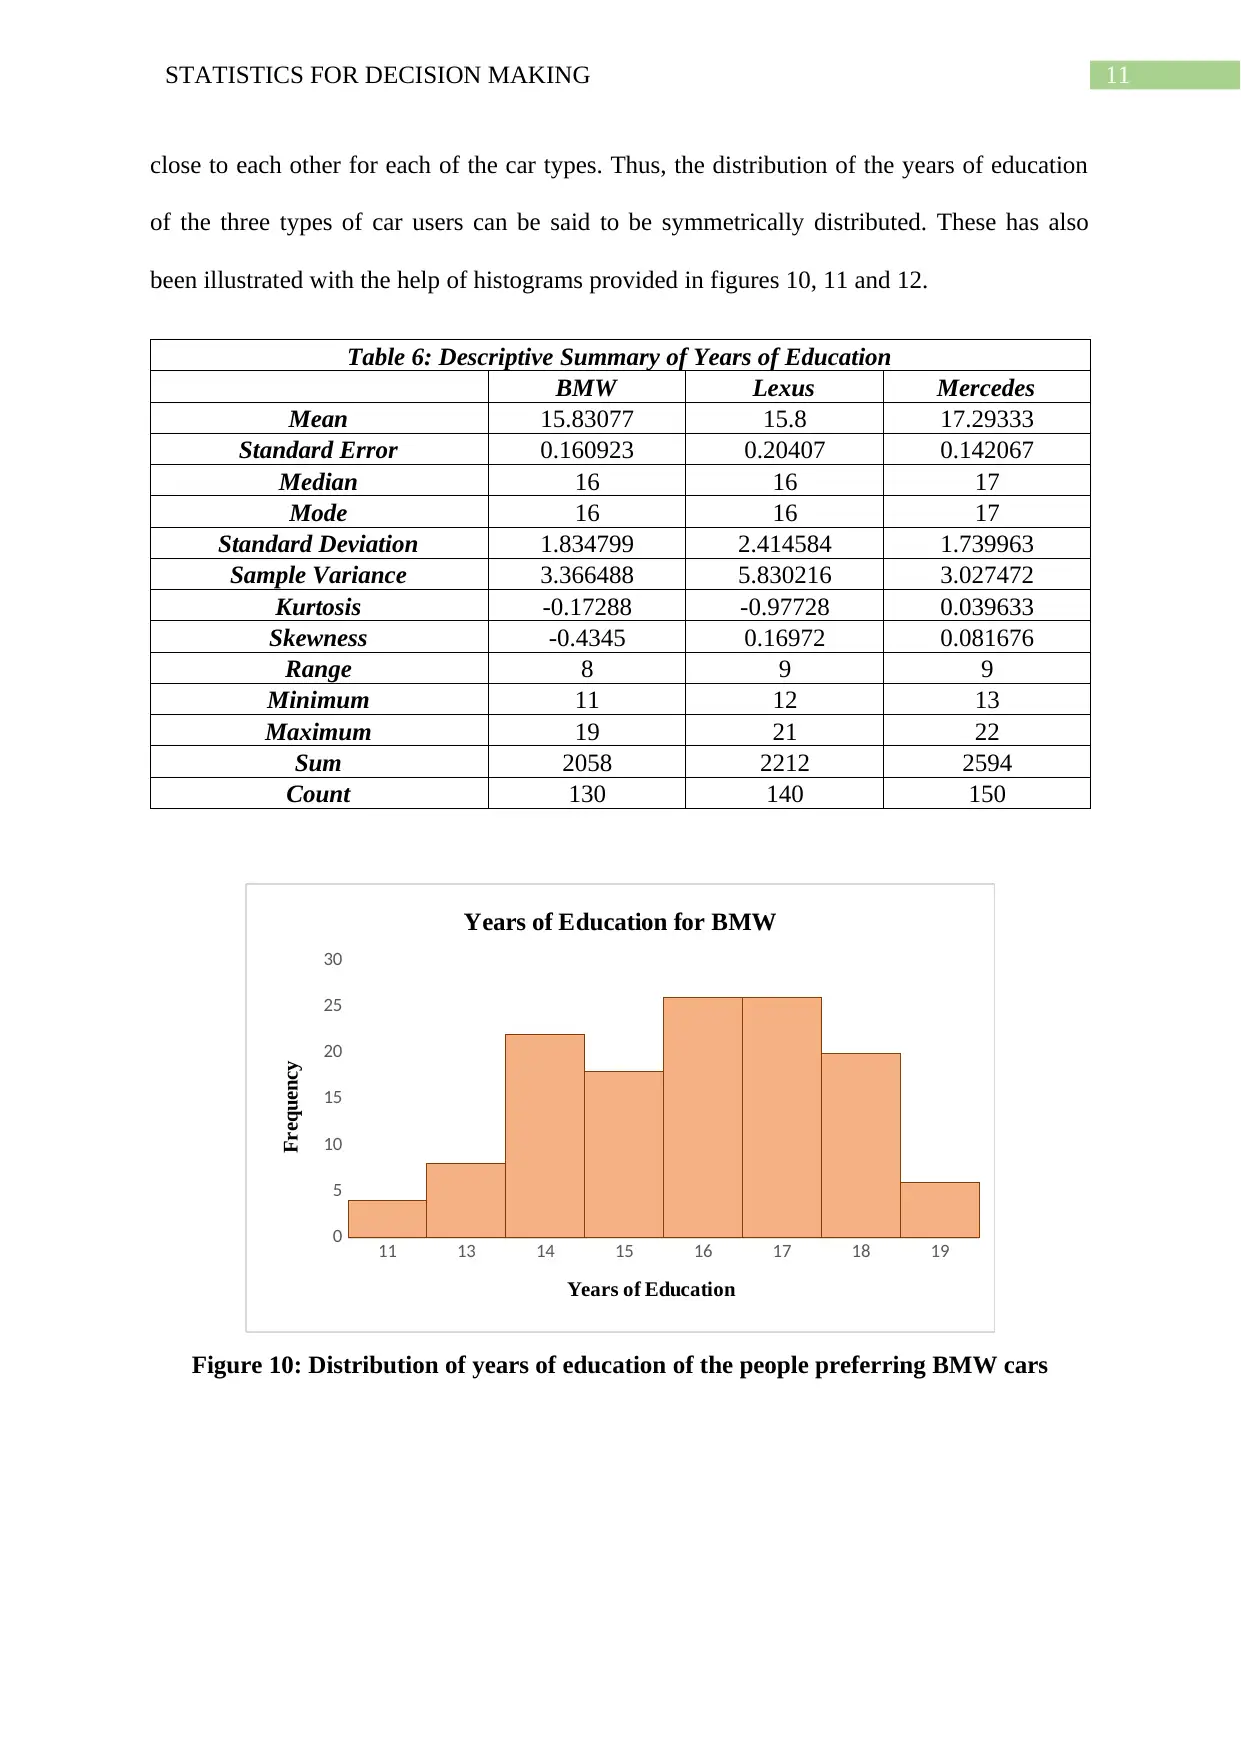
close to each other for each of the car types. Thus, the distribution of the years of education
of the three types of car users can be said to be symmetrically distributed. These has also
been illustrated with the help of histograms provided in figures 10, 11 and 12.
Table 6: Descriptive Summary of Years of Education
BMW Lexus Mercedes
Mean 15.83077 15.8 17.29333
Standard Error 0.160923 0.20407 0.142067
Median 16 16 17
Mode 16 16 17
Standard Deviation 1.834799 2.414584 1.739963
Sample Variance 3.366488 5.830216 3.027472
Kurtosis -0.17288 -0.97728 0.039633
Skewness -0.4345 0.16972 0.081676
Range 8 9 9
Minimum 11 12 13
Maximum 19 21 22
Sum 2058 2212 2594
Count 130 140 150
11 13 14 15 16 17 18 19
0
5
10
15
20
25
30
Years of Education for BMW
Years of Education
Frequency
Figure 10: Distribution of years of education of the people preferring BMW cars
⊘ This is a preview!⊘
Do you want full access?
Subscribe today to unlock all pages.
Trusted by 1+ million students worldwide
1 out of 18
Related Documents


Your All-in-One AI-Powered Toolkit for Academic Success.
+13062052269
info@desklib.com
Available 24*7 on WhatsApp / Email
![[object Object]](/_next/static/media/star-bottom.7253800d.svg)
Unlock your academic potential
Copyright © 2020–2026 A2Z Services. All Rights Reserved. Developed and managed by ZUCOL.