Econometrics Assignment: Analysis of Economic Models and Data

Verified

Added on  2020/10/05

|18
|1742
|129
Homework Assignment
AI Summary
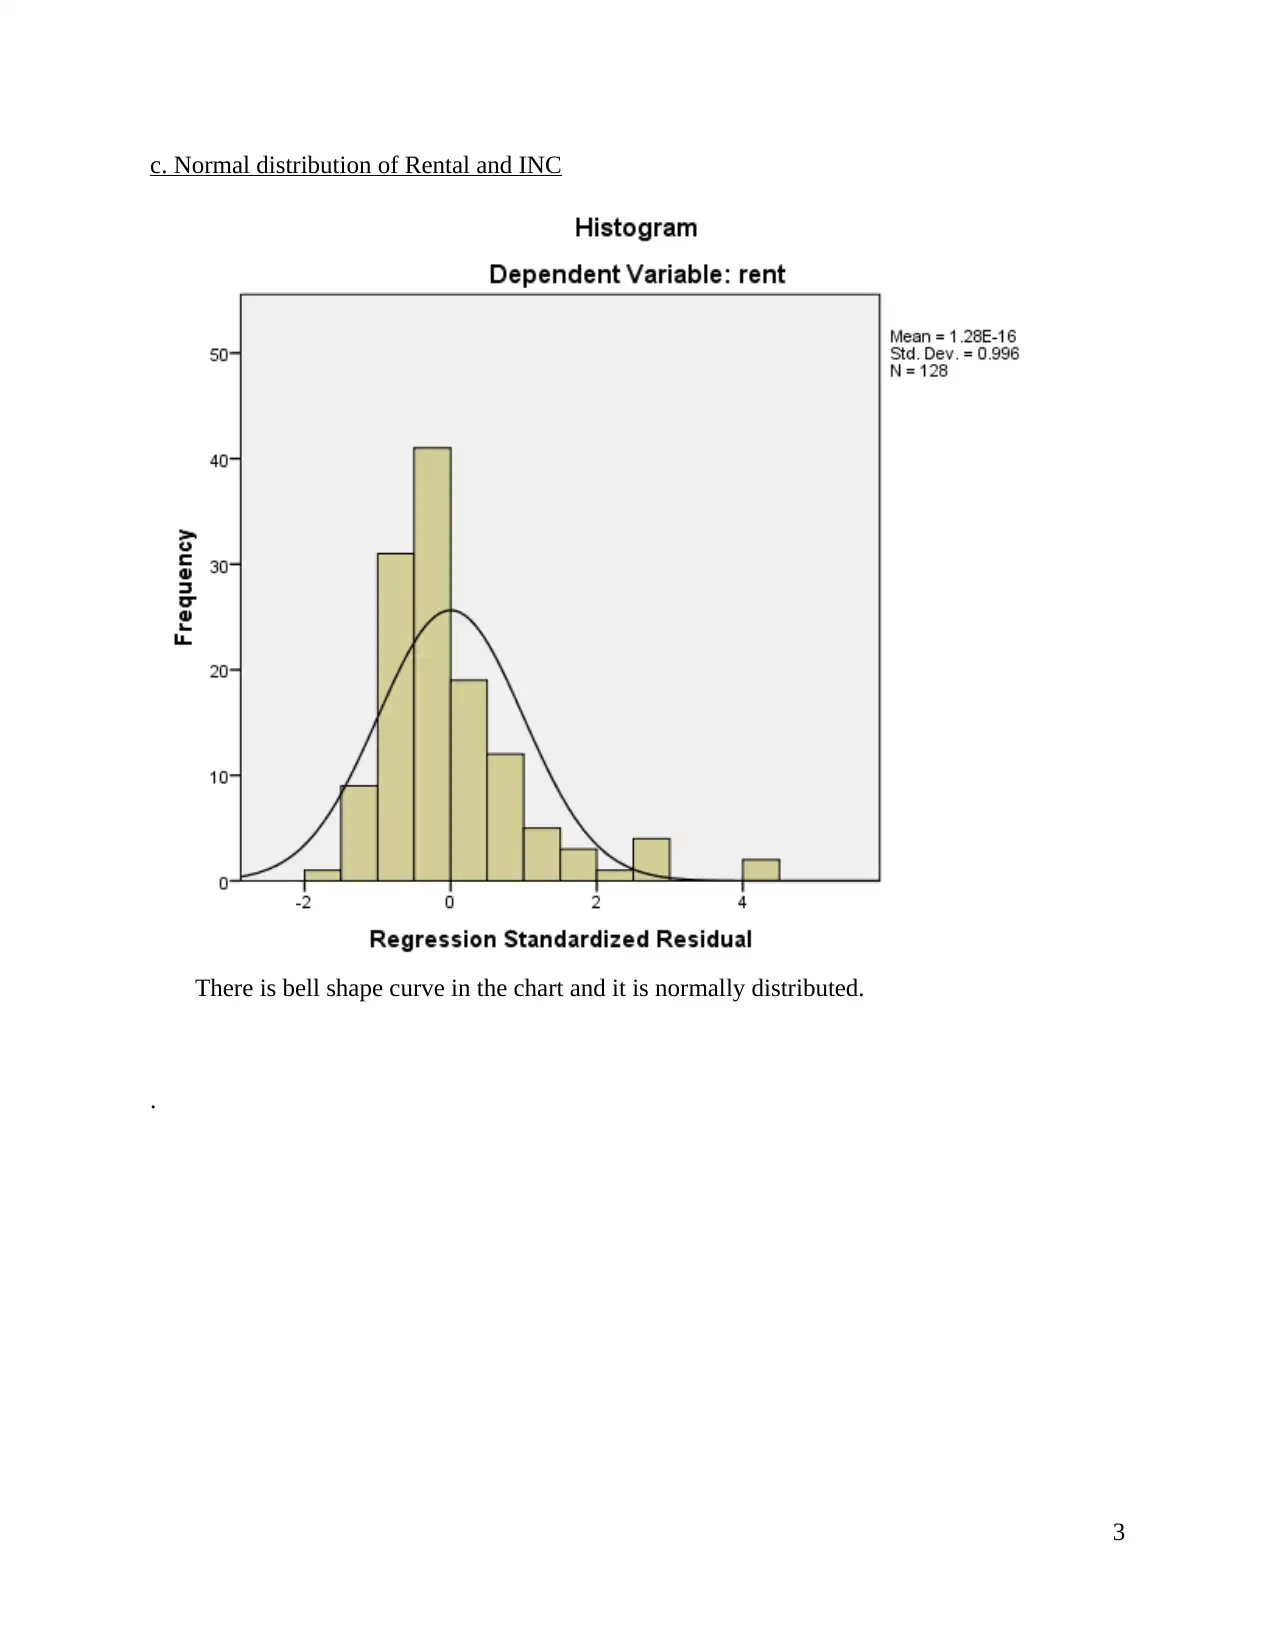
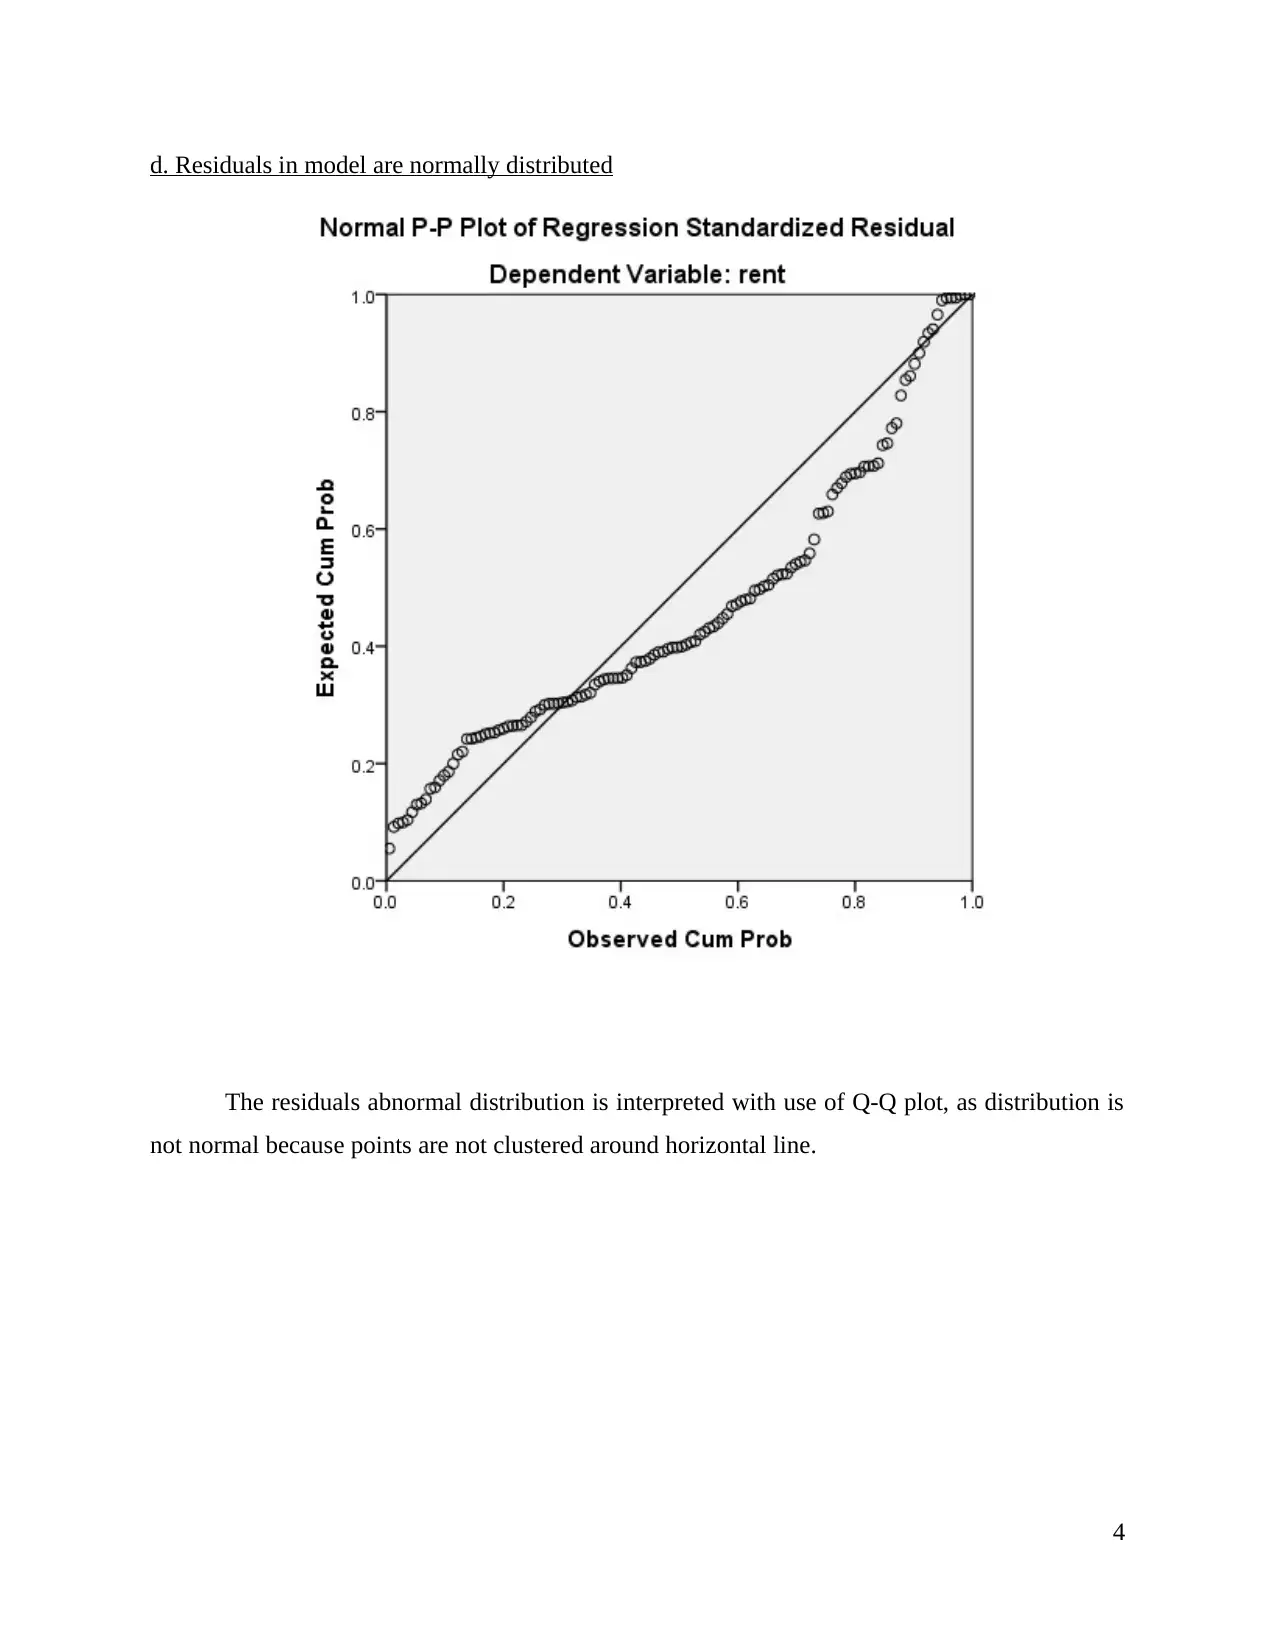
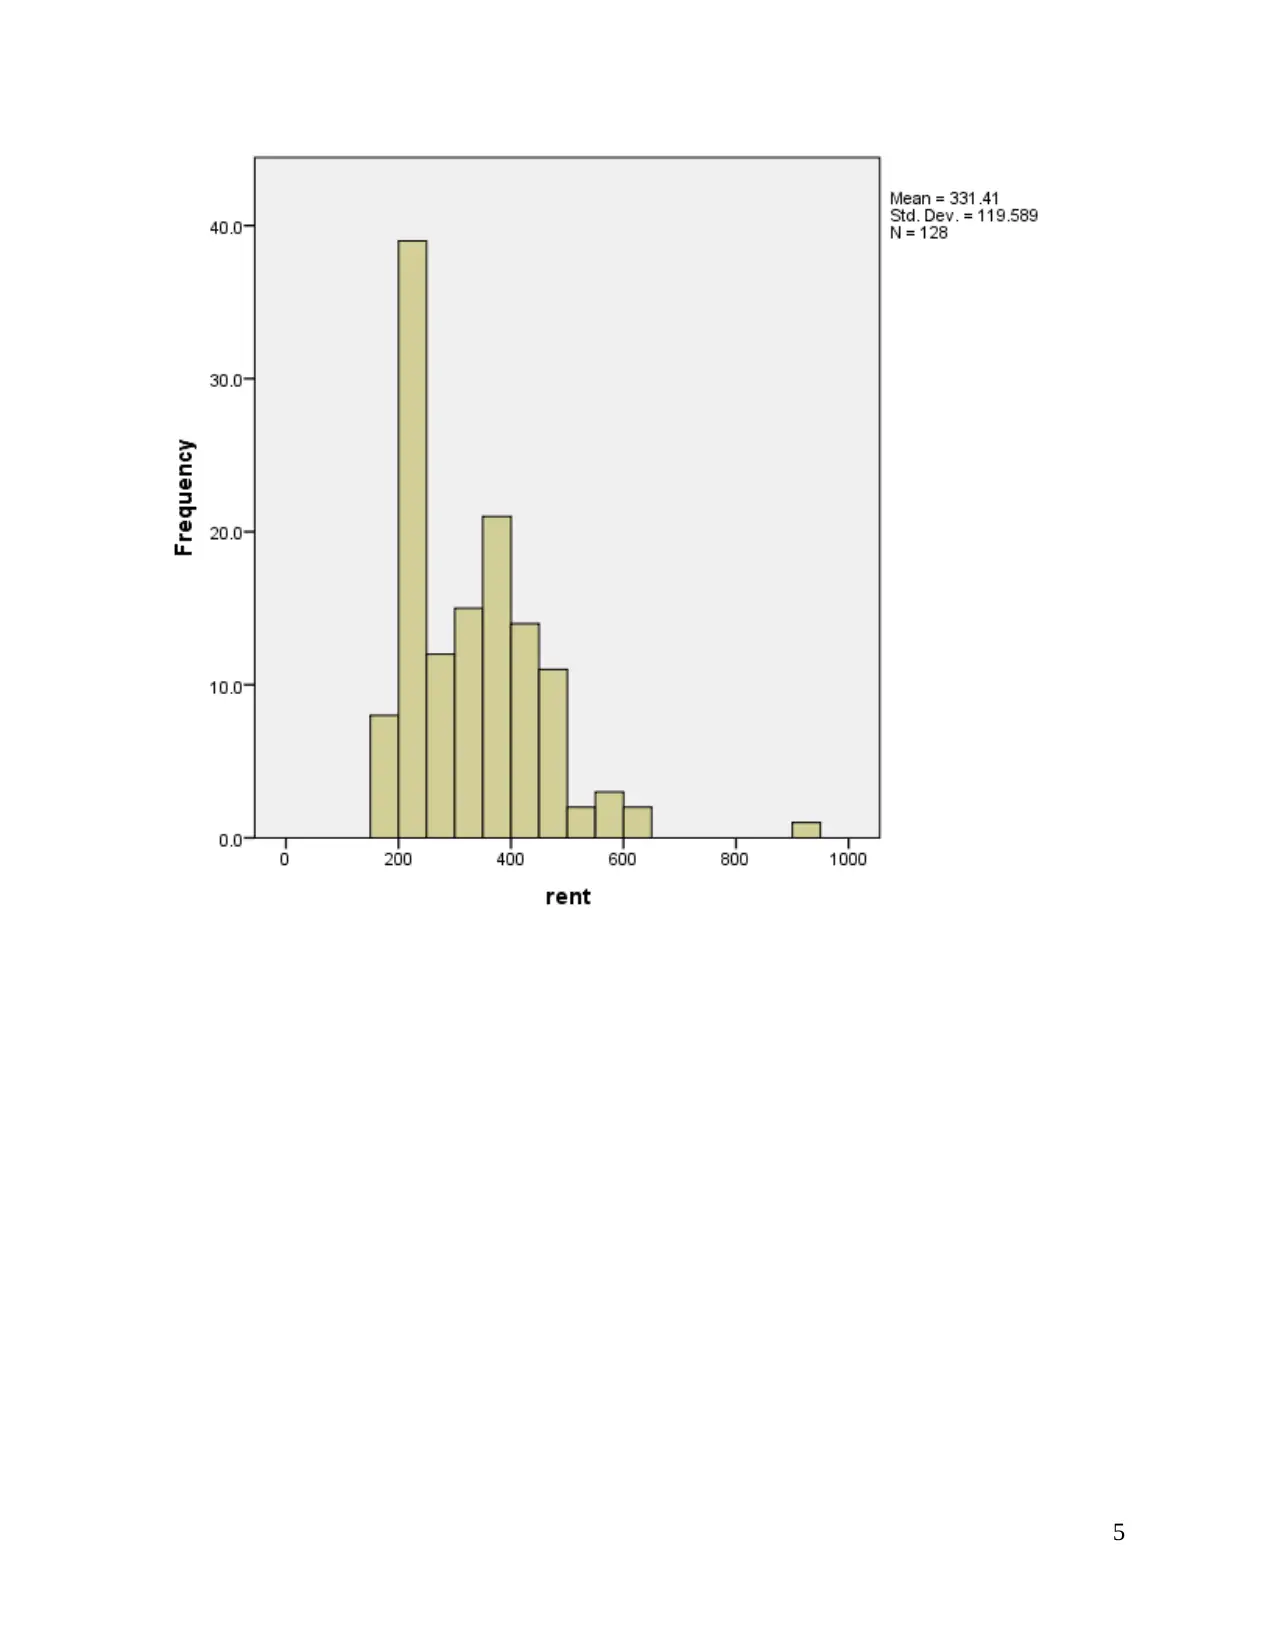
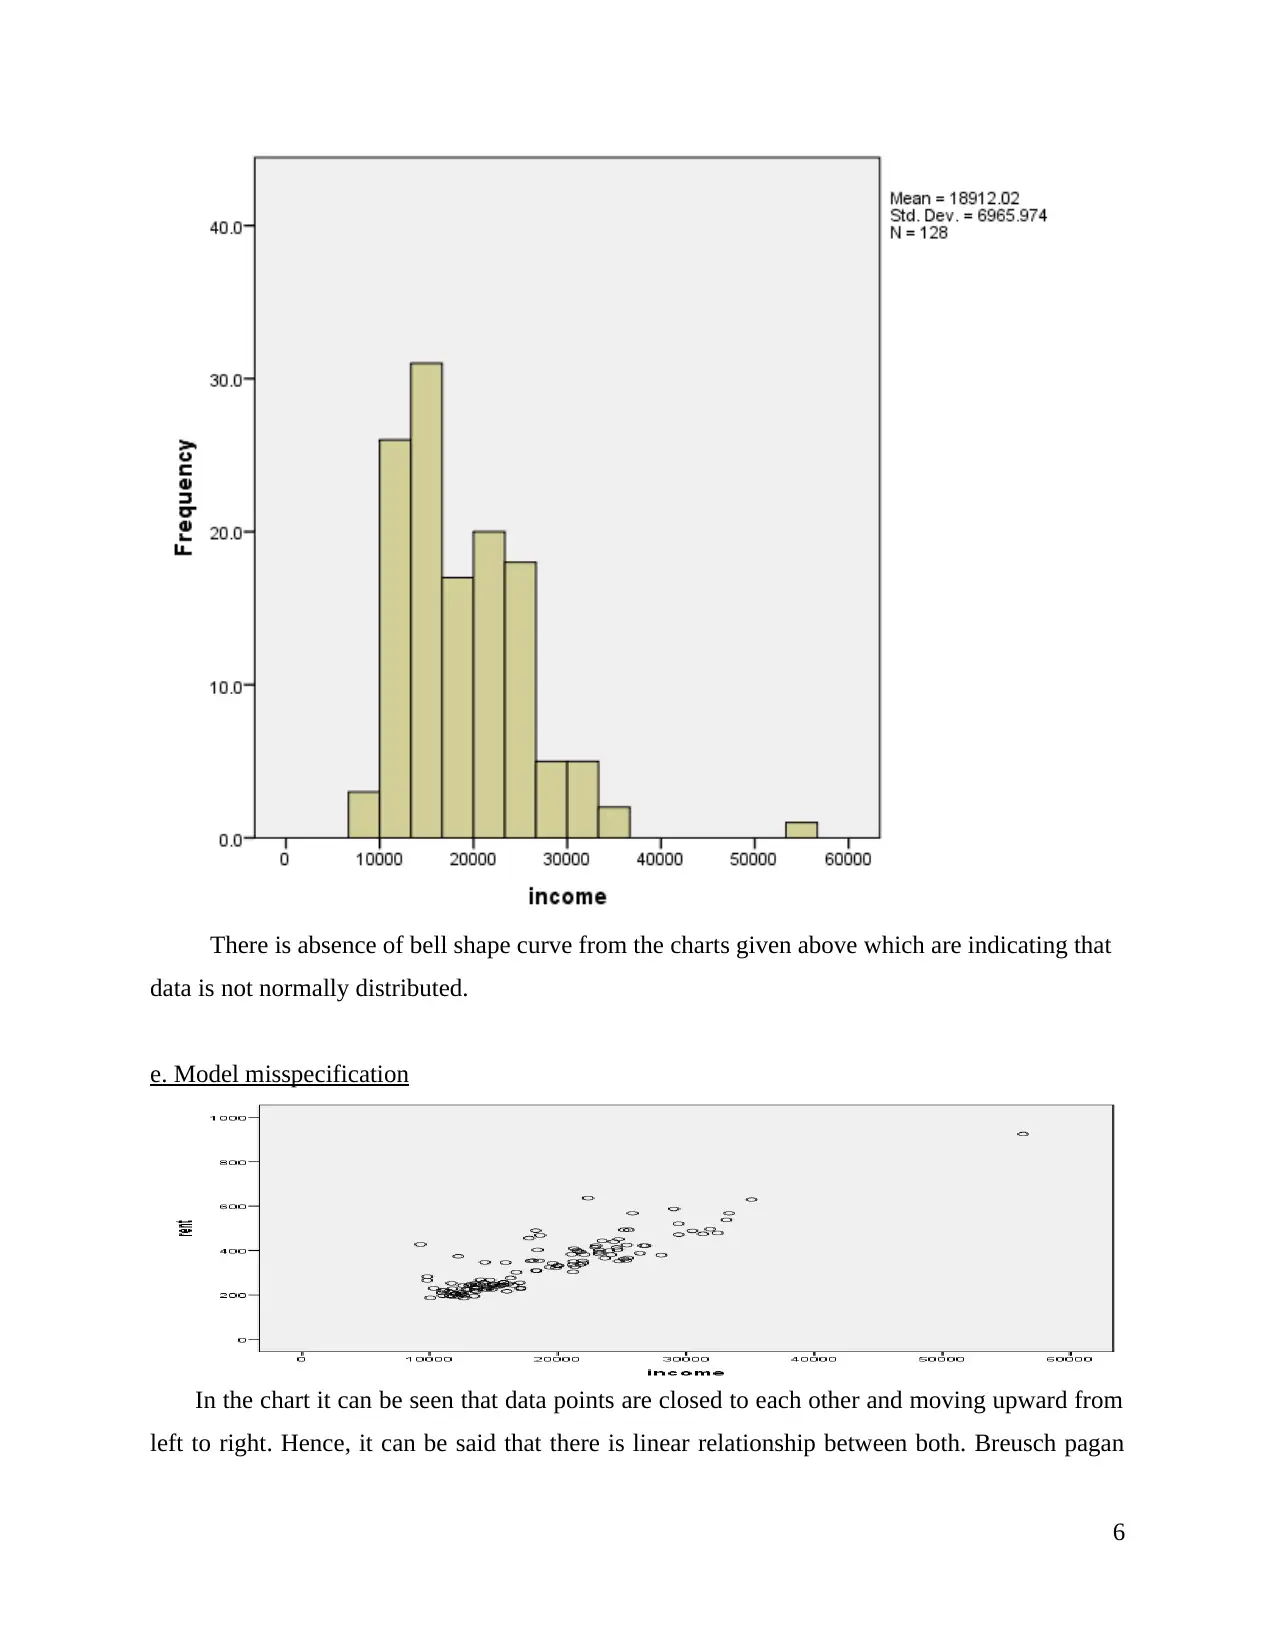
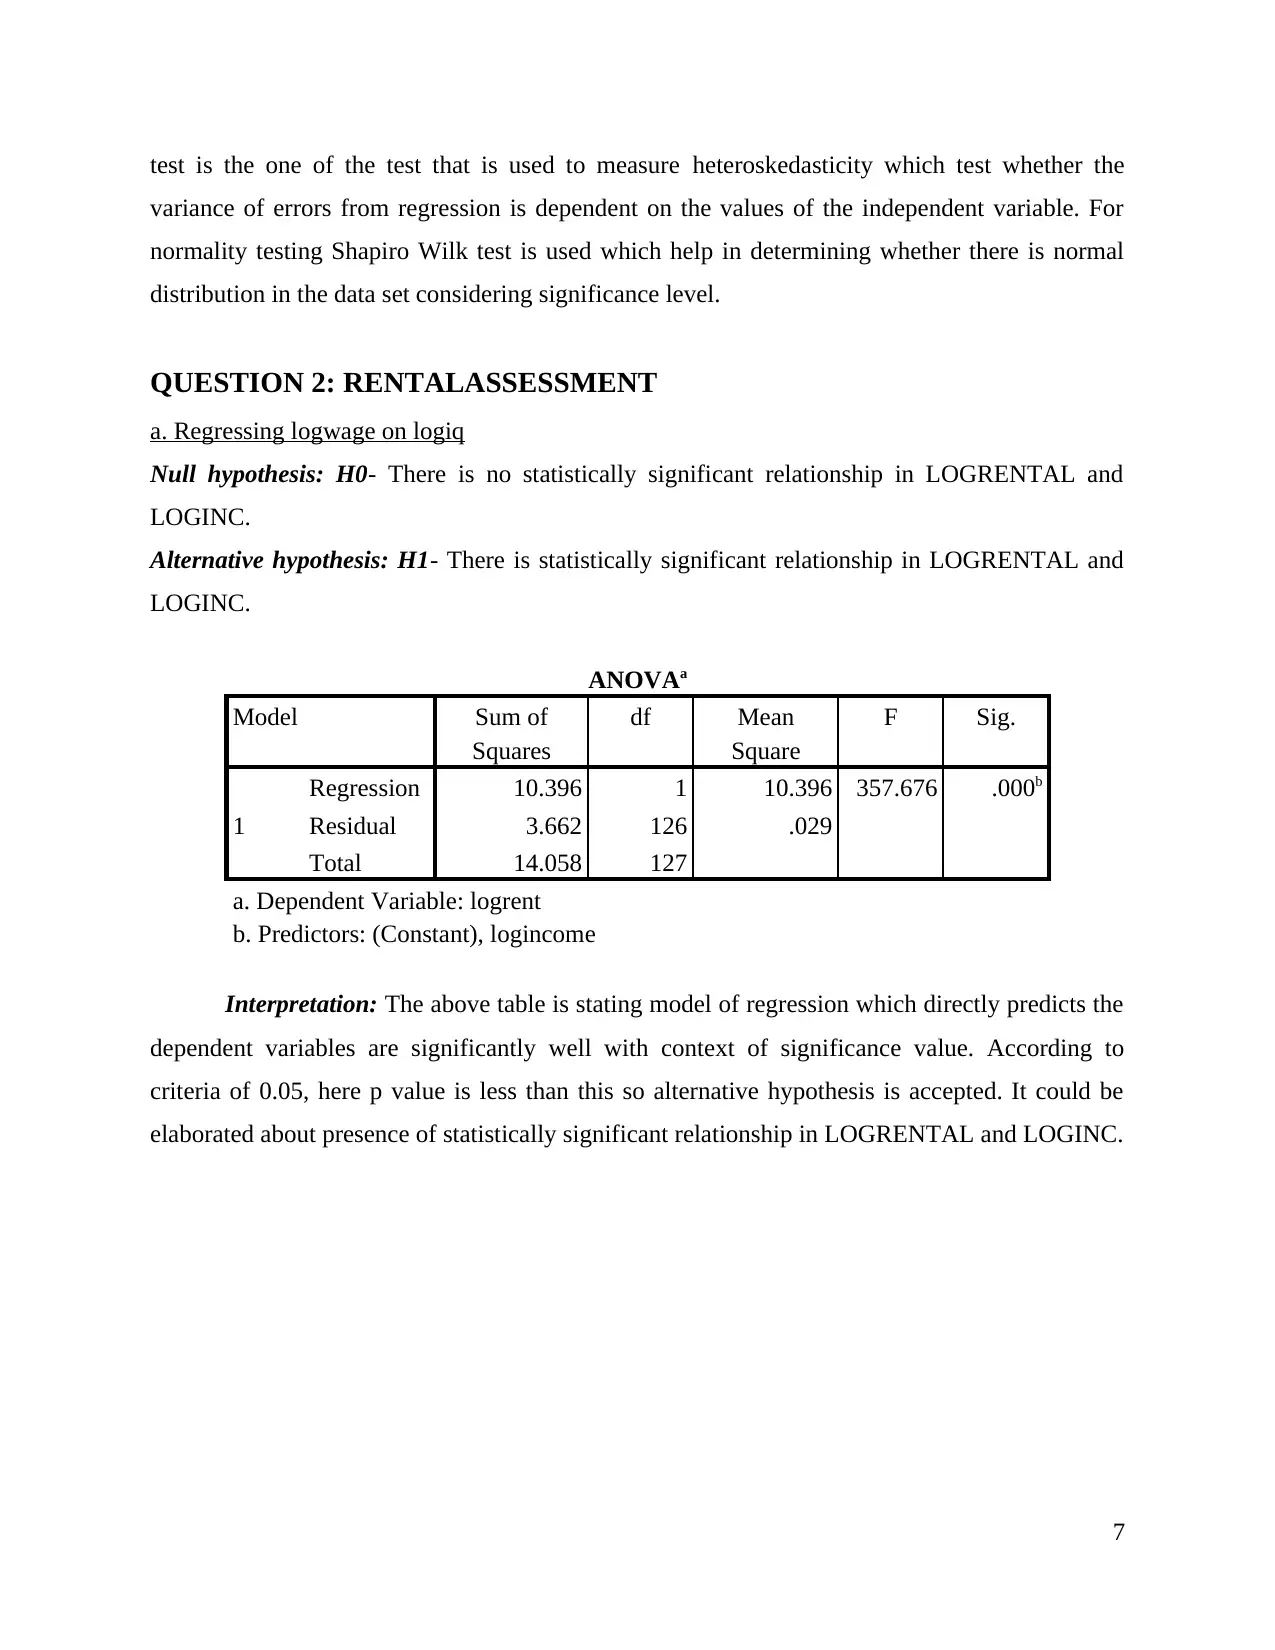
This econometrics assignment presents solutions to four key questions, focusing on regression analysis, hypothesis testing, and model specification. The first question examines the relationship between rental and income, heteroscedasticity, and the normality of residuals. The second question explores the relationship between log wage and log IQ. The third question analyzes exam success in relation to class hours and homework, including coefficient interpretation and hypothesis testing. The final question assesses market dynamics, specifically regressing log price and Friday, and evaluating consumer demand response. The assignment includes statistical outputs, interpretations, and model evaluations, providing a comprehensive analysis of economic relationships and data analysis techniques.
Document Page
ECONOMETRICS
tabler-icon-diamond-filled.svg

Paraphrase This Document

Need a fresh take? Get an instant paraphrase of this document with our AI Paraphraser
Document Page
TABLE OF CONTENTS
QUESTION 1: RENTALASSESSMENT.......................................................................................1
a. Regressing Rental and IC.............................................................................................................1
b. Exhibit heteroscedasticity.......................................................................................................2
c. Normal distribution of Rental and INC...................................................................................3
d. Residuals in model are normally distributed...........................................................................4
e. Model misspecification...........................................................................................................6
QUESTION 2: RENTALASSESSMENT.......................................................................................7
a. Regressing logwage on logiq..................................................................................................7
b. Exhibit heteroscedasticity.......................................................................................................8
c. Normally distributed of LOGRENTAL and LOGINC...........................................................9
d. Normally distributed of residuals.........................................................................................10
e. Model specification...............................................................................................................11
QUESTION 3: EXAM SUCCESS................................................................................................11
a. Regressing exam score on class hours along with estimating and interpreting coefficient. .11
b. Testing hypothesis that exam score is not related to home hours.........................................12
c. Regressing exam score on class hours and home work.........................................................12
d. Amount of variation in Exam score across students by home work and class hours............13
e. Estimate of coefficient is different in (a) and (c)..................................................................13
f. Advice to students to attend class and home work................................................................13
g. Variables must be included in regression..............................................................................14
QUESTION 4: MARKET ASSESSMENT...................................................................................14
a. Regressing Log price and Friday...........................................................................................14
b. Predicted values purports for represent.................................................................................14
c. Estimate response of consumer demand to change in log price............................................14
d. Is equation identified.............................................................................................................15
Document Page
QUESTION 1: RENTALASSESSMENT
a. Regressing Rental and IC
Null hypothesis: H0- There is no statistically significant relationship in Rental and IC.
Alternative hypothesis: H1- There is statistically significant relationship in Rental and IC.
ANOVAa
Model Sum of
Squares
df Mean
Square
F Sig.
1
Regression 1409857.177 1 1409857.177 437.086 .000b
Residual 406423.698 126 3225.585
Total 1816280.875 127
a. Dependent Variable: rent
b. Predictors: (Constant), income
Interpretation: The table is replicating regression model which forecast that dependent
variables are significantly well. In the above scenario, p value is less than 0.05 then null
hypothesis is rejected and statistically proved that there is significant relationship in rental and
IC.
1
Document Page
b. Exhibit heteroscedasticity
Interpretation: The above graph is reflected to trace heteroscedasticity as scatter plot of
the residuals which appeared under Normal Probability plot. The data is heteroscadicitic because
data points scattered in the chart.
2
tabler-icon-diamond-filled.svg

Paraphrase This Document

Need a fresh take? Get an instant paraphrase of this document with our AI Paraphraser
Document Page
c. Normal distribution of Rental and INC
There is bell shape curve in the chart and it is normally distributed.
.
3
Document Page
d. Residuals in model are normally distributed
The residuals abnormal distribution is interpreted with use of Q-Q plot, as distribution is
not normal because points are not clustered around horizontal line.
4
Document Page
5
tabler-icon-diamond-filled.svg

Paraphrase This Document

Need a fresh take? Get an instant paraphrase of this document with our AI Paraphraser
Document Page
There is absence of bell shape curve from the charts given above which are indicating that
data is not normally distributed.
e. Model misspecification
In the chart it can be seen that data points are closed to each other and moving upward from
left to right. Hence, it can be said that there is linear relationship between both. Breusch pagan
6
Document Page
test is the one of the test that is used to measure heteroskedasticity which test whether the
variance of errors from regression is dependent on the values of the independent variable. For
normality testing Shapiro Wilk test is used which help in determining whether there is normal
distribution in the data set considering significance level.
QUESTION 2: RENTALASSESSMENT
a. Regressing logwage on logiq
Null hypothesis: H0- There is no statistically significant relationship in LOGRENTAL and
LOGINC.
Alternative hypothesis: H1- There is statistically significant relationship in LOGRENTAL and
LOGINC.
ANOVAa
Model Sum of
Squares
df Mean
Square
F Sig.
1
Regression 10.396 1 10.396 357.676 .000b
Residual 3.662 126 .029
Total 14.058 127
a. Dependent Variable: logrent
b. Predictors: (Constant), logincome
Interpretation: The above table is stating model of regression which directly predicts the
dependent variables are significantly well with context of significance value. According to
criteria of 0.05, here p value is less than this so alternative hypothesis is accepted. It could be
elaborated about presence of statistically significant relationship in LOGRENTAL and LOGINC.
7
Document Page
b. Exhibit heteroscedasticity
Interpretation: The above graph is showing scatter plot of LOGRENTAL and LOGINC
of its residuals. It has been observed that data is heteroscadicitic because of data points scattered
in the chart. If line has been stated throughout the data, it would look like a cone.
8
tabler-icon-diamond-filled.svg

Paraphrase This Document

Need a fresh take? Get an instant paraphrase of this document with our AI Paraphraser
Document Page
c. Normally distributed of LOGRENTAL and LOGINC
Data is normally distributed as indicated by bell shape curve in the chart.
9
Document Page
d. Normally distributed of residuals
The residuals of model are normally distribution because they are in random pattern .
Hence, this fit for linear model.
10
chevron_up_icon
1 out of 18
circle_padding
hide_on_mobile
zoom_out_icon
[object Object]