Economic Analysis of Climate Change
VerifiedAdded on 2020/02/24
|12
|3986
|31
Essay
AI Summary
This essay analyzes the economic impacts of climate change, discussing its classification as a market failure and the necessity for policy interventions. It explores the relationship between economic growth and environmental resources, the implications of greenhouse gas emissions, and the importance of innovation in addressing climate challenges. The paper emphasizes the need for a balanced approach to consumption and environmental sustainability, highlighting the trade-offs involved in current and future economic decisions.
Part 1
Currently, there is little clarity regarding the costs and benefits of climate change to the world
economy. An economic analysis helps understand the impact of climate change on the economy
of any country and to make decisions regarding sacrificing present economic growth for long-
term benefits to the economy.
This paper helps provides an understanding on how climate change is a relevant economic
phenomenon since it represent a market failure. Additionally, it outlines how consumption in the
future and uncertainty regarding the consumption growth of future generations affects the
decision-making process of limiting emissions in the present time. It also provides a brief
understanding on how a national policy on climate is tied to it’s growth as well as to global
growth.
It is important to note that throughout the paper, it is assumed that economic growth (represented
by consumption) is dependent on availability of environmental resources which are limited.
Part 2
Climate change is often described as market failure. This is simply due to the fact that policy
intervention is required to correct the possible harmful effects of climate change. If countries had
to face the effects of climate change proportional to their emissions, then there would have been
a market driven response to the problem and countries would have acted to reduce their
emissions. However, given that climate change does not have isolated effects and there is no
natural mechanism to correct this problem and given that its negative effects are felt by the world
as one community, there must be social mechanisms or policy interventions to correct climate
change. (Stern, 2007) (Thomas, 2017)
Climate change is a result of the market not considering some social costs into valuation. Some
of these ‘non-valuations’ include: Some of the forms of market failure of climate change are:
The impact on climate due to warming caused by Green House Gas emissions. :
Non- Valuation of Clean Air, water etc. as economic goods
Subsidies on Fossil Fuels
Paraphrase This Document
Need a fresh take? Get an instant paraphrase of this document with our AI Paraphraser
(Stern, 2007)
The lack of any policy levers will lead to the failure of climate change adaptation and
innovations to reduce the social costs of climate change since policy levers drive the market to
pay for the social costs or impose checks (quotas) on the externalities of every economic activity.
In the absence of adaptation measures, effects of climate change such as floods, droughts etc.
would have serious impact on growth and GDP. The consequences of this market failure would
be felt on the society, specifically, the increased health care costs due to the effects of global
warming and lack of clean air, the amount of impact on more vulnerable communities, loss of
future growth due to diminishing availability of natural resources, disruptions caused in the
economy due to extreme temperatures etc. (Thomas, 2017)
Climate change is an example of market failure because pricing of economic activities do no take
into account the negative externalities to the environment. A ‘Negative externality’ or a
diseconomy is, mathematically, a (negative) deviation of “Marginal Private Cost” (MPC) from
the marginal social cost. According to Lipsey & Chrystal, (2011) “Private costs are those costs
that are incurred by parties that are involved directly in the Economic activity” and “Social costs
are those costs that are borne by the society” . Hence, the marginal private costs refers to the
private cost of the last producing the last unit produced or providing services to the last consumer
serviced. The ‘Marginal Social Cost’ is a valuation of the impact borne by the society in the
production of the last unit of good or services. Negative externalities decrease the social good i.e.
they have harmful effects or cause inconvenience to the public, in general. (Lipsey & Chrystal,
2011)
The following is a diagram of the negative externalities and the loss of social good resulting from
it. The Marginal Private Costs in the cost of mining coal from around the area. This cost does not
include the costs that society has to bear due to the mining. The Marginal social Cost includes
the valuation of losses resulting from the mining of coal in the area. The loss of social good is the
difference between the two. (Riley, 2005).
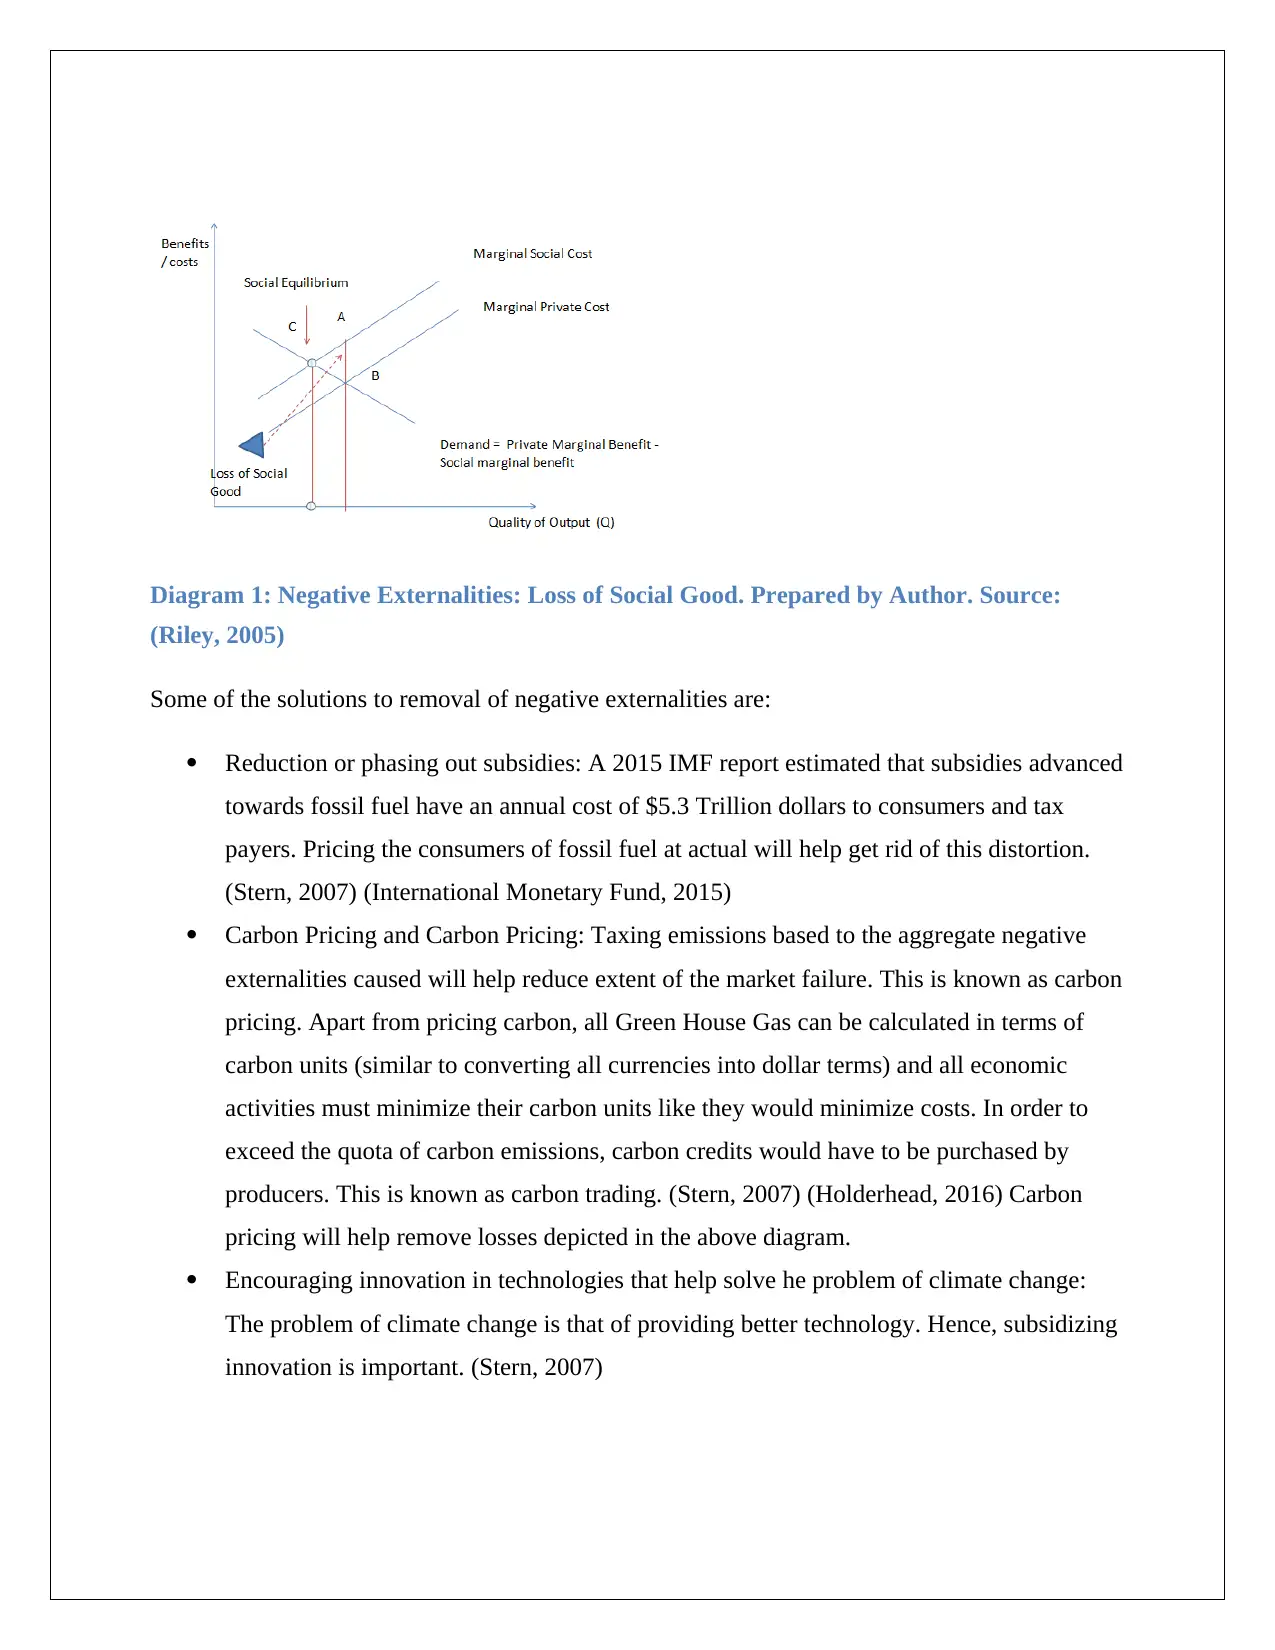
Diagram 1: Negative Externalities: Loss of Social Good. Prepared by Author. Source:
(Riley, 2005)
Some of the solutions to removal of negative externalities are:
Reduction or phasing out subsidies: A 2015 IMF report estimated that subsidies advanced
towards fossil fuel have an annual cost of $5.3 Trillion dollars to consumers and tax
payers. Pricing the consumers of fossil fuel at actual will help get rid of this distortion.
(Stern, 2007) (International Monetary Fund, 2015)
Carbon Pricing and Carbon Pricing: Taxing emissions based to the aggregate negative
externalities caused will help reduce extent of the market failure. This is known as carbon
pricing. Apart from pricing carbon, all Green House Gas can be calculated in terms of
carbon units (similar to converting all currencies into dollar terms) and all economic
activities must minimize their carbon units like they would minimize costs. In order to
exceed the quota of carbon emissions, carbon credits would have to be purchased by
producers. This is known as carbon trading. (Stern, 2007) (Holderhead, 2016) Carbon
pricing will help remove losses depicted in the above diagram.
Encouraging innovation in technologies that help solve he problem of climate change:
The problem of climate change is that of providing better technology. Hence, subsidizing
innovation is important. (Stern, 2007)
⊘ This is a preview!⊘
Do you want full access?
Subscribe today to unlock all pages.
Trusted by 1+ million students worldwide
Part 3
Arrow, in his analysis, treated the Green House Emissions resulting from economic activities as
an environmental good. If Green House Gas Emissions are goods, then the problems caused by
Greenhouse Gas Emissions then the social costs are the costs and the benefits of reducing GHG
emissions are the benefits.
According to Arrow “The benefits of reduced GHG emissions last for centuries, but mitigation
costs are borne today.” (Arrow K. J., 2007) This implies that investment in the benefits of
mitigation of greenhouse gases for the future must be borne and made by present generations.
However, for the ‘utility’ (assuming this to be the benefits of current economic growth) of today,
to be substituted for the utility of tomorrow, the benefits accrued from the GHG reductions must
be greater than the utility foregone today. This is akin to making savings in the present, in order
to ensure growth in the future (Frederick, 1999). Additionally Arrow Stated that “δ” is the rate at
which society (i.e., the social ‘planner’) discounts the utility of future generations i.e. the rate at
which the rate at which society would trade consumption in year t for consumption in the present
(measured by Net Present Value of Consumption.” (Arrow, et al., 2011) According to Arrow,
utility of consumption is similar to the “diminishing marginal utility” concept. Very simply put,
the more of consumption (total consumed in a society) that a generation has, the less social
benefit (utility) they may derive from it. In the diagram, the curve is concave to the origin
because this rate of returns gained from sacrificing consumption (i.e the rate at which present
gains are transformed in future gains) in present for the future consumption keeps diminishing.
In the context of a society, as consumption rises, its social benefits tend to diminish and the total
social value of consumption tends to have diminishing returns.
Paraphrase This Document
Need a fresh take? Get an instant paraphrase of this document with our AI Paraphraser
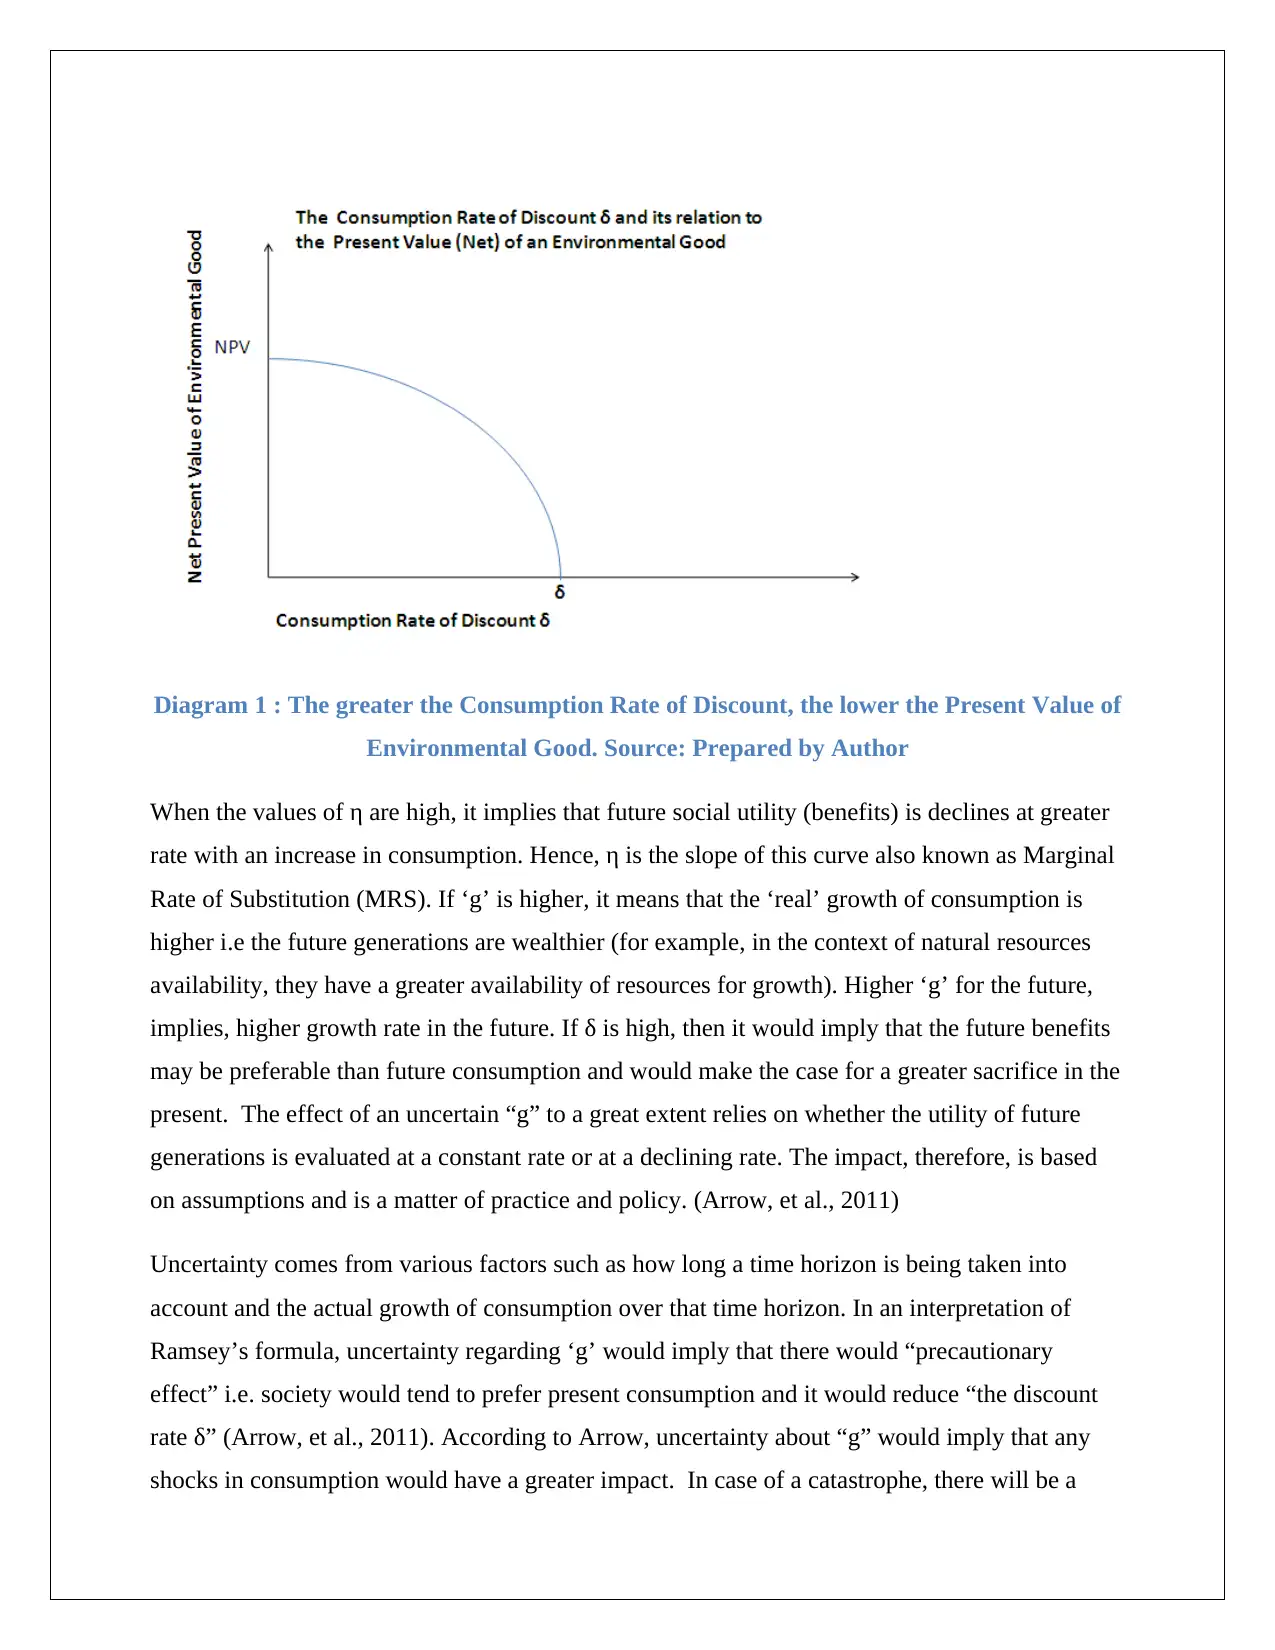
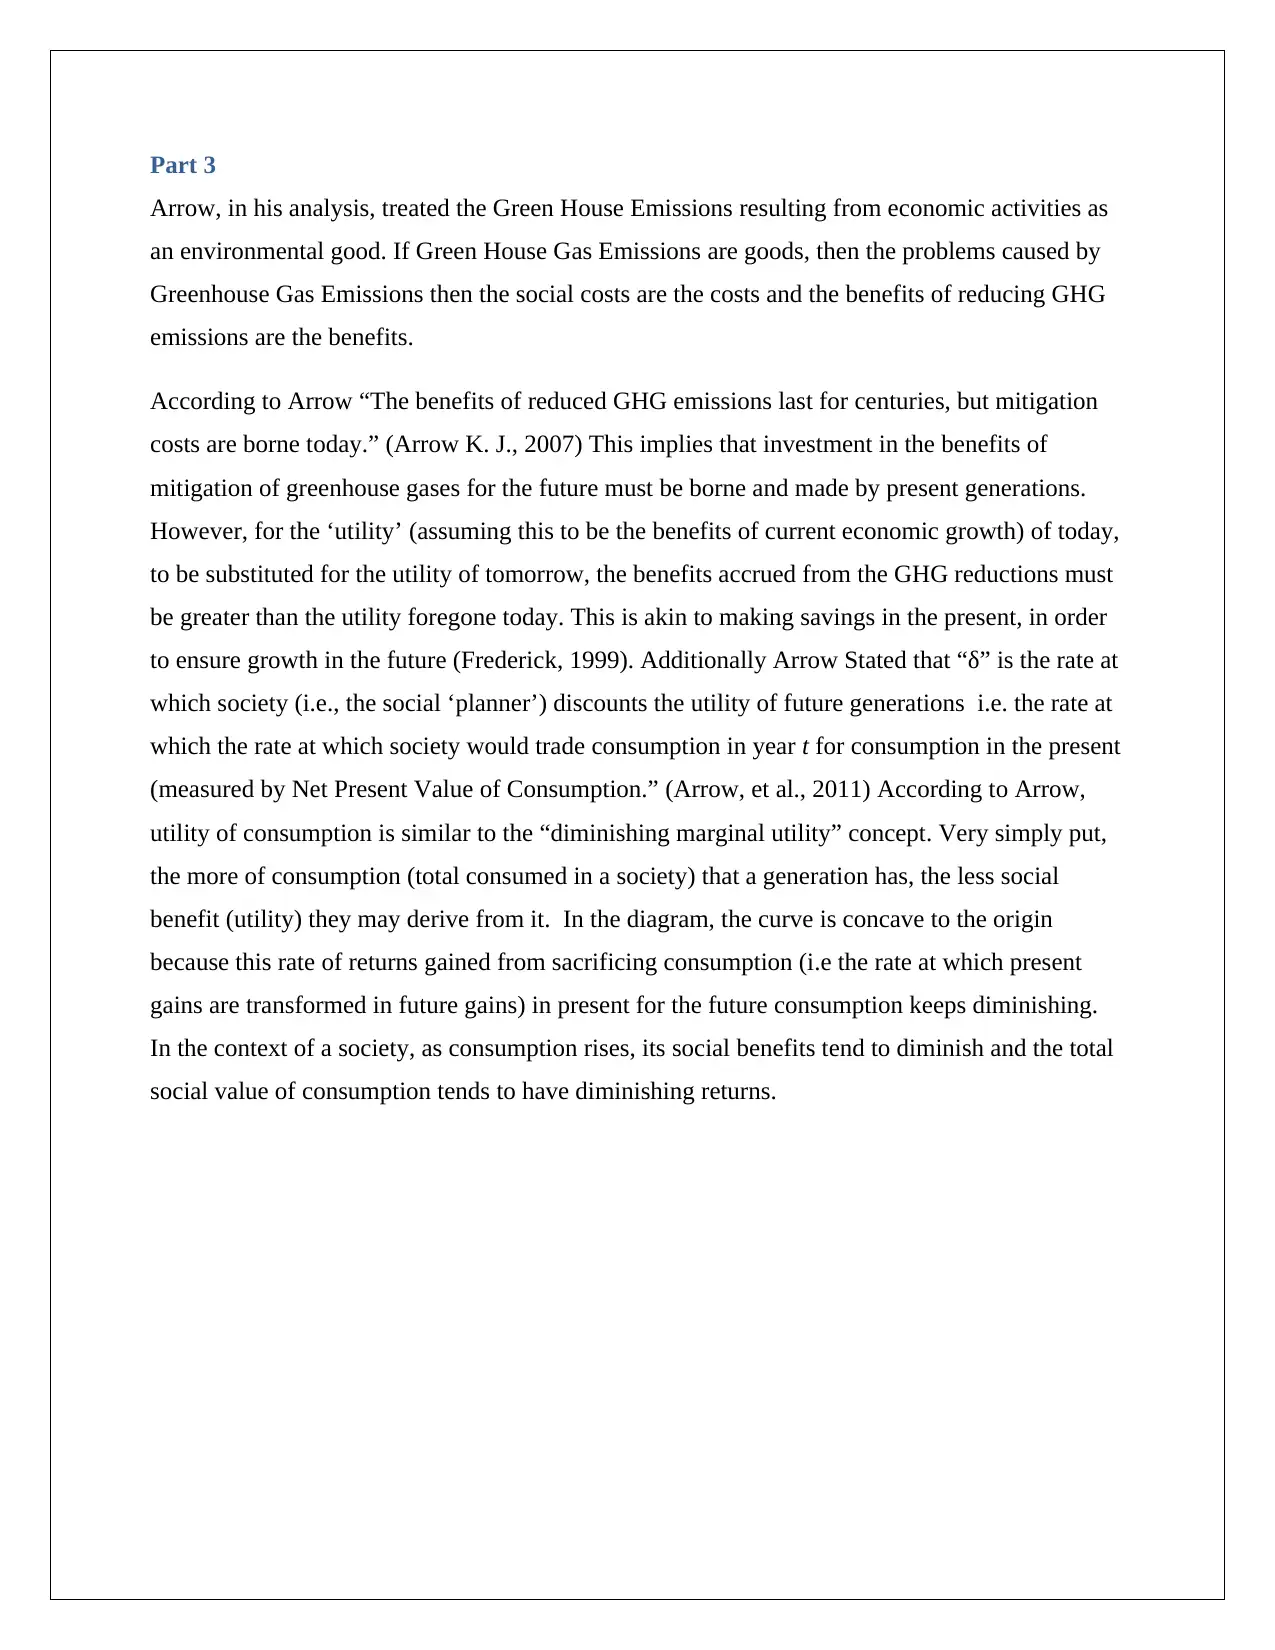
Diagram 1 : The greater the Consumption Rate of Discount, the lower the Present Value of
Environmental Good. Source: Prepared by Author
When the values of η are high, it implies that future social utility (benefits) is declines at greater
rate with an increase in consumption. Hence, η is the slope of this curve also known as Marginal
Rate of Substitution (MRS). If ‘g’ is higher, it means that the ‘real’ growth of consumption is
higher i.e the future generations are wealthier (for example, in the context of natural resources
availability, they have a greater availability of resources for growth). Higher ‘g’ for the future,
implies, higher growth rate in the future. If δ is high, then it would imply that the future benefits
may be preferable than future consumption and would make the case for a greater sacrifice in the
present. The effect of an uncertain “g” to a great extent relies on whether the utility of future
generations is evaluated at a constant rate or at a declining rate. The impact, therefore, is based
on assumptions and is a matter of practice and policy. (Arrow, et al., 2011)
Uncertainty comes from various factors such as how long a time horizon is being taken into
account and the actual growth of consumption over that time horizon. In an interpretation of
Ramsey’s formula, uncertainty regarding ‘g’ would imply that there would “precautionary
effect” i.e. society would tend to prefer present consumption and it would reduce “the discount
rate δ” (Arrow, et al., 2011). According to Arrow, uncertainty about “g” would imply that any
shocks in consumption would have a greater impact. In case of a catastrophe, there will be a
greater impact on “g”, if there is uncertainty. However, if the supply shock is positive, the effect
might be reversed i.e. if there are new renewable resources discovered that would help increase
the growth potential of the future consumption, then supply shocks are negatively correlated.
Hence, in order to maintain “g”, the society must take greater precautions. The certainty
equivalent discount rate will decline. The more uncertainty there is regarding ‘g’ the more will
the value of discount rate decline over a period of time.
Part 4
The article talks about the trade offs between giving up the benefits of giving up on fossil fuel
based electricity i.e. lower emissions versus the costs of giving up on consumption of fossil fuel
based electricity i.e. higher electricity prices in the present and it’s effect on growth. (Morton,
2017)
A decrease in the supply of fossil fuel in the current times due to coal power plants become
obsolete or due to the presence of moratoriums on gas production. This has led to an aggregate
reduction in electricity in supply of electricity from fossil fuels. (Morton, 2017)
This implies that the discount rate for future consumption i.e. δ is high and the availability of the
consumption utility for future generations of Australia is high. The saving rate of natural
resources is high in such a case. However, there must be an evaluation to understand whether the
benefits accrued from such heavy discount are worth the returns. Such a trade off can be
evaluated on various parameters. For example, growth in population could be one parameter.
Australia is expected to grow at a rate of 3% in 2018 while its population is expected to grow at
1.4 % per annum. (Roca, 2013) (Organization for Economic Co-operation and Development,
2017).The trade-off is to maintain the current consumption and maintaining a saving rate to
ensure optimal economic growth for the future population.
A slow down in the natural resources sector coal, gas etc. will drag the present economic growth
rate down. (Organization for Economic Co-operation and Development, 2017). However, the
population of Australia is also expected to grow. (Roca, 2013)Hence, consumption and
production of goods are expected to grow. This implies that the level of electricity generation
must cope up with the growth in demand for electricity due to increased growth rate, in the
⊘ This is a preview!⊘
Do you want full access?
Subscribe today to unlock all pages.
Trusted by 1+ million students worldwide
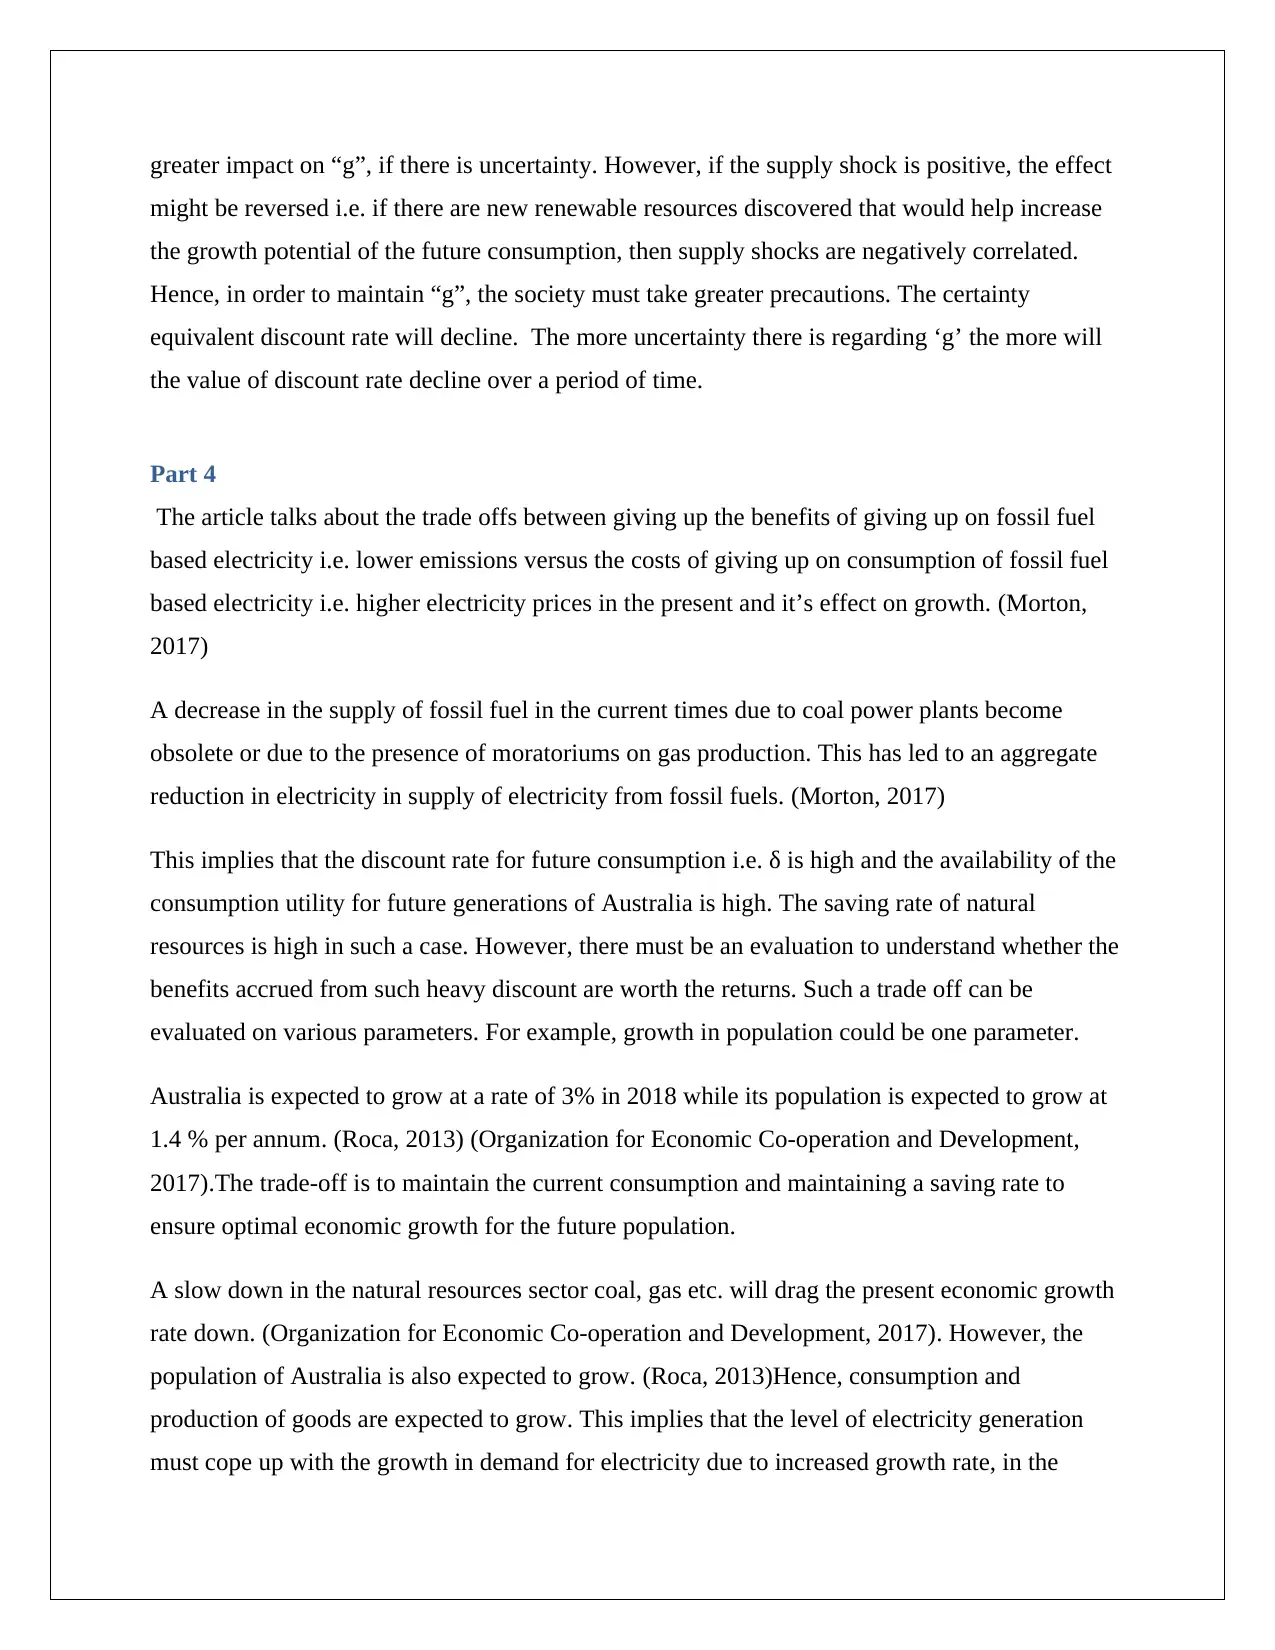
present. Hence, the present value of electricity consumption is high. This may diminish δ since
NPV of electricity is high.
Picture 1 Australia's Projected Electricity Emissions (Department of Environment and
Energy, Commonwealth of Australia , 2016)
The above diagram depicts that electricity related emissions in Australia are set to be lower
because of relatively flat demand for electricity in the country and decrease in intensity of
electricity production. (ACIL Allen Consulting, 2016) Hence, decreasing electricity related
emissions is not a priority . In this analysis, it is also important to take into consideration that the
population of Australia. The population of Australia is expected to be at 38.5 million. (Roca,
2013) However, the population of Australia is expected to grow at a diminishing rate which
means that the demand for electricity would grow at a diminishing rate. (Roca, 2013). If demand
for electricity follows the growth in population as well as growth in consumption, then the
demand for electricity ‘g’ would, also, grow and diminish later on. However, the negative
externalities of production of electricity are very large.
The shut down of coal plants presents an opportunity for policy intervention as there is an
opportunity to take decision on what kind of fuel would be used to generate electricity in the
Paraphrase This Document
Need a fresh take? Get an instant paraphrase of this document with our AI Paraphraser
future. The government could reduce the social cost of reducing the η component by creating
policies that would incentivize the production of ‘clean energy’.
According to the article, in spite of abolishing a carbon tax on the production of electricity, the
prices of electricity have increased. This suggests that demand for electricity has grown at a high
rate. To summarize, Australia would need to reduce electricity price, in order to maintain growth
in the near term. Hence, the government could increase the supply of fossil- fuel based electricity
by increasing the supply of gas-fired electricity plants. (Morton, 2017)The government could,
also, adopt an emission intensity based system for production of gas. (Morton, 2017) Emission
intensity based system caps the emissions allowed from every sector of economy and provides
disincentives to companies that do not follow the caps. According to the scheme, energy
producers that produce electricity with carbon emissions that are below the baseline could earn
‘credits’ which could be sold to other producers who produce electricity with emissions above
the baseline. It is a form of carbon trading. (Holderhead, 2016)
Part 5
In Arrow’s formula p is the term that denotes time preference. According to Arrow, “at any
given point of time ρ, equals the sum of the utility rate of discount (δ) and the rate of growth in
consumption between t and the present (g) weighted by (minus) the elasticity of marginal utility
of consumption (η)”. This simply means that how much present consumption growth to
consumption would be preferred to consumption in the later generations.
In case of a non-ratification of the Paris Climate Change Agreement, the policy simply implies
that the administration considers the present benefits to be greater than the future benefits.
However, it must be added that ‘p’ adds to the impact of growth but does not affect the
sensitivity of the future growth of consumption or the “elasticity of the social benefit of
consumption.”
In mathematical analysis, a lower ‘p’ would have an effect of lowering the ‘δ’ component. In
order to maintain equilibrium, either the “gη” component would have to be higher or the ‘δ’
component would have to be lower. In the diagram below, curves P1 and P2 represent the
preference combination or how much is present consumption preferred to future consumption.
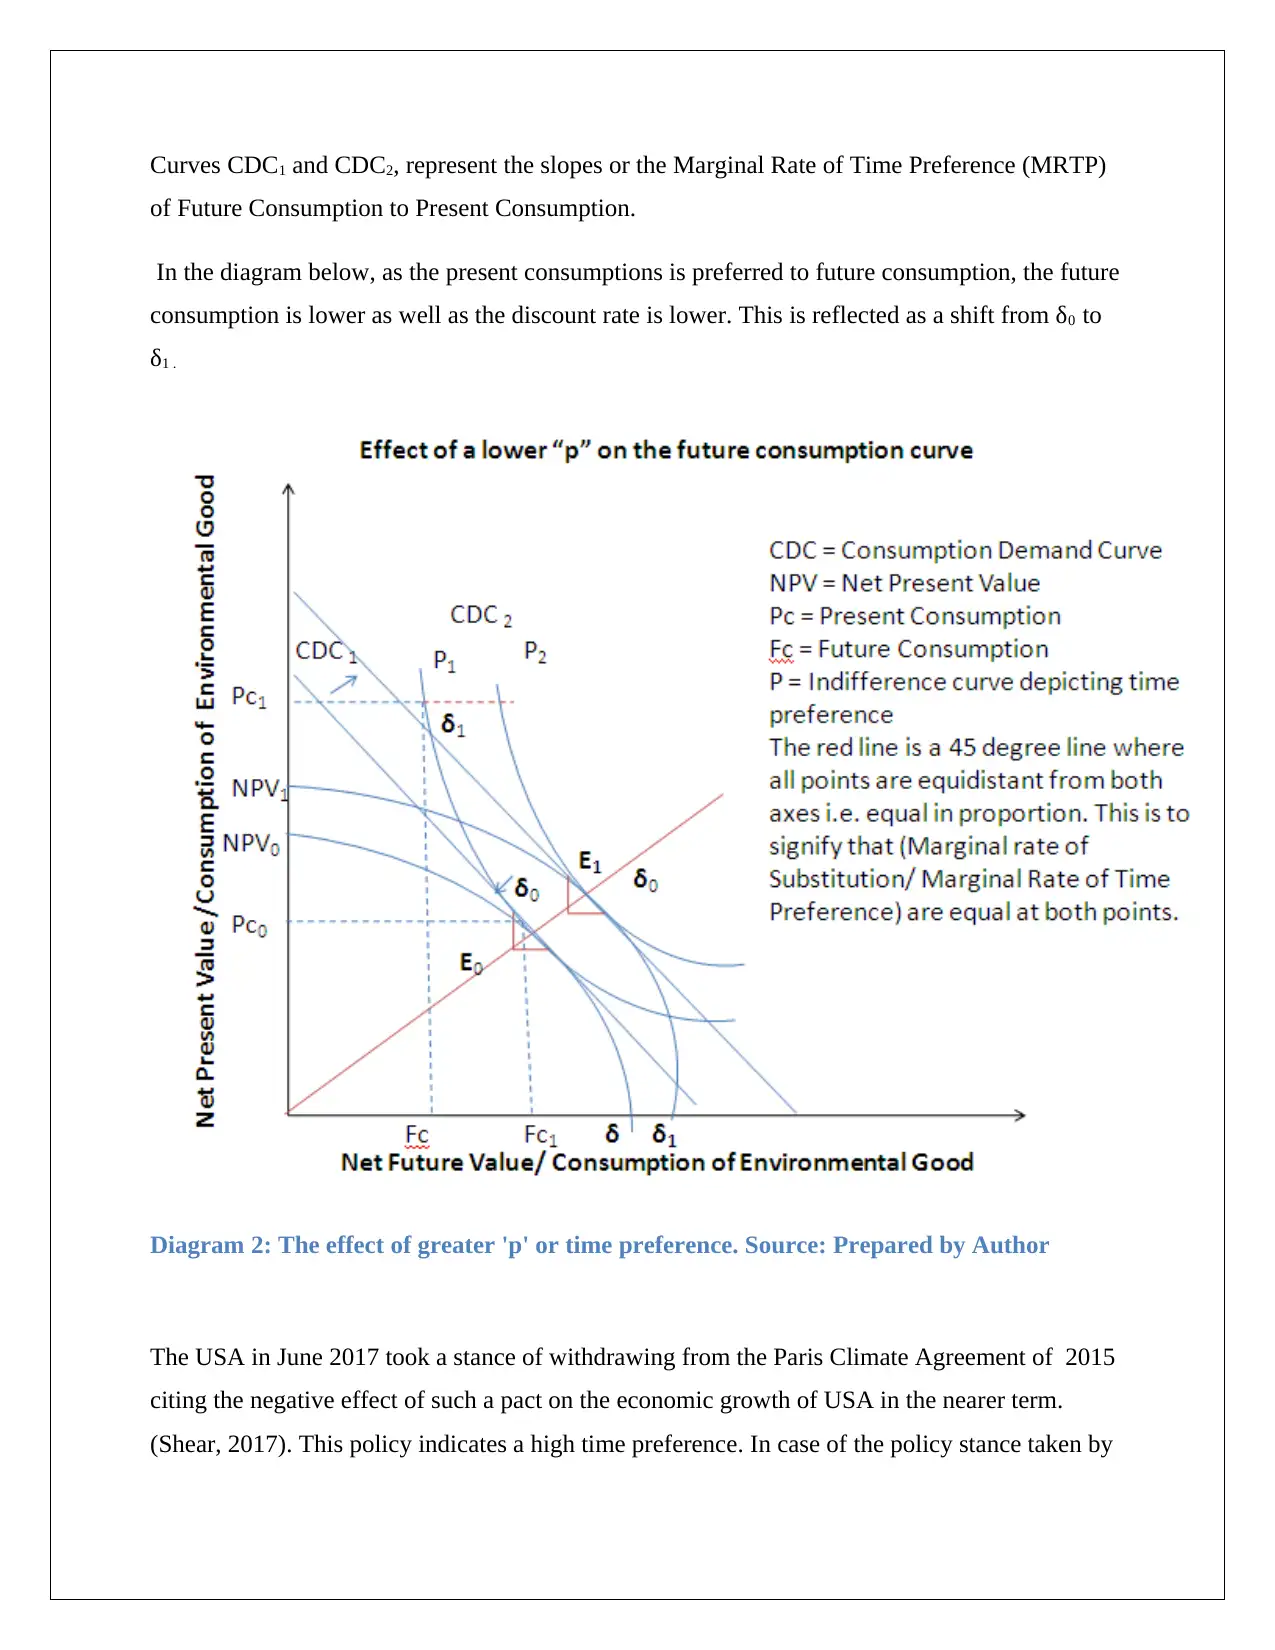
Curves CDC1 and CDC2, represent the slopes or the Marginal Rate of Time Preference (MRTP)
of Future Consumption to Present Consumption.
In the diagram below, as the present consumptions is preferred to future consumption, the future
consumption is lower as well as the discount rate is lower. This is reflected as a shift from δ0 to
δ1 .
Diagram 2: The effect of greater 'p' or time preference. Source: Prepared by Author
The USA in June 2017 took a stance of withdrawing from the Paris Climate Agreement of 2015
citing the negative effect of such a pact on the economic growth of USA in the nearer term.
(Shear, 2017). This policy indicates a high time preference. In case of the policy stance taken by
⊘ This is a preview!⊘
Do you want full access?
Subscribe today to unlock all pages.
Trusted by 1+ million students worldwide
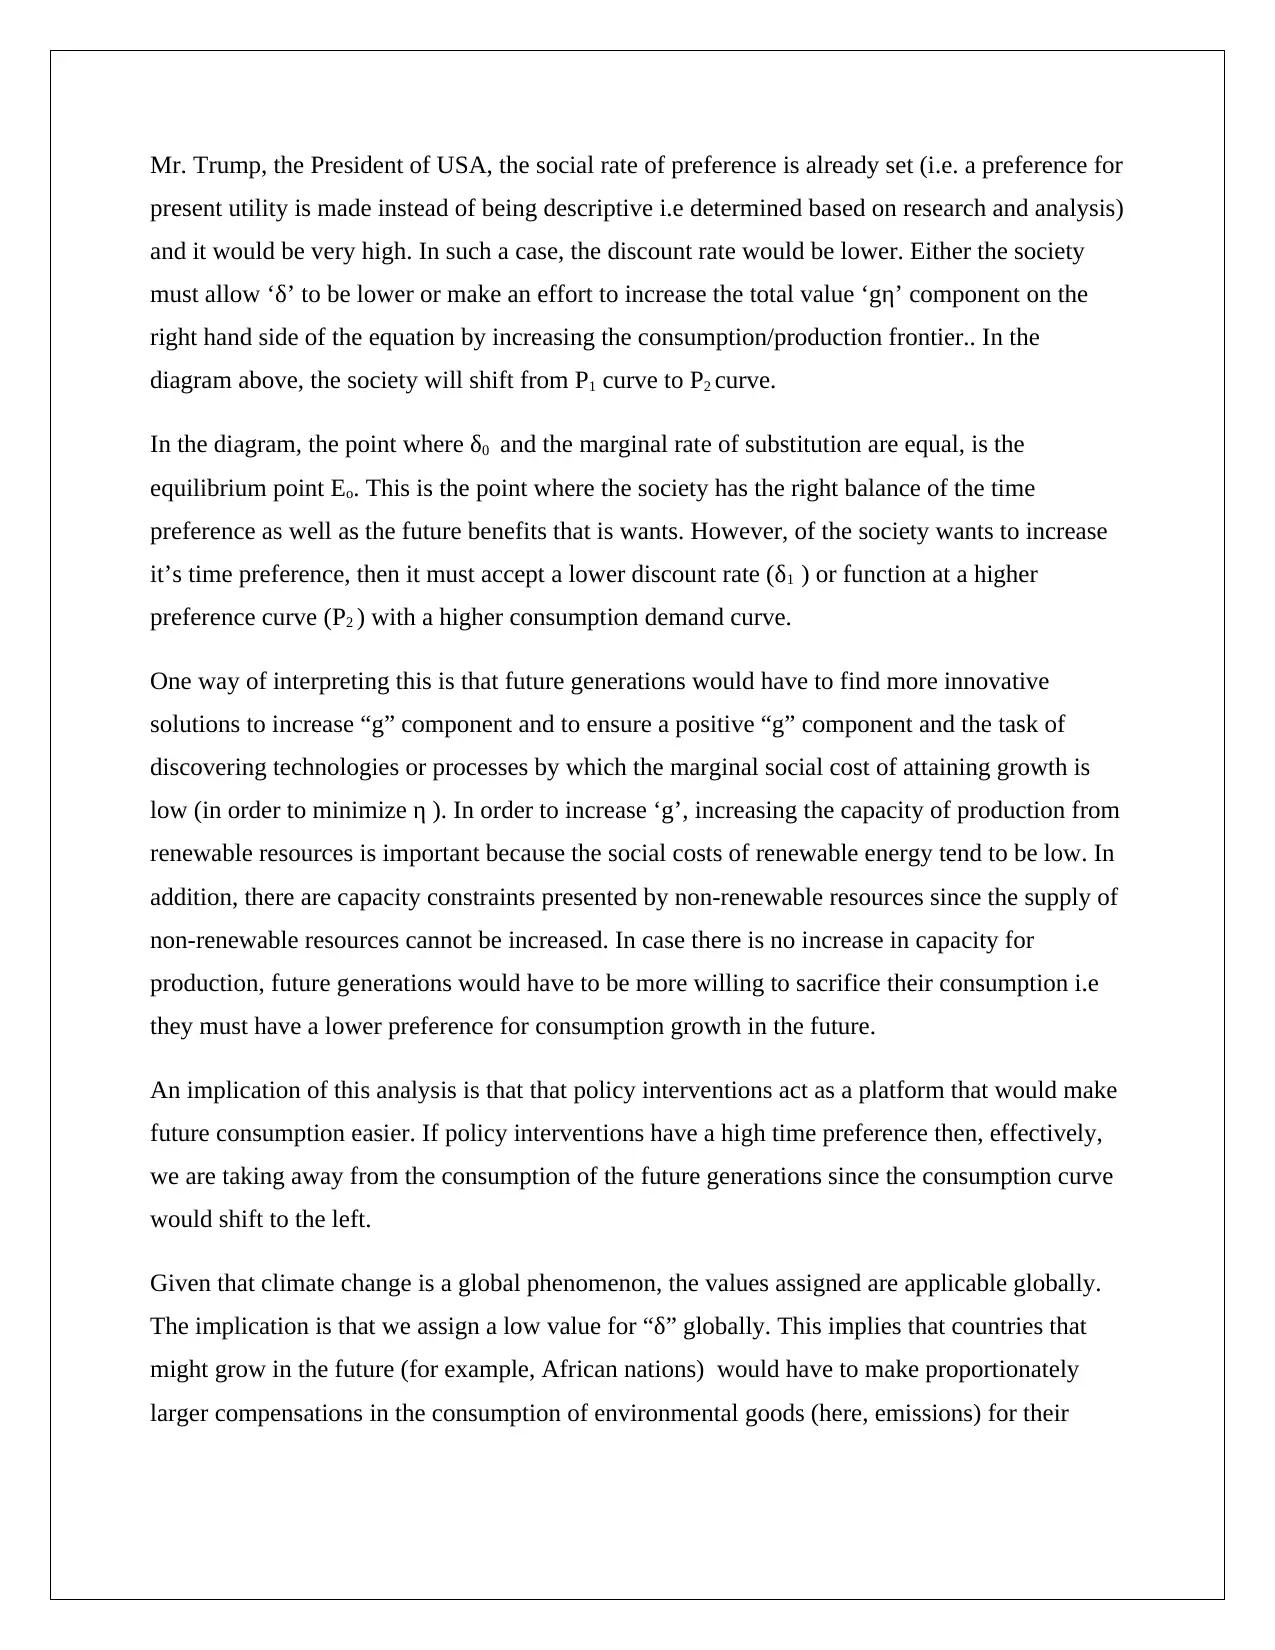
Mr. Trump, the President of USA, the social rate of preference is already set (i.e. a preference for
present utility is made instead of being descriptive i.e determined based on research and analysis)
and it would be very high. In such a case, the discount rate would be lower. Either the society
must allow ‘δ’ to be lower or make an effort to increase the total value ‘gη’ component on the
right hand side of the equation by increasing the consumption/production frontier.. In the
diagram above, the society will shift from P1 curve to P2 curve.
In the diagram, the point where δ0 and the marginal rate of substitution are equal, is the
equilibrium point Eo. This is the point where the society has the right balance of the time
preference as well as the future benefits that is wants. However, of the society wants to increase
it’s time preference, then it must accept a lower discount rate (δ1 ) or function at a higher
preference curve (P2 ) with a higher consumption demand curve.
One way of interpreting this is that future generations would have to find more innovative
solutions to increase “g” component and to ensure a positive “g” component and the task of
discovering technologies or processes by which the marginal social cost of attaining growth is
low (in order to minimize η ). In order to increase ‘g’, increasing the capacity of production from
renewable resources is important because the social costs of renewable energy tend to be low. In
addition, there are capacity constraints presented by non-renewable resources since the supply of
non-renewable resources cannot be increased. In case there is no increase in capacity for
production, future generations would have to be more willing to sacrifice their consumption i.e
they must have a lower preference for consumption growth in the future.
An implication of this analysis is that that policy interventions act as a platform that would make
future consumption easier. If policy interventions have a high time preference then, effectively,
we are taking away from the consumption of the future generations since the consumption curve
would shift to the left.
Given that climate change is a global phenomenon, the values assigned are applicable globally.
The implication is that we assign a low value for “δ” globally. This implies that countries that
might grow in the future (for example, African nations) would have to make proportionately
larger compensations in the consumption of environmental goods (here, emissions) for their
Paraphrase This Document
Need a fresh take? Get an instant paraphrase of this document with our AI Paraphraser
economic growth as compared to countries like USA, that are responsible for more emissions in
the current scenario.
Bibliography
ACIL Allen Consulting. (2016). Electricity emissions modelling for Australia’s emissions projections.
Brisbane: ACIL Allen.
Arrow, K. J. (2007, June). Global Climate Change:A Challenge to Policy. Economists' Voice .
Arrow, K. J., Cropper, M. L., Gollier, C., Groom, B., Heal, G. M., Newell, R. G., et al. (2011). How Should
Benefits and Costs Be Discounted in an Intergenerational Context? The Views of an Expert Panel.
Washington, DC: US Environmental Protection Agency.
Department of Environment and Energy, Commonwealth of Australia . (2016). Australia’s emissions
projections 2016. Australia: Commonwealth of Australia .
Frederick, S. (1999). Discounting, Time Preference, and Identity. USA: Department of Social and Decision
Sciences, Carnegie Mellon University.
Holderhead, S. (2016, December 5). Energy Intensity Scheme - instead of Carbon Tax pushed for
Australia's Struggling Electricity Market. Retrieved August 31, 2017, from The Advertiser:
www.adelaidenow.au
International Monetary Fund. (2015). IMF Survey: Counting the Cost of Energy Subsidies. Paris:
International Monetary Fund.
Lipsey, R., & Chrystal, A. (2011). Economics. Oxford: Oxford University Press.
Morton, A. (2017, March 08). Energy crisis: Wholesale power prices have doubled since the carbon tax
was axed. Retrieved August 31, 2017, from The Sydney Morning HEral:
http://www.smh.com.au/federal-politics/political-news/energy-crisis-wholesale-power-prices-have-
doubled-sice-the-carbon-tax-was-axed-20170308-gutf8t.html
Organization for Economic Co-operation and Development. (2017). Going for Growth : Australia. OECD.
Riley, G. (2005). European Economy in Focus. BerkShire (UK) : Tutor 2 u online.
Roca, F. (2013, November 27). Australia's Population Set to Double to 46 Million by 2075, Australian
Bureau of Statistic Projections Set to Slow. Retrieved August 31, 2017, from ABC News:
www.abc.net.au/news/2013-11-27/australia's-population-set-to-double-by-2075/511775

Shear, M. D. (2017, June 1). Trump Will Withdraw U.S. From Paris Climate Agreement. Retrieved August
21, 2017, from The New York Times: https//nytimes.com/2017/06/01/climate/trump-plparis-climate-
agreement.html
Stern, S. N. (2007, November 29). Stern: Climate Change A 'MArket Failure'. (A. Benjamin, Interviewer)
Thomas, V. (2017, July 12). The Danger of Dismissing Market Failures. Retrieved August 30, 2017, from
Brookings Insitute: htttp/www.brookings.edu/the-danger-of-dismissing-market-failure
⊘ This is a preview!⊘
Do you want full access?
Subscribe today to unlock all pages.
Trusted by 1+ million students worldwide
1 out of 12
Related Documents
![[Year] ABC Company: Market Failure and Environment in Economic Context](/_next/image/?url=https%3A%2F%2Fdesklib.com%2Fmedia%2Fimages%2F658e5453c376427285461096c079d2b6.jpg&w=256&q=75)


Your All-in-One AI-Powered Toolkit for Academic Success.
+13062052269
info@desklib.com
Available 24*7 on WhatsApp / Email
![[object Object]](/_next/static/media/star-bottom.7253800d.svg)
Unlock your academic potential
Copyright © 2020–2026 A2Z Services. All Rights Reserved. Developed and managed by ZUCOL.