Detailed Analysis: The Far-Reaching Economic Impact of COVID-19
VerifiedAdded on 2023/06/12
|5
|881
|217
Report
AI Summary
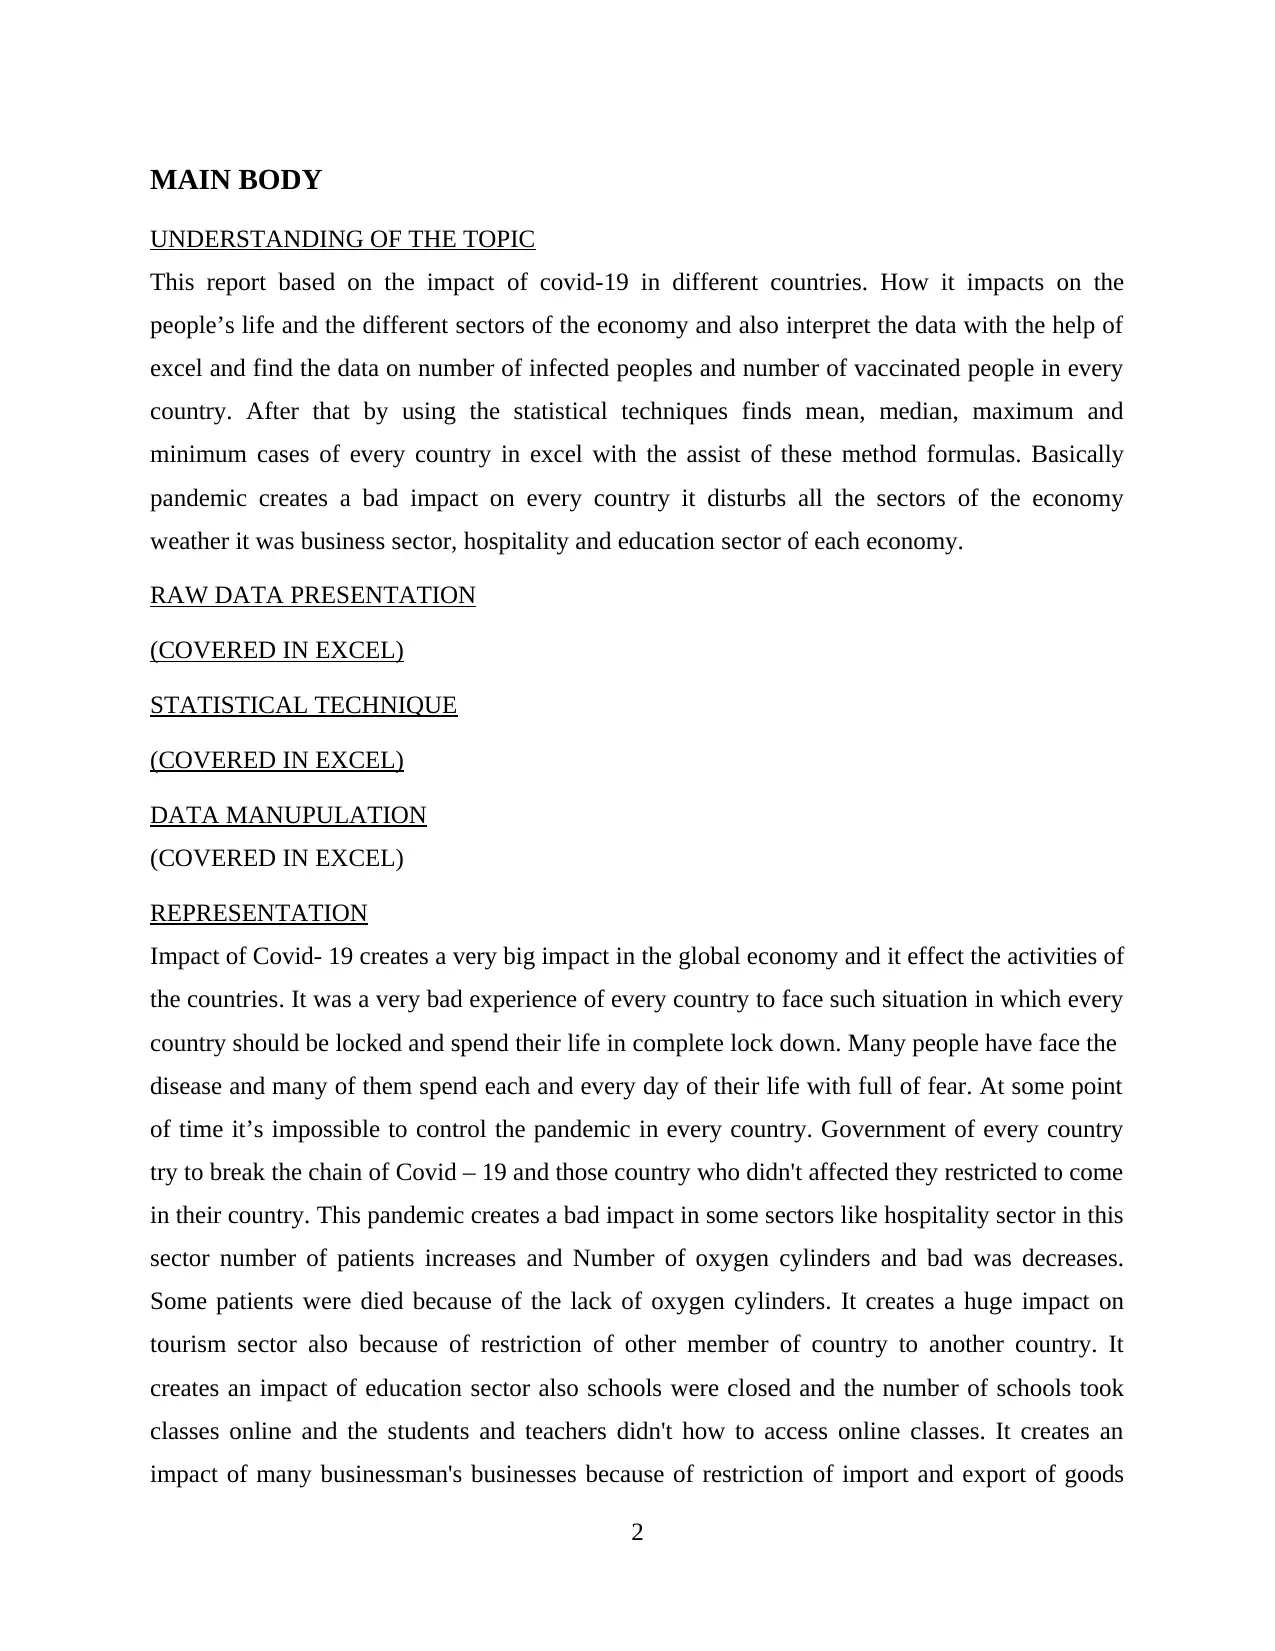
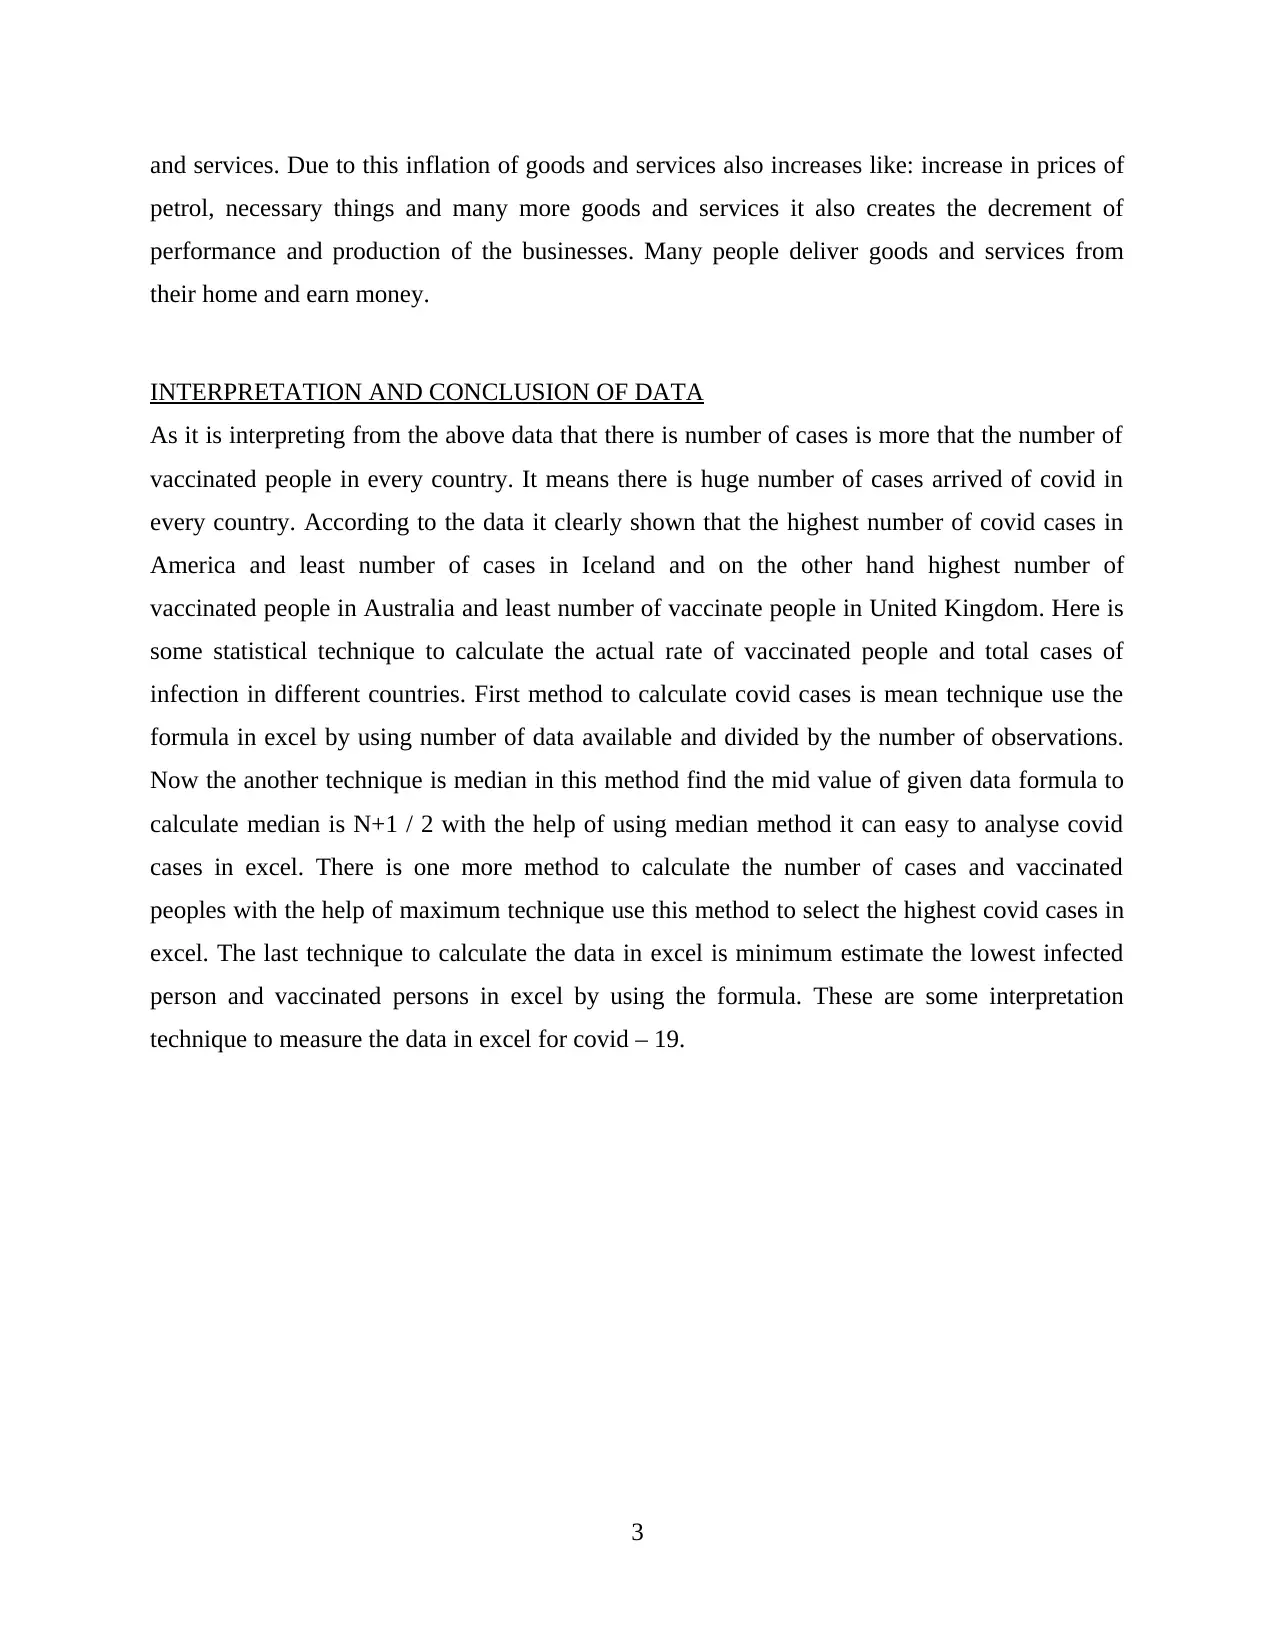
This report examines the economic impact of the COVID-19 pandemic across different countries, focusing on its effects on various sectors and people's lives. It uses statistical techniques applied in Excel to analyze data related to infection and vaccination rates. The report interprets this data to highlight the pandemic's impact on sectors such as business, hospitality, and education, noting the challenges faced, including shortages of essential resources and disruptions to international trade. The analysis concludes that while vaccination efforts are underway, the number of infections remains significant, and the report uses methods like mean, median, maximum, and minimum calculations to provide a comprehensive understanding of the pandemic's statistical footprint.

A1 – MS EXCEL
TASK
TASK
Paraphrase This Document
Need a fresh take? Get an instant paraphrase of this document with our AI Paraphraser

Contents
MAIN BODY...................................................................................................................................1
UNDERSTANDING OF THE TOPIC..................................................................................1
RAW DATA PRESENTATION............................................................................................1
(COVERED IN EXCEL).......................................................................................................1
STATISTICAL TECHNIQUE...............................................................................................1
(COVERED IN EXCEL).......................................................................................................1
DATA MANUPULATION....................................................................................................1
REPRESENTATION.............................................................................................................1
INTERPRETATION AND CONCLUSION OF DATA.......................................................2
REFERENCES................................................................................................................................3
1

MAIN BODY
UNDERSTANDING OF THE TOPIC
This report based on the impact of covid-19 in different countries. How it impacts on the
people’s life and the different sectors of the economy and also interpret the data with the help of
excel and find the data on number of infected peoples and number of vaccinated people in every
country. After that by using the statistical techniques finds mean, median, maximum and
minimum cases of every country in excel with the assist of these method formulas. Basically
pandemic creates a bad impact on every country it disturbs all the sectors of the economy
weather it was business sector, hospitality and education sector of each economy.
RAW DATA PRESENTATION
(COVERED IN EXCEL)
STATISTICAL TECHNIQUE
(COVERED IN EXCEL)
DATA MANUPULATION
(COVERED IN EXCEL)
REPRESENTATION
Impact of Covid- 19 creates a very big impact in the global economy and it effect the activities of
the countries. It was a very bad experience of every country to face such situation in which every
country should be locked and spend their life in complete lock down. Many people have face the
disease and many of them spend each and every day of their life with full of fear. At some point
of time it’s impossible to control the pandemic in every country. Government of every country
try to break the chain of Covid – 19 and those country who didn't affected they restricted to come
in their country. This pandemic creates a bad impact in some sectors like hospitality sector in this
sector number of patients increases and Number of oxygen cylinders and bad was decreases.
Some patients were died because of the lack of oxygen cylinders. It creates a huge impact on
tourism sector also because of restriction of other member of country to another country. It
creates an impact of education sector also schools were closed and the number of schools took
classes online and the students and teachers didn't how to access online classes. It creates an
impact of many businessman's businesses because of restriction of import and export of goods
2
⊘ This is a preview!⊘
Do you want full access?
Subscribe today to unlock all pages.

Trusted by 1+ million students worldwide

and services. Due to this inflation of goods and services also increases like: increase in prices of
petrol, necessary things and many more goods and services it also creates the decrement of
performance and production of the businesses. Many people deliver goods and services from
their home and earn money.
INTERPRETATION AND CONCLUSION OF DATA
As it is interpreting from the above data that there is number of cases is more that the number of
vaccinated people in every country. It means there is huge number of cases arrived of covid in
every country. According to the data it clearly shown that the highest number of covid cases in
America and least number of cases in Iceland and on the other hand highest number of
vaccinated people in Australia and least number of vaccinate people in United Kingdom. Here is
some statistical technique to calculate the actual rate of vaccinated people and total cases of
infection in different countries. First method to calculate covid cases is mean technique use the
formula in excel by using number of data available and divided by the number of observations.
Now the another technique is median in this method find the mid value of given data formula to
calculate median is N+1 / 2 with the help of using median method it can easy to analyse covid
cases in excel. There is one more method to calculate the number of cases and vaccinated
peoples with the help of maximum technique use this method to select the highest covid cases in
excel. The last technique to calculate the data in excel is minimum estimate the lowest infected
person and vaccinated persons in excel by using the formula. These are some interpretation
technique to measure the data in excel for covid – 19.
3
Paraphrase This Document
Need a fresh take? Get an instant paraphrase of this document with our AI Paraphraser

REFERENCES
Books and Journals
Covid, C.D.C., 2021. Response TeamFood and Drug Administration. Allergic reactions
including anaphylaxis after receipt of the first dose of Pfizer-BioNTech COVID-19
vaccine—United States, December 14–23, 2020.70(2), pp.46-51.
Manalo, I.F., Smith, M.K., Cheeley, J. and Jacobs, R., 2020. A dermatologic manifestation of
COVID-19: transient livedo reticularis. Journal of the American Academy of
Dermatology. 83(2), p.700.
Sun, M.L. And et.al., 2020. Inhibitors of RAS might be a good choice for the therapy of
COVID-19 pneumonia. 43. pp. E014-E014.
Brugliera, L. and et.al., 2020. Rehabilitation of COVID-19 patients. Journal of rehabilitation
medicine, pp.1-1.
4
1 out of 5
Related Documents
Your All-in-One AI-Powered Toolkit for Academic Success.
+13062052269
info@desklib.com
Available 24*7 on WhatsApp / Email
Unlock your academic potential
Copyright © 2020–2026 A2Z Services. All Rights Reserved. Developed and managed by ZUCOL.


