Economic Development Analysis: Solow Model and Nutrition Study

Verified

Added on  2022/09/11

|9
|1977
|16
Homework Assignment
AI Summary
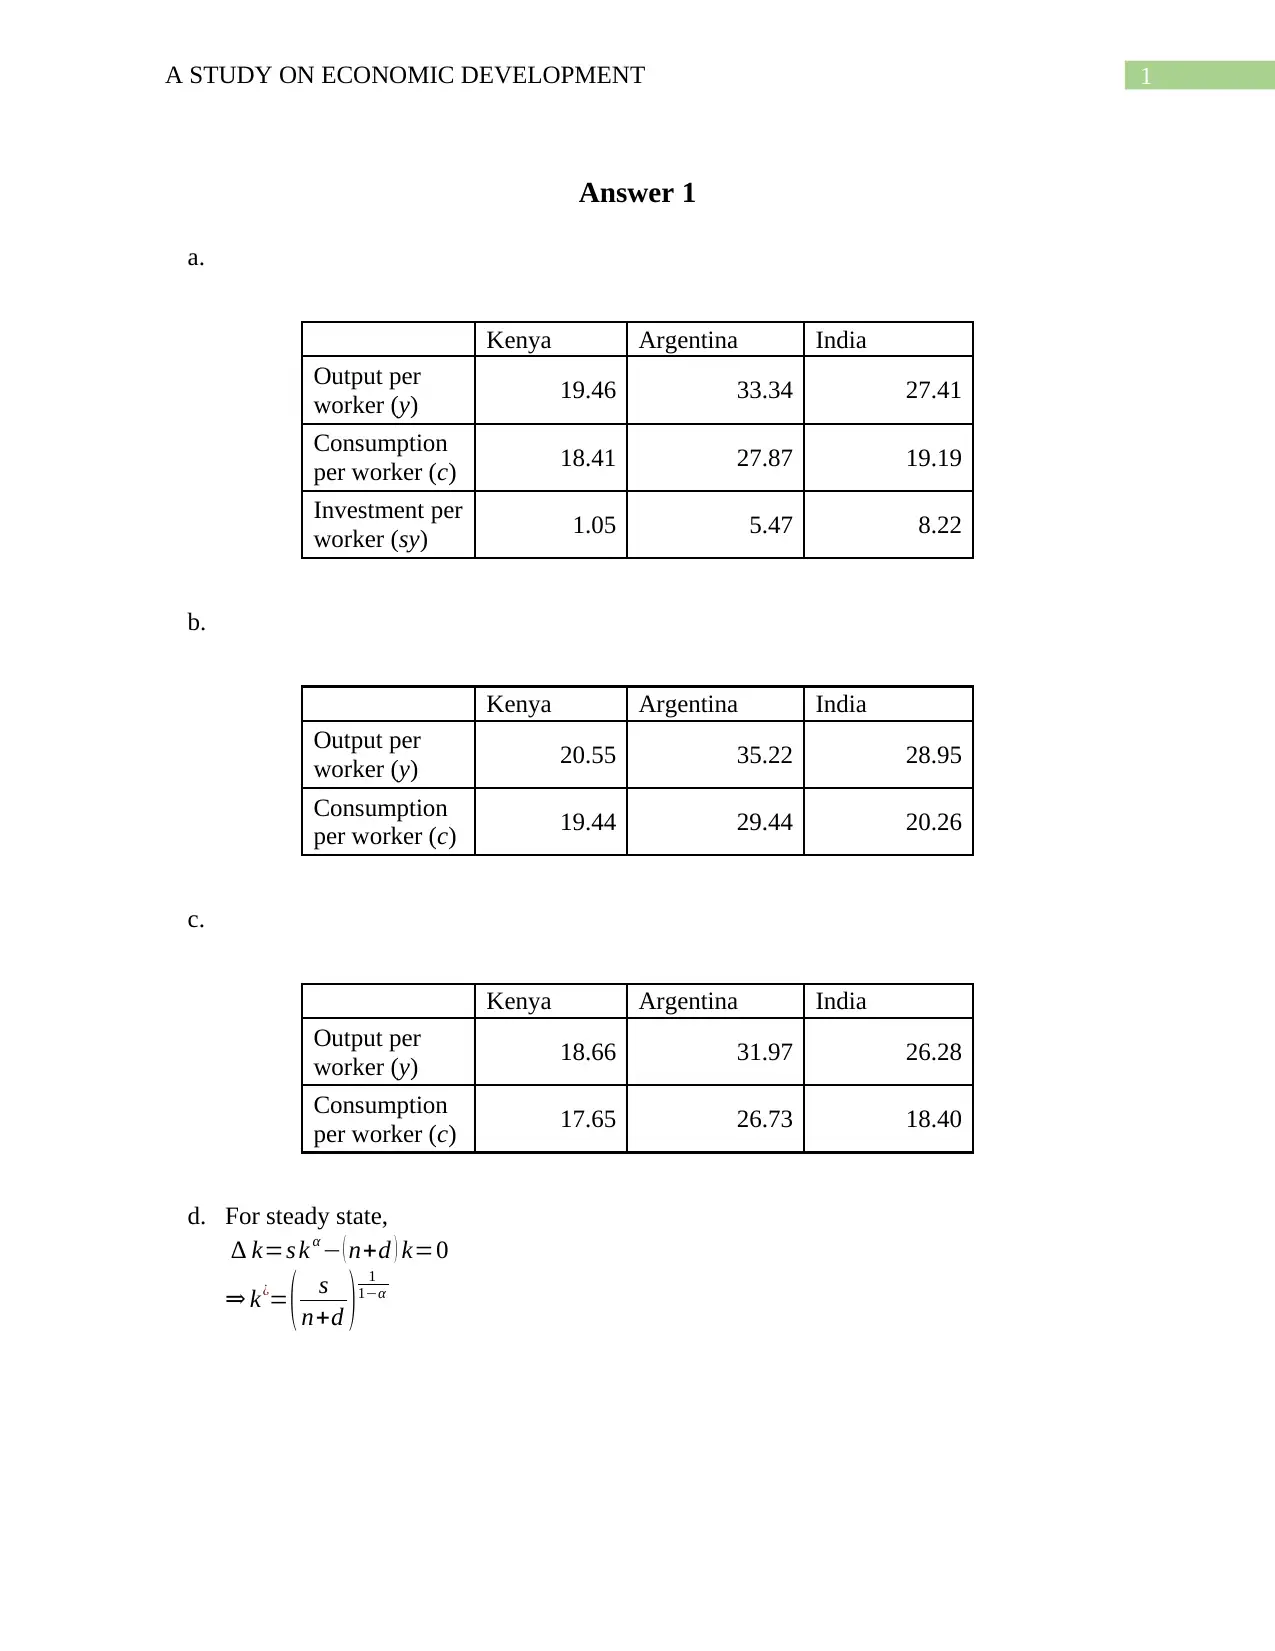
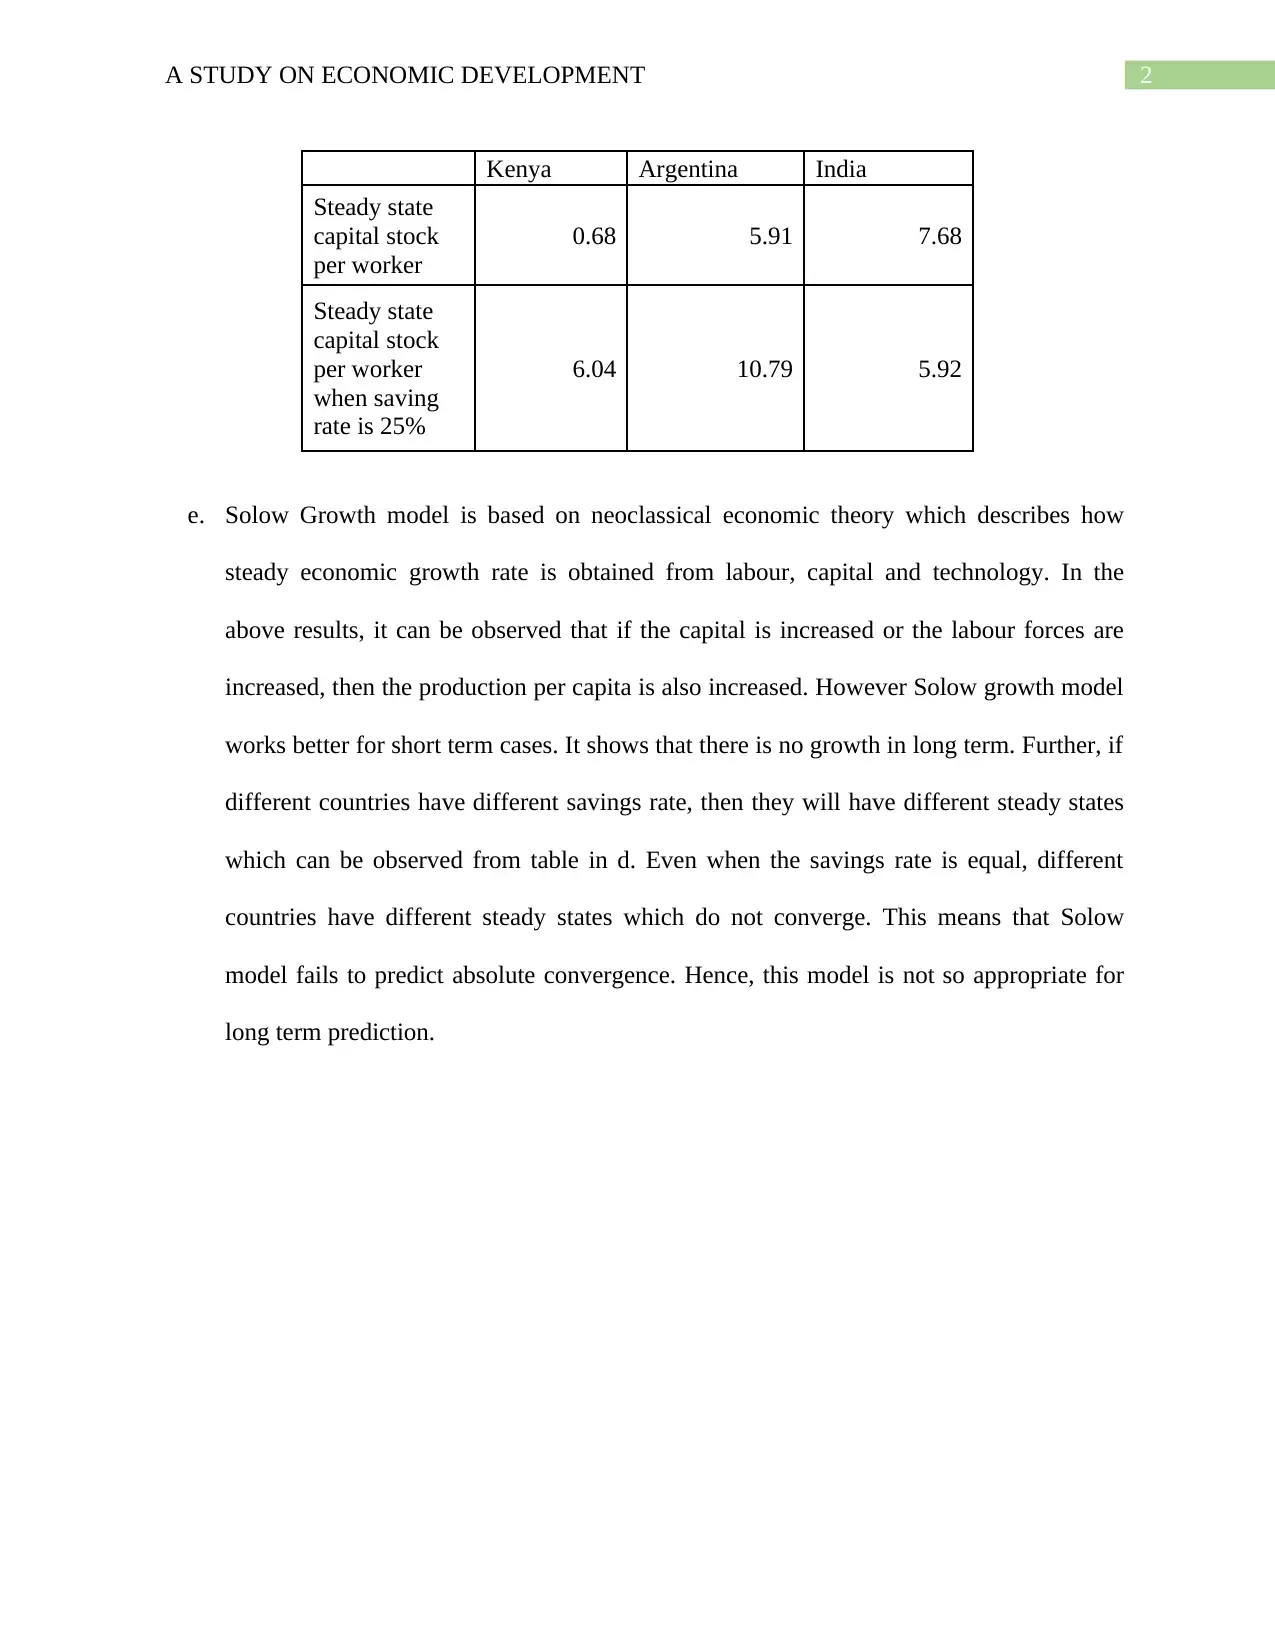
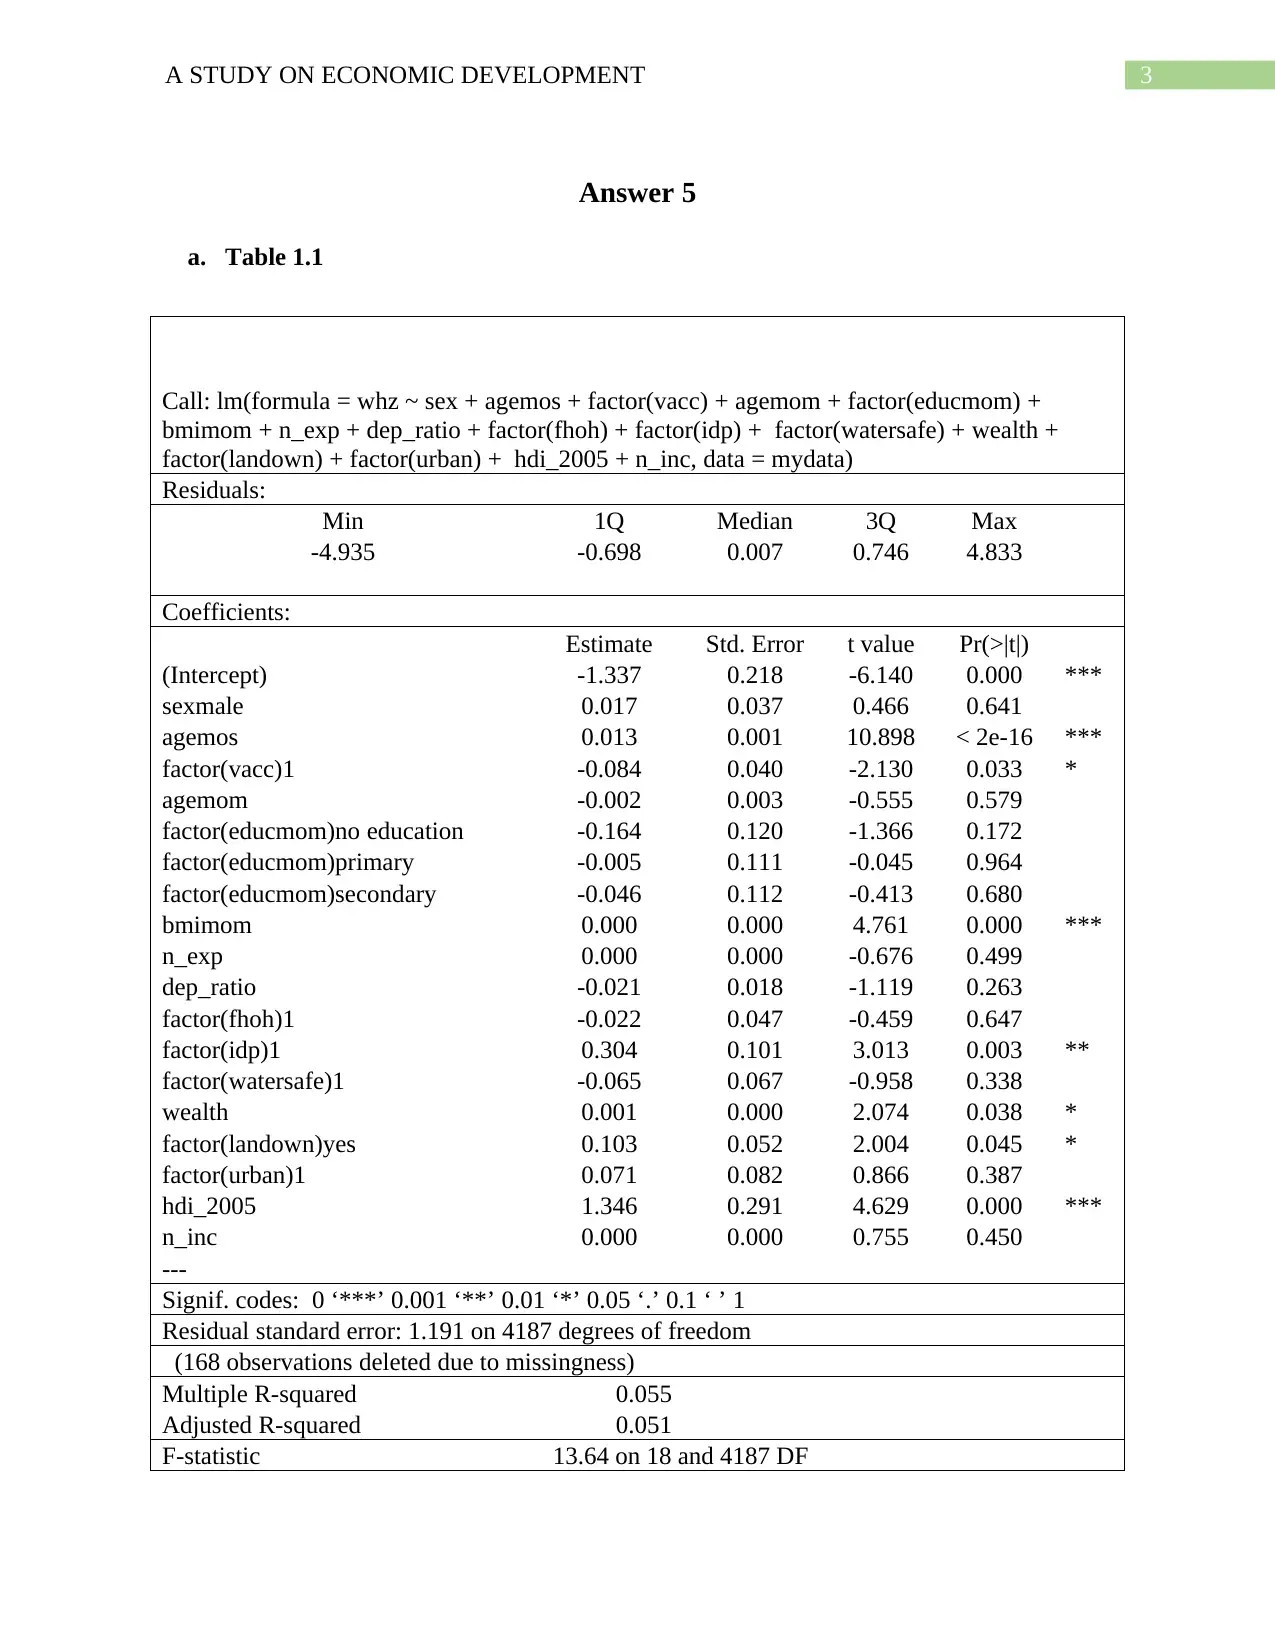
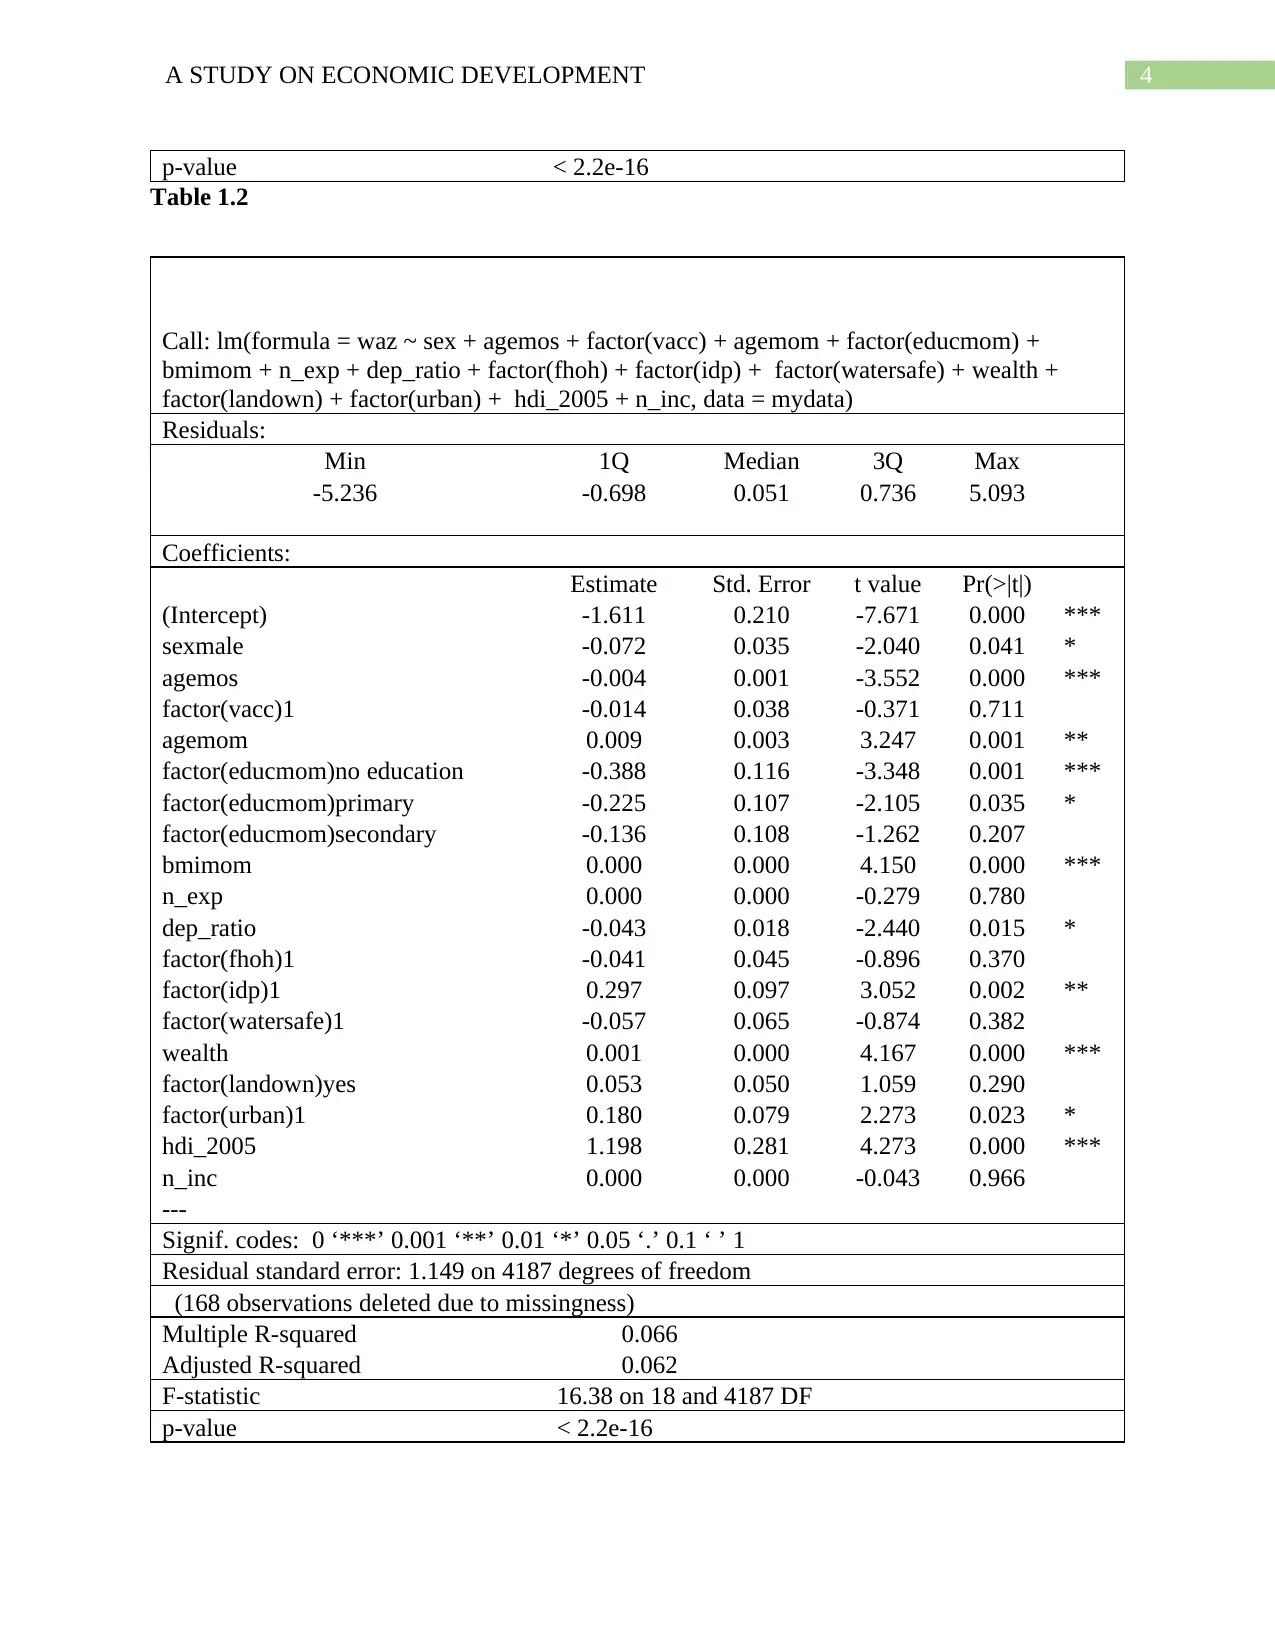
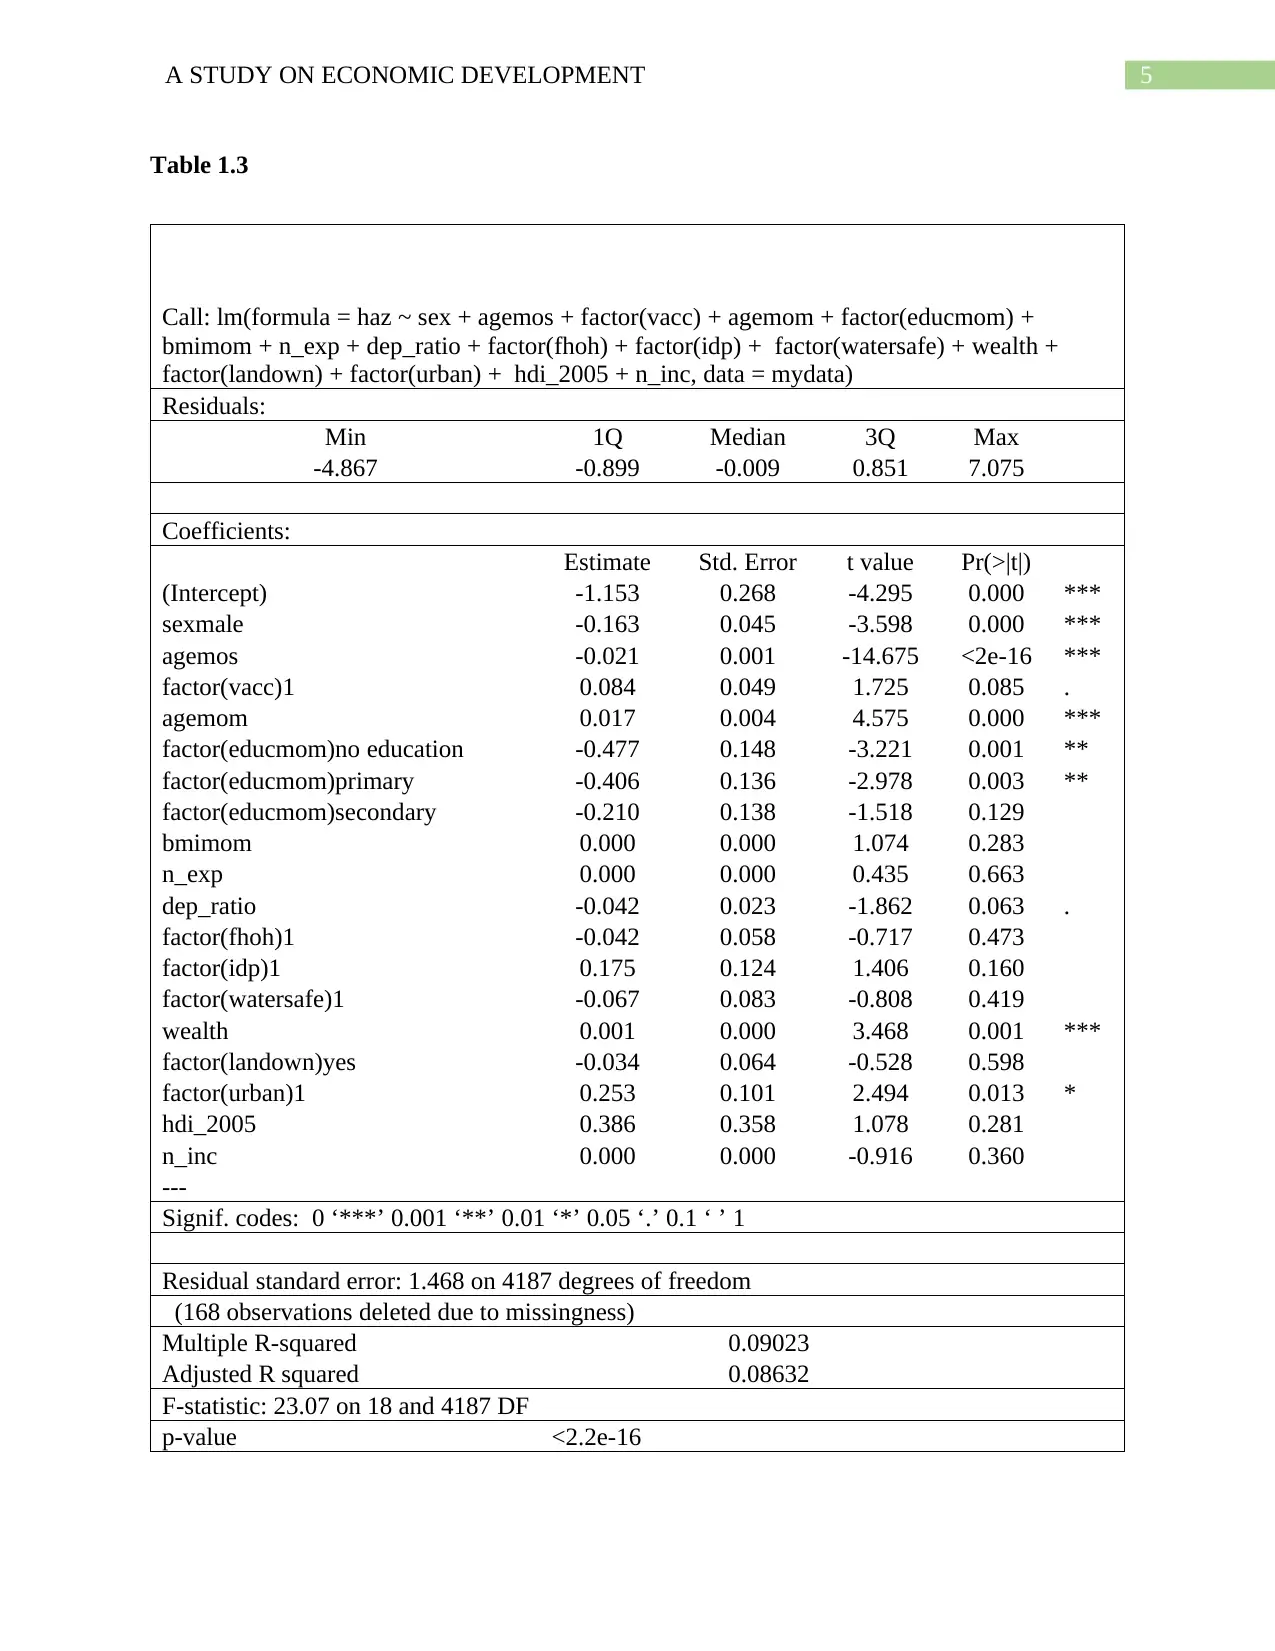
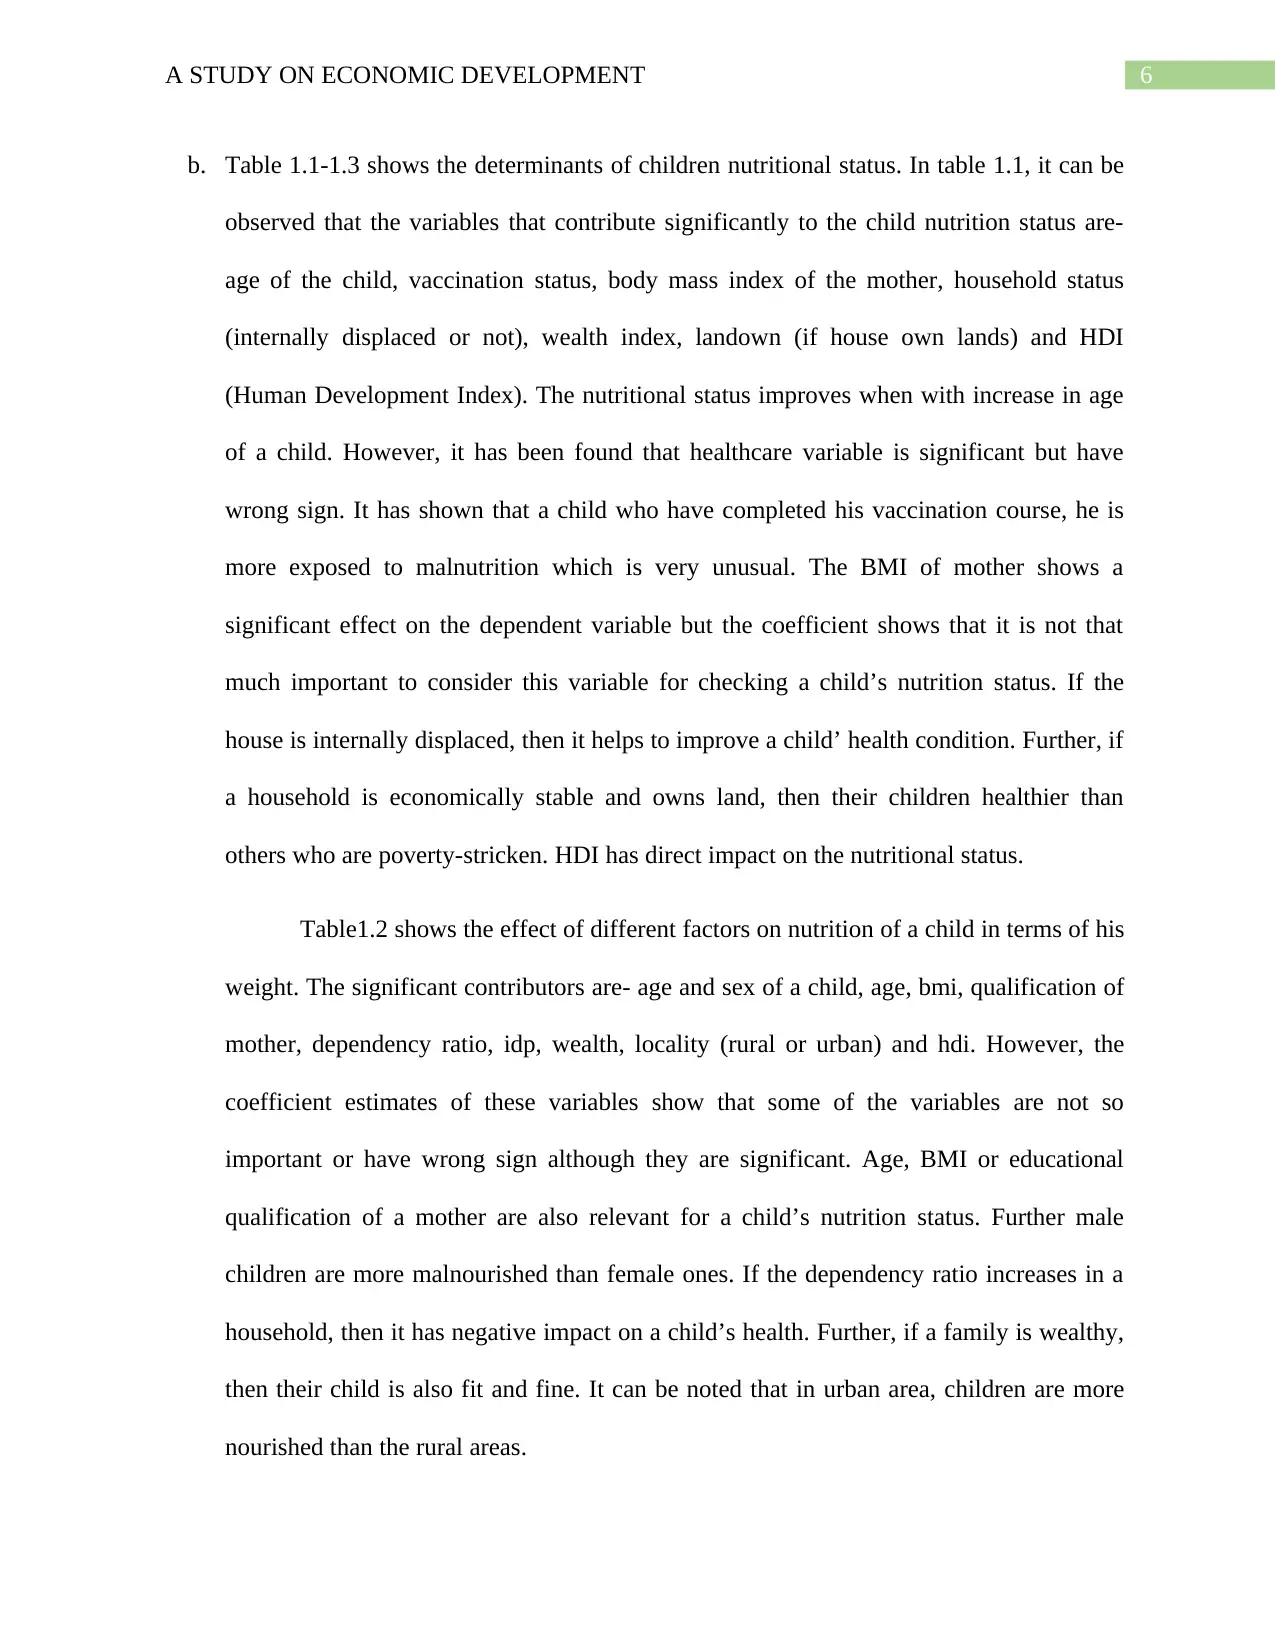
This assignment analyzes economic development, focusing on the Solow Growth Model and its implications. It examines the model's application to countries like Kenya, Argentina, and India, using data from the Penn World Table. The analysis includes calculations of output per worker, consumption per worker, and investment per worker, along with the determination of steady-state capital stock. The assignment also explores the determinants of child nutritional status, using regression analysis to identify factors such as the child's age, vaccination status, mother's BMI, household characteristics, and HDI. The analysis reveals that the Solow model is more suitable for short-term predictions and that maternal education, health awareness programs, and economic growth policies are crucial for improving children's health. The document also includes the R code and output from multiple linear regression models analyzing determinants of children's nutritional status (whz, waz, haz). Furthermore, the assignment highlights the importance of comprehensive healthcare, economic stability, and equitable resource distribution in promoting child health and overall economic development. The assignment concludes with a bibliography of relevant academic sources.
Document Page
Running Head: A STUDY ON ECONOMIC DEVELOPMENT
A STUDY ON ECONOMIC DEVELOPMENT
Name of the Student:
Name of the University:
Author Note:
tabler-icon-diamond-filled.svg

Paraphrase This Document

Need a fresh take? Get an instant paraphrase of this document with our AI Paraphraser
Document Page
1A STUDY ON ECONOMIC DEVELOPMENT
Answer 1
a.
Kenya Argentina India
Output per
worker (y) 19.46 33.34 27.41
Consumption
per worker (c) 18.41 27.87 19.19
Investment per
worker (sy) 1.05 5.47 8.22
b.
Kenya Argentina India
Output per
worker (y) 20.55 35.22 28.95
Consumption
per worker (c) 19.44 29.44 20.26
c.
Kenya Argentina India
Output per
worker (y) 18.66 31.97 26.28
Consumption
per worker (c) 17.65 26.73 18.40
d. For steady state,
k=s k α ( n+d ) k=0
k¿= ( s
n+d ) 1
1α
Document Page
2A STUDY ON ECONOMIC DEVELOPMENT
Kenya Argentina India
Steady state
capital stock
per worker
0.68 5.91 7.68
Steady state
capital stock
per worker
when saving
rate is 25%
6.04 10.79 5.92
e. Solow Growth model is based on neoclassical economic theory which describes how
steady economic growth rate is obtained from labour, capital and technology. In the
above results, it can be observed that if the capital is increased or the labour forces are
increased, then the production per capita is also increased. However Solow growth model
works better for short term cases. It shows that there is no growth in long term. Further, if
different countries have different savings rate, then they will have different steady states
which can be observed from table in d. Even when the savings rate is equal, different
countries have different steady states which do not converge. This means that Solow
model fails to predict absolute convergence. Hence, this model is not so appropriate for
long term prediction.
Document Page
3A STUDY ON ECONOMIC DEVELOPMENT
Answer 5
a. Table 1.1
Call: lm(formula = whz ~ sex + agemos + factor(vacc) + agemom + factor(educmom) +
bmimom + n_exp + dep_ratio + factor(fhoh) + factor(idp) + factor(watersafe) + wealth +
factor(landown) + factor(urban) + hdi_2005 + n_inc, data = mydata)
Residuals:
Min 1Q Median 3Q Max
-4.935 -0.698 0.007 0.746 4.833
Coefficients:
Estimate Std. Error t value Pr(>|t|)
(Intercept) -1.337 0.218 -6.140 0.000 ***
sexmale 0.017 0.037 0.466 0.641
agemos 0.013 0.001 10.898 < 2e-16 ***
factor(vacc)1 -0.084 0.040 -2.130 0.033 *
agemom -0.002 0.003 -0.555 0.579
factor(educmom)no education -0.164 0.120 -1.366 0.172
factor(educmom)primary -0.005 0.111 -0.045 0.964
factor(educmom)secondary -0.046 0.112 -0.413 0.680
bmimom 0.000 0.000 4.761 0.000 ***
n_exp 0.000 0.000 -0.676 0.499
dep_ratio -0.021 0.018 -1.119 0.263
factor(fhoh)1 -0.022 0.047 -0.459 0.647
factor(idp)1 0.304 0.101 3.013 0.003 **
factor(watersafe)1 -0.065 0.067 -0.958 0.338
wealth 0.001 0.000 2.074 0.038 *
factor(landown)yes 0.103 0.052 2.004 0.045 *
factor(urban)1 0.071 0.082 0.866 0.387
hdi_2005 1.346 0.291 4.629 0.000 ***
n_inc 0.000 0.000 0.755 0.450
---
Signif. codes: 0 ‘***’ 0.001 ‘**’ 0.01 ‘*’ 0.05 ‘.’ 0.1 ‘ ’ 1
Residual standard error: 1.191 on 4187 degrees of freedom
(168 observations deleted due to missingness)
Multiple R-squared 0.055
Adjusted R-squared 0.051
F-statistic 13.64 on 18 and 4187 DF
tabler-icon-diamond-filled.svg

Paraphrase This Document

Need a fresh take? Get an instant paraphrase of this document with our AI Paraphraser
Document Page
4A STUDY ON ECONOMIC DEVELOPMENT
p-value < 2.2e-16
Table 1.2
Call: lm(formula = waz ~ sex + agemos + factor(vacc) + agemom + factor(educmom) +
bmimom + n_exp + dep_ratio + factor(fhoh) + factor(idp) + factor(watersafe) + wealth +
factor(landown) + factor(urban) + hdi_2005 + n_inc, data = mydata)
Residuals:
Min 1Q Median 3Q Max
-5.236 -0.698 0.051 0.736 5.093
Coefficients:
Estimate Std. Error t value Pr(>|t|)
(Intercept) -1.611 0.210 -7.671 0.000 ***
sexmale -0.072 0.035 -2.040 0.041 *
agemos -0.004 0.001 -3.552 0.000 ***
factor(vacc)1 -0.014 0.038 -0.371 0.711
agemom 0.009 0.003 3.247 0.001 **
factor(educmom)no education -0.388 0.116 -3.348 0.001 ***
factor(educmom)primary -0.225 0.107 -2.105 0.035 *
factor(educmom)secondary -0.136 0.108 -1.262 0.207
bmimom 0.000 0.000 4.150 0.000 ***
n_exp 0.000 0.000 -0.279 0.780
dep_ratio -0.043 0.018 -2.440 0.015 *
factor(fhoh)1 -0.041 0.045 -0.896 0.370
factor(idp)1 0.297 0.097 3.052 0.002 **
factor(watersafe)1 -0.057 0.065 -0.874 0.382
wealth 0.001 0.000 4.167 0.000 ***
factor(landown)yes 0.053 0.050 1.059 0.290
factor(urban)1 0.180 0.079 2.273 0.023 *
hdi_2005 1.198 0.281 4.273 0.000 ***
n_inc 0.000 0.000 -0.043 0.966
---
Signif. codes: 0 ‘***’ 0.001 ‘**’ 0.01 ‘*’ 0.05 ‘.’ 0.1 ‘ ’ 1
Residual standard error: 1.149 on 4187 degrees of freedom
(168 observations deleted due to missingness)
Multiple R-squared 0.066
Adjusted R-squared 0.062
F-statistic 16.38 on 18 and 4187 DF
p-value < 2.2e-16
Document Page
5A STUDY ON ECONOMIC DEVELOPMENT
Table 1.3
Call: lm(formula = haz ~ sex + agemos + factor(vacc) + agemom + factor(educmom) +
bmimom + n_exp + dep_ratio + factor(fhoh) + factor(idp) + factor(watersafe) + wealth +
factor(landown) + factor(urban) + hdi_2005 + n_inc, data = mydata)
Residuals:
Min 1Q Median 3Q Max
-4.867 -0.899 -0.009 0.851 7.075
Coefficients:
Estimate Std. Error t value Pr(>|t|)
(Intercept) -1.153 0.268 -4.295 0.000 ***
sexmale -0.163 0.045 -3.598 0.000 ***
agemos -0.021 0.001 -14.675 <2e-16 ***
factor(vacc)1 0.084 0.049 1.725 0.085 .
agemom 0.017 0.004 4.575 0.000 ***
factor(educmom)no education -0.477 0.148 -3.221 0.001 **
factor(educmom)primary -0.406 0.136 -2.978 0.003 **
factor(educmom)secondary -0.210 0.138 -1.518 0.129
bmimom 0.000 0.000 1.074 0.283
n_exp 0.000 0.000 0.435 0.663
dep_ratio -0.042 0.023 -1.862 0.063 .
factor(fhoh)1 -0.042 0.058 -0.717 0.473
factor(idp)1 0.175 0.124 1.406 0.160
factor(watersafe)1 -0.067 0.083 -0.808 0.419
wealth 0.001 0.000 3.468 0.001 ***
factor(landown)yes -0.034 0.064 -0.528 0.598
factor(urban)1 0.253 0.101 2.494 0.013 *
hdi_2005 0.386 0.358 1.078 0.281
n_inc 0.000 0.000 -0.916 0.360
---
Signif. codes: 0 ‘***’ 0.001 ‘**’ 0.01 ‘*’ 0.05 ‘.’ 0.1 ‘ ’ 1
Residual standard error: 1.468 on 4187 degrees of freedom
(168 observations deleted due to missingness)
Multiple R-squared 0.09023
Adjusted R squared 0.08632
F-statistic: 23.07 on 18 and 4187 DF
p-value <2.2e-16
Document Page
6A STUDY ON ECONOMIC DEVELOPMENT
b. Table 1.1-1.3 shows the determinants of children nutritional status. In table 1.1, it can be
observed that the variables that contribute significantly to the child nutrition status are-
age of the child, vaccination status, body mass index of the mother, household status
(internally displaced or not), wealth index, landown (if house own lands) and HDI
(Human Development Index). The nutritional status improves when with increase in age
of a child. However, it has been found that healthcare variable is significant but have
wrong sign. It has shown that a child who have completed his vaccination course, he is
more exposed to malnutrition which is very unusual. The BMI of mother shows a
significant effect on the dependent variable but the coefficient shows that it is not that
much important to consider this variable for checking a child’s nutrition status. If the
house is internally displaced, then it helps to improve a child’ health condition. Further, if
a household is economically stable and owns land, then their children healthier than
others who are poverty-stricken. HDI has direct impact on the nutritional status.
Table1.2 shows the effect of different factors on nutrition of a child in terms of his
weight. The significant contributors are- age and sex of a child, age, bmi, qualification of
mother, dependency ratio, idp, wealth, locality (rural or urban) and hdi. However, the
coefficient estimates of these variables show that some of the variables are not so
important or have wrong sign although they are significant. Age, BMI or educational
qualification of a mother are also relevant for a child’s nutrition status. Further male
children are more malnourished than female ones. If the dependency ratio increases in a
household, then it has negative impact on a child’s health. Further, if a family is wealthy,
then their child is also fit and fine. It can be noted that in urban area, children are more
nourished than the rural areas.
tabler-icon-diamond-filled.svg

Paraphrase This Document

Need a fresh take? Get an instant paraphrase of this document with our AI Paraphraser
Document Page
7A STUDY ON ECONOMIC DEVELOPMENT
Table 1.3 shows a similar pattern like table 1.2. Here it can be found that the
coefficients of age and sex of a child have unexpected signs although they are significant.
Further age and qualification of mother show significant effect on a child’s height.
Families that are living in urban area and are economically stable are more able to
provide proper nutrition to their children.
c. From the analyses, it can be observed that child’s nutrition status is much dependable on
many vital factors. To improve their health conditions, some initiatives can be taken like-
If proper education is given to a mother, then she could understand the value of
giving nutritional food to her children. Health awareness programmes should be
arranged to make people understand.
In rural areas, more healthcare centres are required. Further, some health programmes
should be organised to improve the condition.
Economic growth policies should be taken to improve the lifestyle of common
people.
It is required to check if a male and a female child are getting equivalent nutritional
food.
Govt. should organise some regular health check-up camps for children to check if
they are having proper nutrition or not.
Document Page
8A STUDY ON ECONOMIC DEVELOPMENT
Bibliography
1. Rahman MS, Shahari F. The nexus between financial integration and real economy:
Solow-growth model concept. Research in International Business and Finance. 2017 Dec
1;42:1244-53.
2. Knibbe M. The growth of capital: Piketty, Harrod-Domar, Solow and the long run
development of the rate of investment. real-world economics review. 2014 Oct;69:100-6.
3. Solow RM. Resources and economic growth. The American Economist. 2016
Mar;61(1):52-60.
4. Faraway JJ. Linear models with R. CRC press; 2014 Jul 1.
5. Bbaale E. Maternal education and child nutritional status: evidence from Uganda. African
Journal of Economic and Management Studies. 2014 Apr 1.
6. World Health Organization. Accelerating nutrition improvements: best practices in
scaling up nutrition actions: examples from Ethiopia, Uganda and the United Republic of
Tanzania. World Health Organization; 2016.
chevron_up_icon
1 out of 9
circle_padding
hide_on_mobile
zoom_out_icon
[object Object]