Business Economics Report: Monopoly, Elasticity, Labor Market Analysis
VerifiedAdded on 2022/11/30
|18
|3748
|462
Report
AI Summary
This business economics report provides a comprehensive analysis of various economic concepts. It begins by examining the problems associated with monopolies, public policy interventions, and how monopolies generate unusual profits using cost curves. The report then delves into price elasticity of demand, equilibrium price and quantity, and income elasticity. It proceeds to explore the equilibrium in the labor market, factors influencing labor supply, and the external effects of environmental issues like uranium mine leakage. The report further analyzes the impact of oil price shocks on short-run aggregate supply (SRAS), different theories explaining the SRAS curve's upward slope, and the Bank of England's control of the money supply and interest rates. Finally, the report discusses the effects of interest rates on the economy and the causes and policy responses to the global financial crisis of 2007-2009.

Business Economics
Paraphrase This Document
Need a fresh take? Get an instant paraphrase of this document with our AI Paraphraser

Contents
INTRODUCTION...........................................................................................................................................3
QUESTION 1.................................................................................................................................................3
(a) Explain using the above examples why a monopoly is problematic for a given economy or a
government?............................................................................................................................................3
(b) Reflecting on examples from the article explain how public policy can curb Monopolies?...............4
(c) Using Cost curves explain how Monopolies make unusual profits?...................................................4
QUESTION 2.................................................................................................................................................5
(a) What are the equilibrium price and equilibrium quantity of sweet packs?.........................................5
(b) Explain what would happen to the price of a pack of sweets.............................................................5
(c) Use the above data to draw a graph with the correct labeling.............................................................6
d. Explain what is price elasticity of demand and explain why it would be important for producers to
know the price elasticity of their product and how it would affect their decision making?......................6
QUESTION 3.................................................................................................................................................6
Income Elasticity.....................................................................................................................................6
QUESTION 4.................................................................................................................................................7
Equilibrium in labor market.....................................................................................................................7
What other factors that can cause the labour supply curve to shift?.........................................................8
QUESTION 5.................................................................................................................................................9
External effects associated with Water from a uranium mine leaking into Kakadu National Park..........9
QUESTION 6.................................................................................................................................................9
a) Oil price shocks have an evident impact on the short run aggregate supply curve. With the help of a
graph demonstrate how rising oil prices affect the SRAS and explain what other factors can cause this
shift..........................................................................................................................................................9
b) Different theories attempted to explain why SRAS curves slope upwards........................................10
QUESTION 7...............................................................................................................................................11
Discuss how the bank of England can control the Money supply and interest rates and then reflect on
the above actions taken?........................................................................................................................11
Discuss briefly how do Interest rates affect the economy?....................................................................11
QUESTION 8...............................................................................................................................................12
Briefly discuss the reasons behind the global financial crisis in 2007 -2009.........................................12
Discuss the UK Policy actions to stimulate the economy to face the global financial crisis..................13
⊘ This is a preview!⊘
Do you want full access?
Subscribe today to unlock all pages.
Trusted by 1+ million students worldwide

CONCLUSION.............................................................................................................................................14
REFERENCES..............................................................................................................................................15
REFERENCES..............................................................................................................................................15
Paraphrase This Document
Need a fresh take? Get an instant paraphrase of this document with our AI Paraphraser
INTRODUCTION
In general, economics is the study of the elements and roles of a particular mechanism or
market, including producers and consumers and the effects of the shortage theory. Inside an
economy, significant topics of study include prospective study, production processes, and
demand. Market economics focuses on the elements and causes of corporate operations, as well
as how they relate to the environment overall (D’Amato, 2020). Economic concepts, strategies,
common business governance, operating expense expenditure, profit generation, production
growth, and ultimate organization structure are mostly discussed in the field of international
business. In this report consist of various questions that based on economics. In these questions
discussed about various topics price elasticity, mono-policies and many others.
QUESTION 1
(a) Explain using the above examples why a monopoly is problematic for a given economy or a
government?
Monopolies stifle free trade and make it impossible for the government to fix rates. As a
result, the following 4 negative consequences occur: Price fixing: Although corporations are sole
suppliers, they can charge anything they want. This is known as price setting. Empirical evidence
suggests that organizational dominance is a major contributor to several of our more critical
issues. Small Businesses are undermined by Monopoly Power, in most markets; smaller firms
are aging rapidly, whereas the majority of additional enterprises launched per year has dropped
dramatically.
At first, there was no government oversight of early American monopolistic. Even then,
the introduction of monopoly legislation in the United States in the form of the Sherman
Antitrust Act in 1890 resulted in the destruction and reform of Standard Oil and American
Tobacco by 1911. These first lawsuits, like all antitrust cases taken against corporations now,
took many years to work their way into the legal system. With the exception of Standard Oil and
American Tobacco, U.S. Steel was questioned but not discovered to be the only provider of
product to the American industry. Nevertheless, it maintained a sizable customer base for several
years (Bhawe and Zahra, 2019).
(b) Reflecting on examples from the article explain how public policy can curb Monopolies?
The majority of today's monopolies do not actually control an entire global market.
Instead, they manage significant assets in a single nation or territory. This is known as
liberalization, and it is most common in the oil, infrastructure, and finance sectors. Saudi
Aramco, the country's government natural gas and oil corporation, is the most significant
indication of a nationalized great asset. The majority of contemporary monopolies do not
actually control the whole global market. It is undoubtedly the most profitable corporation in the
world, with a value of $1.7 trillion as of its late 2019 IPO.
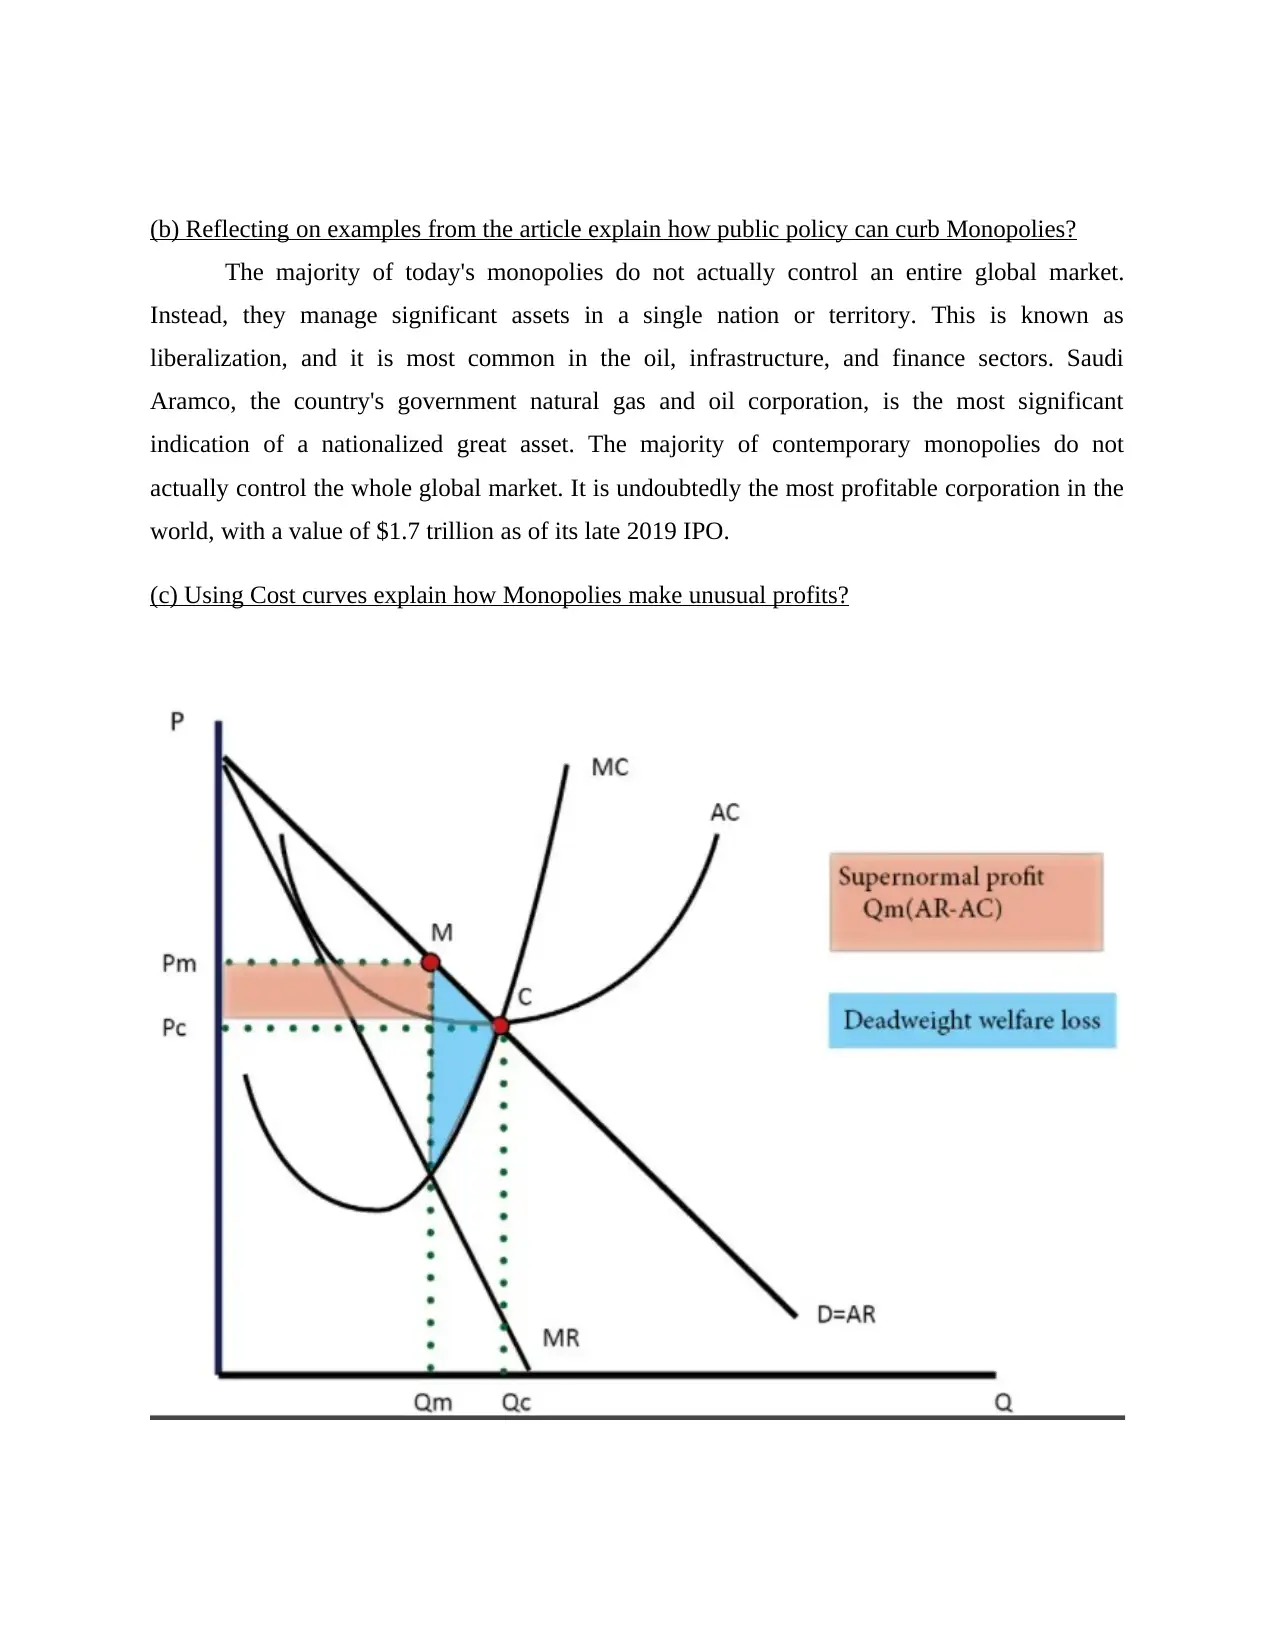
(c) Using Cost curves explain how Monopolies make unusual profits?
The majority of today's monopolies do not actually control an entire global market.
Instead, they manage significant assets in a single nation or territory. This is known as
liberalization, and it is most common in the oil, infrastructure, and finance sectors. Saudi
Aramco, the country's government natural gas and oil corporation, is the most significant
indication of a nationalized great asset. The majority of contemporary monopolies do not
actually control the whole global market. It is undoubtedly the most profitable corporation in the
world, with a value of $1.7 trillion as of its late 2019 IPO.
(c) Using Cost curves explain how Monopolies make unusual profits?
⊘ This is a preview!⊘
Do you want full access?
Subscribe today to unlock all pages.
Trusted by 1+ million students worldwide
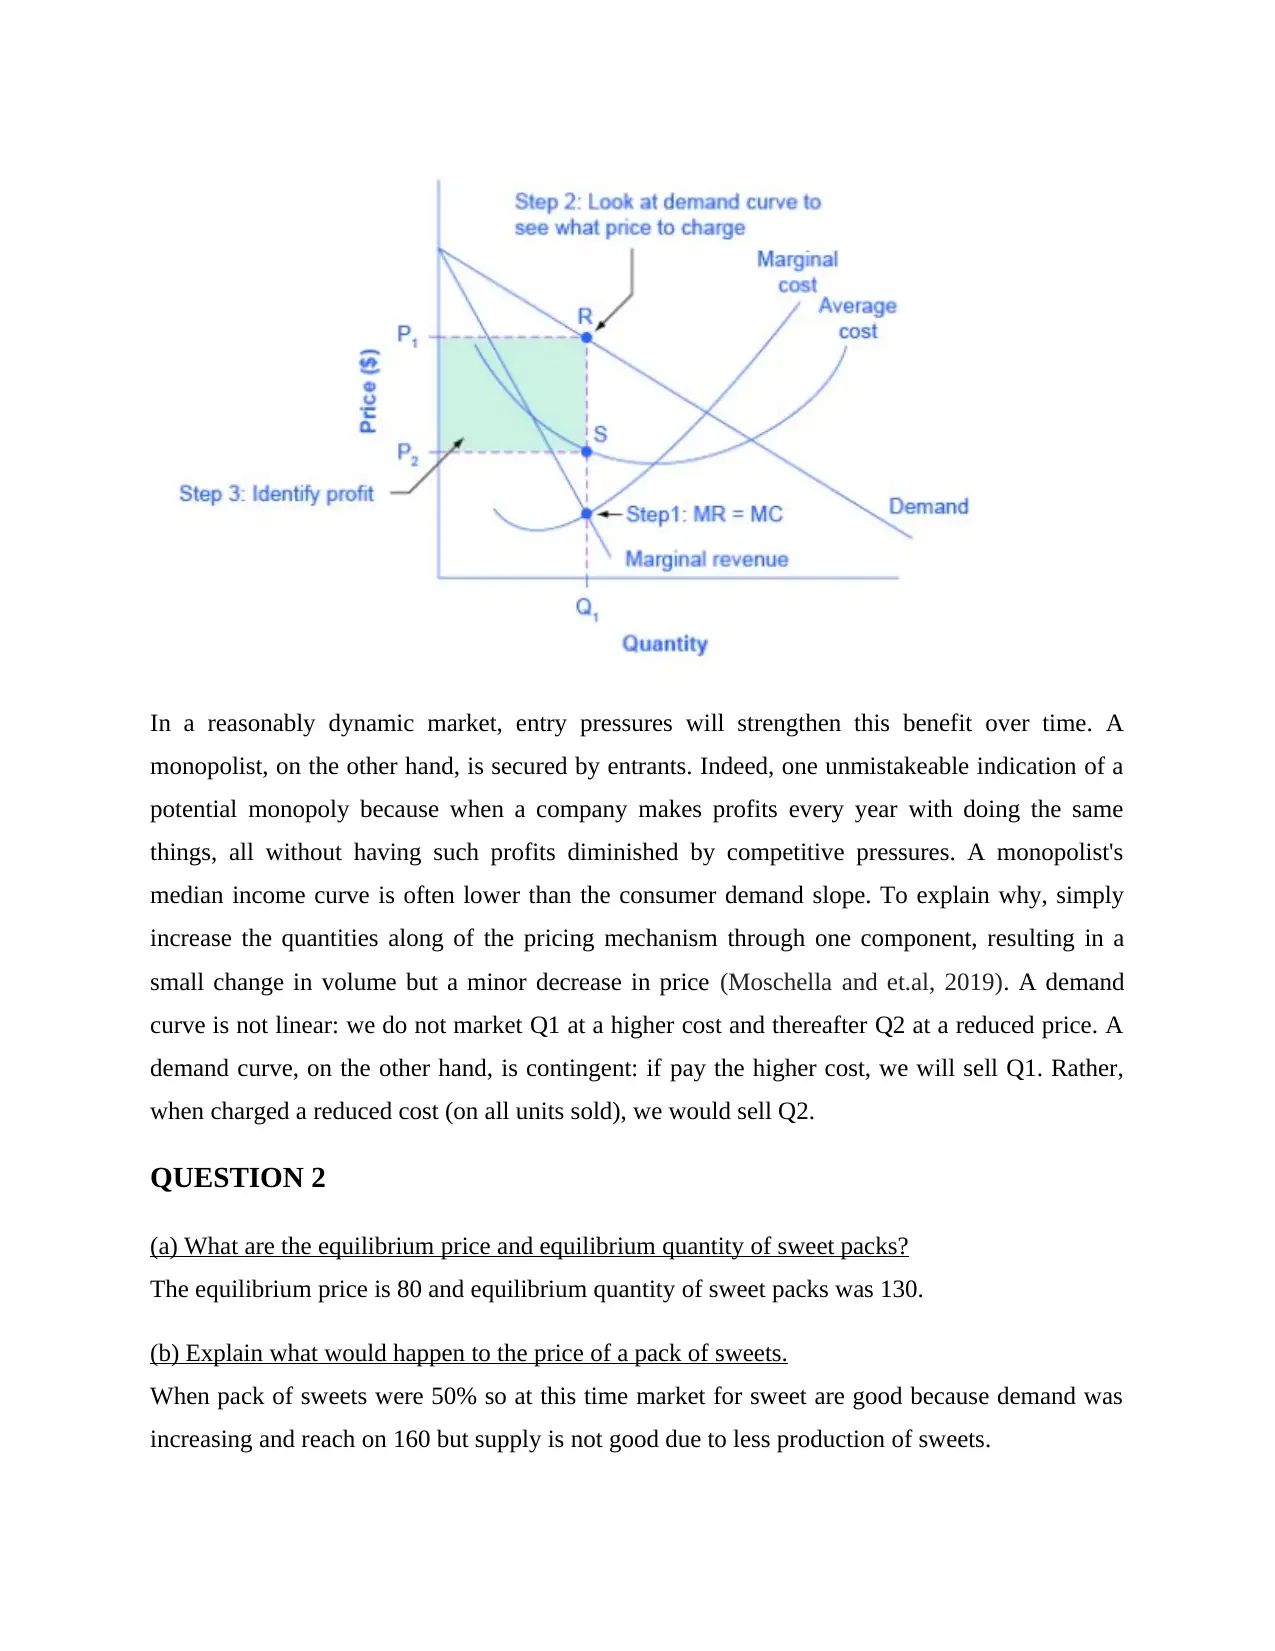
In a reasonably dynamic market, entry pressures will strengthen this benefit over time. A
monopolist, on the other hand, is secured by entrants. Indeed, one unmistakeable indication of a
potential monopoly because when a company makes profits every year with doing the same
things, all without having such profits diminished by competitive pressures. A monopolist's
median income curve is often lower than the consumer demand slope. To explain why, simply
increase the quantities along of the pricing mechanism through one component, resulting in a
small change in volume but a minor decrease in price (Moschella and et.al, 2019). A demand
curve is not linear: we do not market Q1 at a higher cost and thereafter Q2 at a reduced price. A
demand curve, on the other hand, is contingent: if pay the higher cost, we will sell Q1. Rather,
when charged a reduced cost (on all units sold), we would sell Q2.
QUESTION 2
(a) What are the equilibrium price and equilibrium quantity of sweet packs?
The equilibrium price is 80 and equilibrium quantity of sweet packs was 130.
(b) Explain what would happen to the price of a pack of sweets.
When pack of sweets were 50% so at this time market for sweet are good because demand was
increasing and reach on 160 but supply is not good due to less production of sweets.
Paraphrase This Document
Need a fresh take? Get an instant paraphrase of this document with our AI Paraphraser
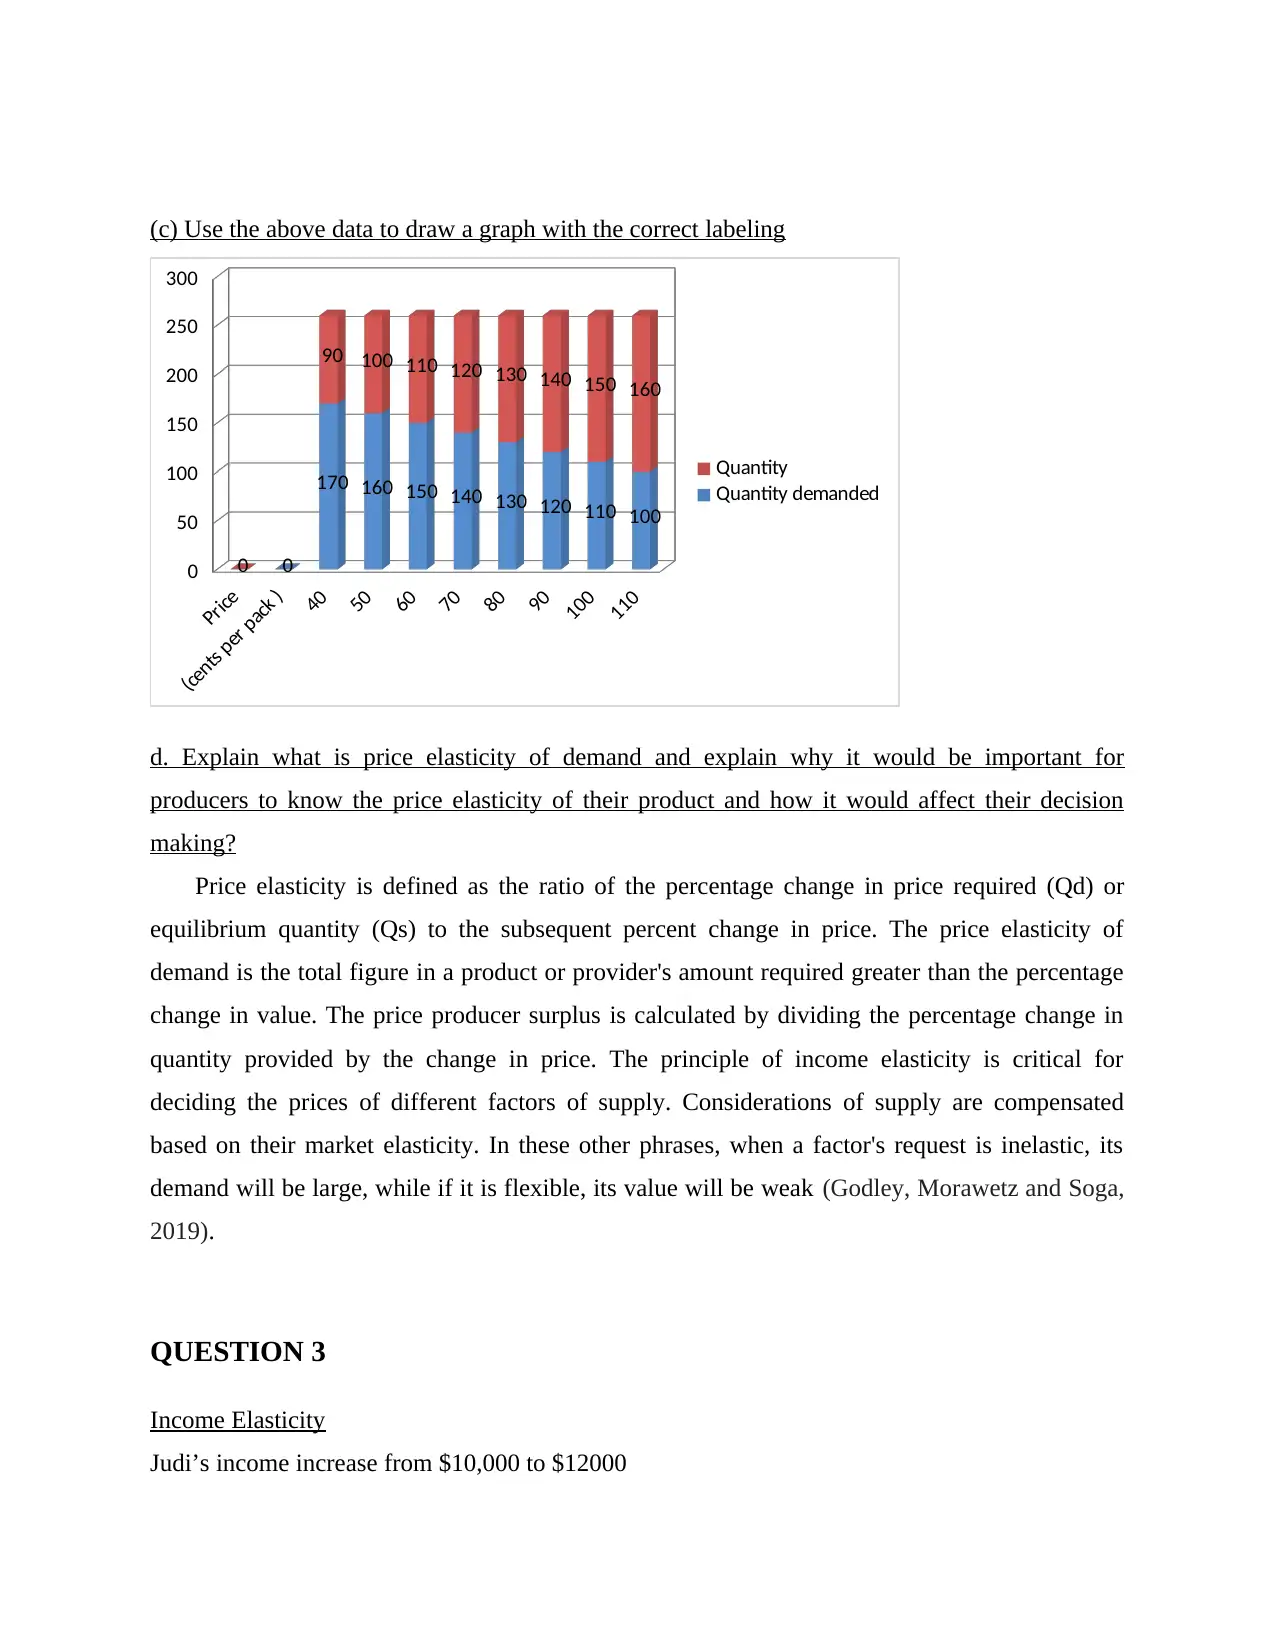
(c) Use the above data to draw a graph with the correct labeling
Price
(cents per pack )
40
50
60
70
80
90
100
110
0
50
100
150
200
250
300
0
90 100 110 120 130 140 150 160
0
170 160 150 140 130 120 110 100
Quantity
Quantity demanded
d. Explain what is price elasticity of demand and explain why it would be important for
producers to know the price elasticity of their product and how it would affect their decision
making?
Price elasticity is defined as the ratio of the percentage change in price required (Qd) or
equilibrium quantity (Qs) to the subsequent percent change in price. The price elasticity of
demand is the total figure in a product or provider's amount required greater than the percentage
change in value. The price producer surplus is calculated by dividing the percentage change in
quantity provided by the change in price. The principle of income elasticity is critical for
deciding the prices of different factors of supply. Considerations of supply are compensated
based on their market elasticity. In these other phrases, when a factor's request is inelastic, its
demand will be large, while if it is flexible, its value will be weak (Godley, Morawetz and Soga,
2019).
QUESTION 3
Income Elasticity
Judi’s income increase from $10,000 to $12000
Increase demand for concert ticket 10%
Decrease demand for bus ride 5%
(a) Income elasticity for concert tickets
= 12000-10000 / 10%
= 2000 / 10%
= 200
(b) Income elasticity for bus
= 12000 – 10000 / 5%
= 100
QUESTION 4
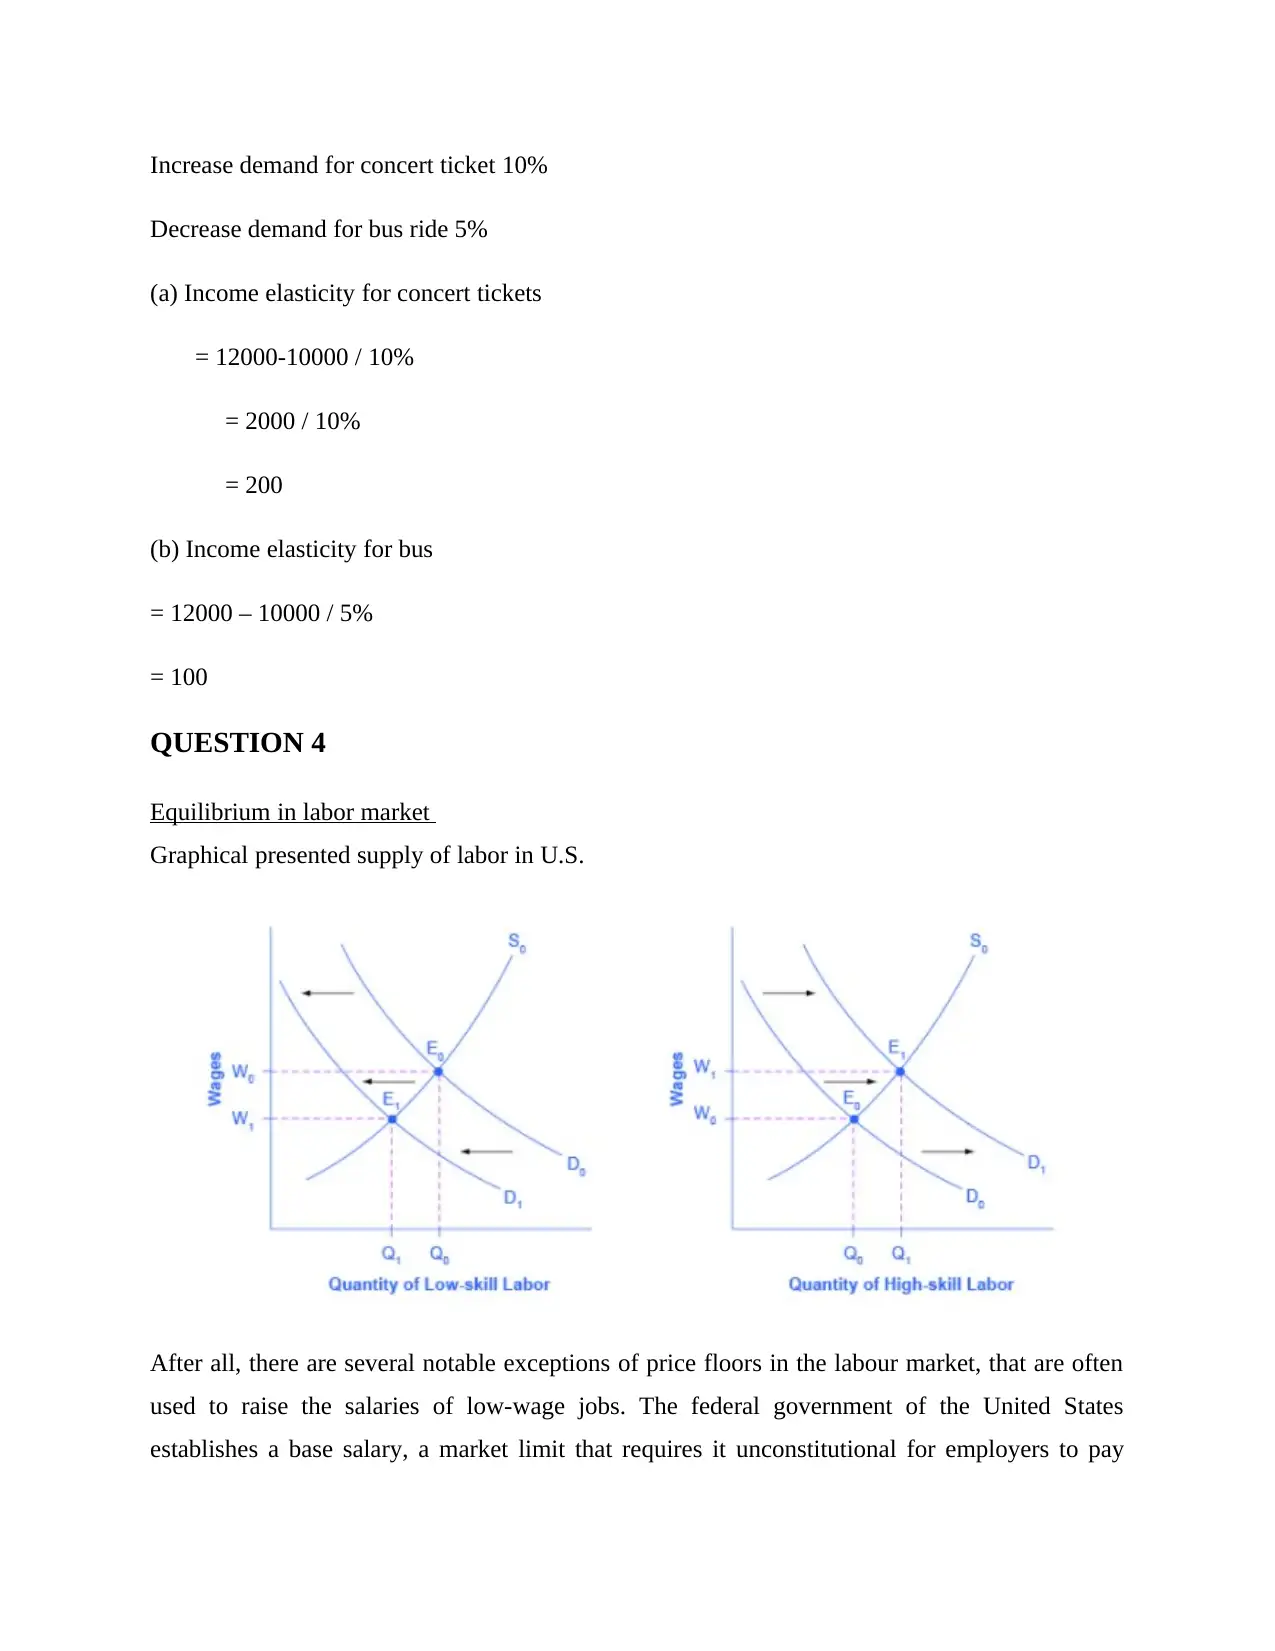
Equilibrium in labor market
Graphical presented supply of labor in U.S.
After all, there are several notable exceptions of price floors in the labour market, that are often
used to raise the salaries of low-wage jobs. The federal government of the United States
establishes a base salary, a market limit that requires it unconstitutional for employers to pay
Decrease demand for bus ride 5%
(a) Income elasticity for concert tickets
= 12000-10000 / 10%
= 2000 / 10%
= 200
(b) Income elasticity for bus
= 12000 – 10000 / 5%
= 100
QUESTION 4
Equilibrium in labor market
Graphical presented supply of labor in U.S.
After all, there are several notable exceptions of price floors in the labour market, that are often
used to raise the salaries of low-wage jobs. The federal government of the United States
establishes a base salary, a market limit that requires it unconstitutional for employers to pay
⊘ This is a preview!⊘
Do you want full access?
Subscribe today to unlock all pages.
Trusted by 1+ million students worldwide
workers less than a specified annual salary. The basic income in the United States was increased
to $7.25 per hour in mid-2009. Local reform campaigns in a number of American cities have
advocated for a minimum wage increase, dubbed a "living wage." Proponents of living wage
legislation argue that the min salary is insufficient to guarantee a decent quality of living (Del
Sarto and et.al, 2019).
What other factors that can cause the labour supply curve to shift?
Change in culture: A change in culture about business and leisure will cause the labor
supply curve to shift. When people are more likely to place a higher emphasis on recreation, they
will retire earlier for each paycheck, and the labor supply curve will turn to the left. If they plan
to purchase goods and services, the supply curve would most likely change to the correct.
Change in income: As income rises, so does the market for recreation, growing the
supply of labor. It is important to differentiate between variations anywhere along supply curve
and changes in the supply curve itself. A difference in income as a result of a pay change is
represented by a shift along the curvature; it causes the income and replacement results that we
have already described. But assume wealth comes from someone else: a person decides to marry
and has admission to his or her spouse's income, or a person inherits money, or earns the game.
Adverse side effect wage gains are expected to lower labor supply, moving the beneficiaries'
supply curve for labour to the left (Asongu and Odhiambo, 2019).
Changes in population: A rise in population raises the surplus of labor; a decrease
decreases it. Labor unions have traditionally criticized increasing immigration although their
advocates believe that a rise in labor supply would change the supply to the right, putting strain
on the economy.
Changes in expectations: Average lifespan is one shift in attitudes that may have an impact
on labour supply. One factor is faith in the provision of State Pensions. Assume, for instance,
that individuals hope to live healthier lives but become less positive regarding their Social
Security payments. This could result in a rise in labour supply.
Paraphrase This Document
Need a fresh take? Get an instant paraphrase of this document with our AI Paraphraser
QUESTION 5
External effects associated with Water from a uranium mine leaking into Kakadu National Park
The consequences of uranium extraction are far-reaching. The end-use of plutonium in
power and military manufacturing has consequences for the atmosphere and population health,
including threats of radiation spills, contamination, meltdowns, and nuclear blasts. A Public
sector scientist has disclosed that the Explorer uranium mine within the World Culture and
history Kakadu National Park leaks 100,000 litres of polluted water into the earth underneath the
reserve each day.
At a Senate committee meeting, Alan Hughes, the United kingdom supervisory scientist
assigned to oversee the mine works ecological consequences, revealed that about 100 metric tons
of chemical is flowing from the mine works drainage system into rock fractures underneath
Kakadu, the amount of 100,000 litres or three fuel container ships (Fairlie, 2020).
QUESTION 6
a) Oil price shocks have an evident impact on the short run aggregate supply curve. With the
help of a graph demonstrate how rising oil prices affect the SRAS and explain what other factors
can cause this shift.
A significant increase in oil prices would increase inflation. This is due to rising
transportation costs, which would result in increased rates for certain commodities. This is cost-
push inflation, as opposed to inflation triggered by increasing accounting career expansion.
Buyers' net spending would be reduced. They receive additional transportation costs but do not
benefit from increasing wages. Rising oil prices will delay economic development, which is
especially problematic if consumer demand is poor.
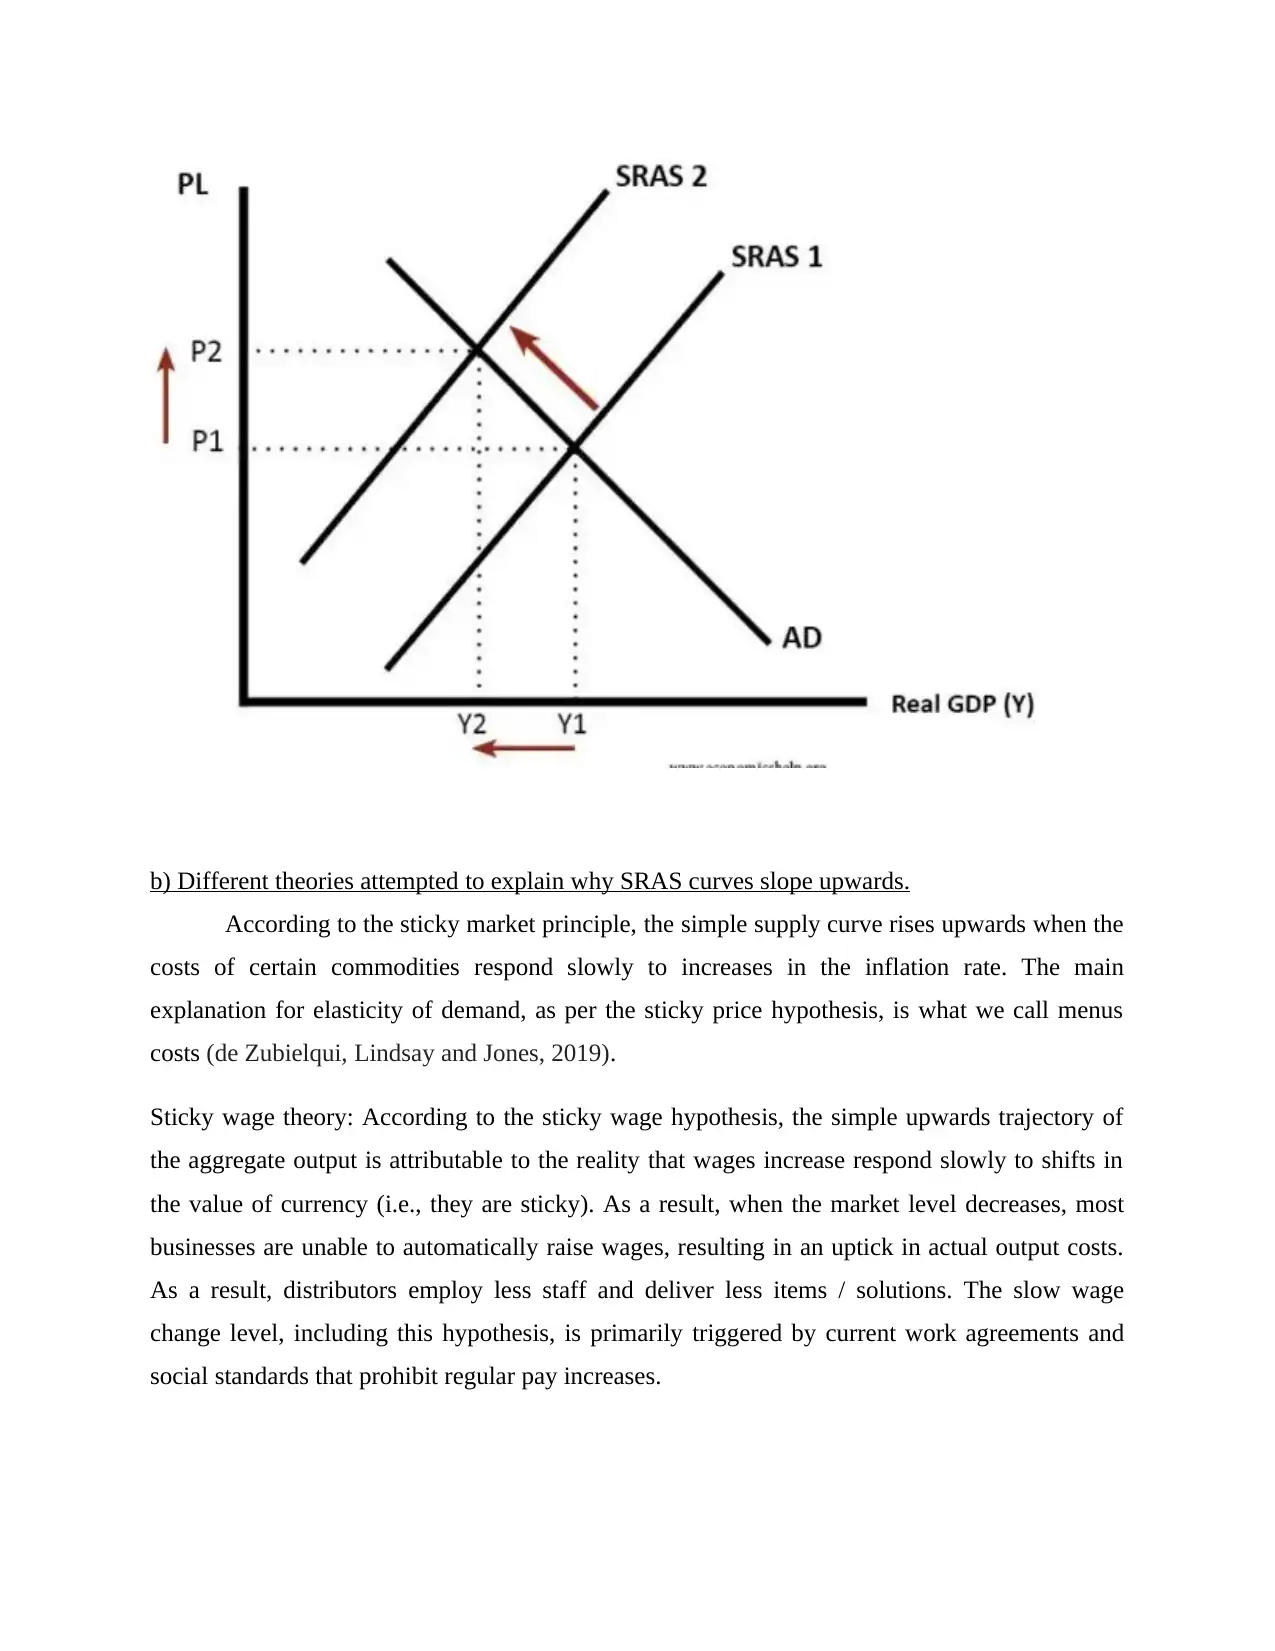
b) Different theories attempted to explain why SRAS curves slope upwards.
According to the sticky market principle, the simple supply curve rises upwards when the
costs of certain commodities respond slowly to increases in the inflation rate. The main
explanation for elasticity of demand, as per the sticky price hypothesis, is what we call menus
costs (de Zubielqui, Lindsay and Jones, 2019).
Sticky wage theory: According to the sticky wage hypothesis, the simple upwards trajectory of
the aggregate output is attributable to the reality that wages increase respond slowly to shifts in
the value of currency (i.e., they are sticky). As a result, when the market level decreases, most
businesses are unable to automatically raise wages, resulting in an uptick in actual output costs.
As a result, distributors employ less staff and deliver less items / solutions. The slow wage
change level, including this hypothesis, is primarily triggered by current work agreements and
social standards that prohibit regular pay increases.
⊘ This is a preview!⊘
Do you want full access?
Subscribe today to unlock all pages.
Trusted by 1+ million students worldwide
1 out of 18
Related Documents


Your All-in-One AI-Powered Toolkit for Academic Success.
+13062052269
info@desklib.com
Available 24*7 on WhatsApp / Email
![[object Object]](/_next/static/media/star-bottom.7253800d.svg)
Unlock your academic potential
Copyright © 2020–2026 A2Z Services. All Rights Reserved. Developed and managed by ZUCOL.