Economic Principles and Decision Making: Market Analysis Report
VerifiedAdded on 2021/12/15
|25
|4463
|69
Report
AI Summary
This report provides an analysis of the feasibility of introducing an energy bar into the Atollia market. It begins with an executive summary outlining the project's objectives, which include projecting demand based on changes in income, tariffs, and inflation. The report employs various economic concepts like supply and demand, aggregate demand and supply, the Phillips curve, and the Laffer curve to understand the business environment. It explores how changes in nominal income, tariff rates, and inflation impact the demand for energy bars. The analysis reveals the adverse effects of tariffs and the positive impact of income on demand. The report also examines the interrelation between income, inflation, and tariff rates, using market survey data. Finally, the report concludes with recommendations based on the demand projections and economic analysis, considering four different scenarios with varying levels of income, inflation, and tariff growth.
Running head: ECONOMIC PRINCIPLES AND DECISION MAKING
Economic Principles And Decision Making
Name of the Student
Name of the University
Student ID
Economic Principles And Decision Making
Name of the Student
Name of the University
Student ID
Paraphrase This Document
Need a fresh take? Get an instant paraphrase of this document with our AI Paraphraser
1ECONOMIC PRINCIPLES AND DECISION MAKING
Executive Summary
The research report aims to evaluate feasibility of introducing energy bar in the Atollia market.
market survey has been conducted to estimate demand of energy bar in the targeted market.
Demand projection is an important aspect in determining profitability of the business. A higher
local demand encourages firms to enter a market. The market survey on Atollai include four
main factors, income, tariff, inflation and number of gyms. The objective is to project demand
for energy bar for various level of changes in nominal income, tariff rate and inflation. The
economic concepts used for understanding business environment are supply and demand,
aggregate demand and aggregate supply, Philips curve and Laffer curve. The change in real
income is obtained after discounting the rate of change in nominal income by the rate of
inflation. The analysis finds that tariff has a significantly adverse effect on energy bar demand
while income has a positive significant impact on energy bar demand.
2ECONOMIC PRINCIPLES AND DECISION MAKING
Table of Contents
Introduction......................................................................................................................................3
Projection of demand based on different rate of development in income, tariff and inflation........3
Supply and demand......................................................................................................................4
Aggregate demand and aggregate supply....................................................................................5
Phillips curve...............................................................................................................................7
Laffer Curve.................................................................................................................................8
Analysis of demand.......................................................................................................................11
Conclusion and Recommendation.................................................................................................17
References......................................................................................................................................19
⊘ This is a preview!⊘
Do you want full access?
Subscribe today to unlock all pages.
Trusted by 1+ million students worldwide
3ECONOMIC PRINCIPLES AND DECISION MAKING
Introduction
Expansion of a business and its profitability is closely integrated with economic
environment of a nation. Business evaluates both micro and macro-economic condition before
entering in a new market (Baker, 2014) Several factors sales volume of a business. The first
determinant of volume of sales of a business is demand. There is an inverse relation between
demand and price of a particular product. Lower the price, higher is the demand and vice-versa.
Other determinant of demand is income. Income determine the purchasing power of people and
hence influence demand decision. If the good in consideration is a normal good, then demand
increases with income (Castano, Méndez & Galindo, 2015). For inferior good demand decrease
with income. For expanding business outside the local market, business should also consider the
imposed import tariff in the targeted market.
Schmeckt Gut is planning to launch Besser energy bar in Atollia within next few months.
Before entering in the Atollia market the company needs to analyze the state of the economy in
Atollia. The market research department of Schmeckt Gut has gathered information relevant for
understanding the market condition. Survey has been conducted on demand of energy bar in
Atollia, income of the people, tariff rates on import from Industria and rate of inflation. The
objective is to project the demand of energy bars in Atollia based on relevant information
obtained from the market survey. The company wants to estimate demand for a projected change
in income, tariff and inflation. The relevant theoretical concept analyzed are supply and demand,
aggregate demand and aggregate demand, the Phillips curve and the Laffer curve. Each of this
concept has its own relevance in explain impact of different economic policies on marketing
decision of Schmeckt Gut.
Projection of demand based on different rate of development in income, tariff and inflation
Paraphrase This Document
Need a fresh take? Get an instant paraphrase of this document with our AI Paraphraser
4ECONOMIC PRINCIPLES AND DECISION MAKING
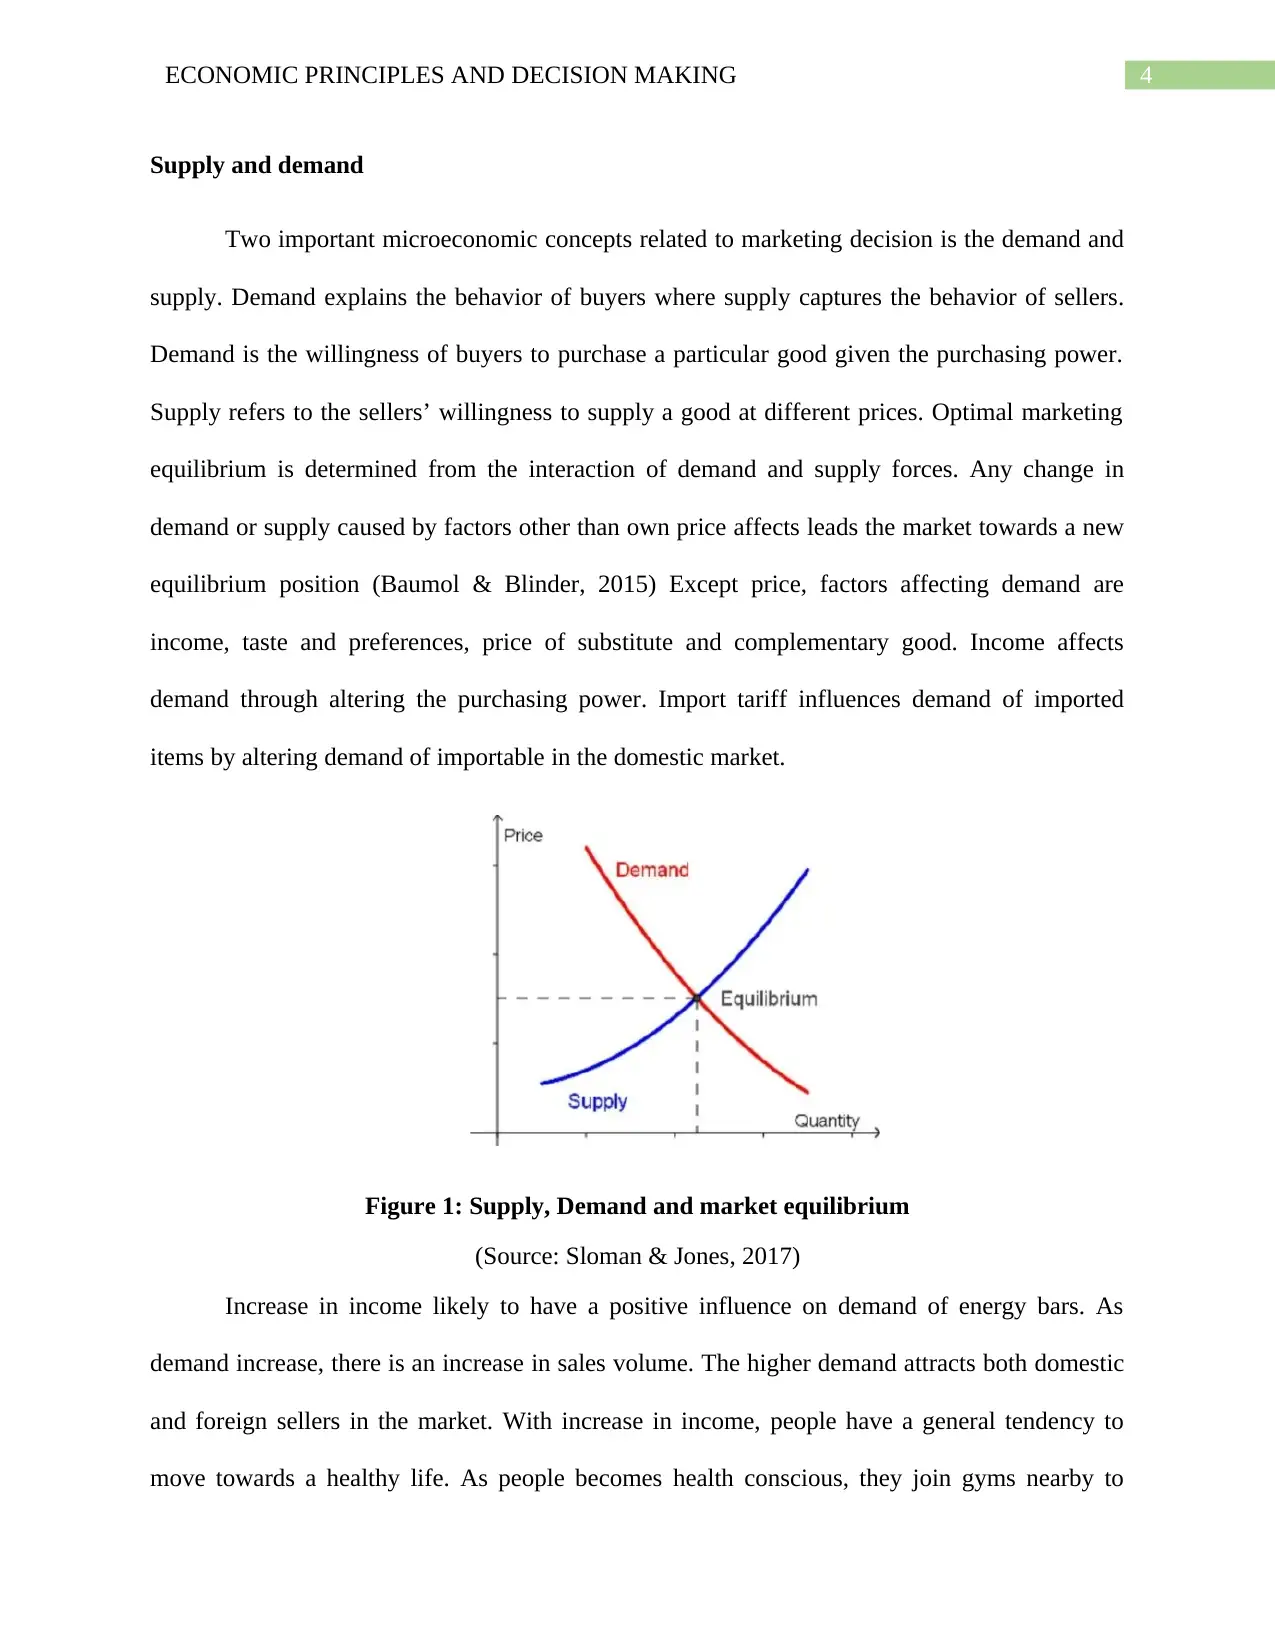
Supply and demand
Two important microeconomic concepts related to marketing decision is the demand and
supply. Demand explains the behavior of buyers where supply captures the behavior of sellers.
Demand is the willingness of buyers to purchase a particular good given the purchasing power.
Supply refers to the sellers’ willingness to supply a good at different prices. Optimal marketing
equilibrium is determined from the interaction of demand and supply forces. Any change in
demand or supply caused by factors other than own price affects leads the market towards a new
equilibrium position (Baumol & Blinder, 2015) Except price, factors affecting demand are
income, taste and preferences, price of substitute and complementary good. Income affects
demand through altering the purchasing power. Import tariff influences demand of imported
items by altering demand of importable in the domestic market.
Figure 1: Supply, Demand and market equilibrium
(Source: Sloman & Jones, 2017)
Increase in income likely to have a positive influence on demand of energy bars. As
demand increase, there is an increase in sales volume. The higher demand attracts both domestic
and foreign sellers in the market. With increase in income, people have a general tendency to
move towards a healthy life. As people becomes health conscious, they join gyms nearby to
5ECONOMIC PRINCIPLES AND DECISION MAKING
exercise regularly and stay fit. Then then need to substitute their regular diet with energy
supplement such as energy bars. This pushes up the demand for energy bars in Indonesia. People
might purchase imported energy bars if domestic producers fails to meet domestic demand or
imported energy bars have some added benefits. As demand increases, there is an increase in
price or inflation. The ultimate effect on income depends on the inflation rate. The rate of change
in nominal income is discounted by the inflation rate and produces real income or average
income. In case, increase in nominal income is larger than associated increase in inflation then
real income increases. Reverse is the case when increase in income is smaller than the increase in
rate of inflation (Hill & Schiller, 2015). Here, rate of increase in prices dominates the rate of
increase in income. The increase in imported demand alter the policy decision relating to trade. If
the government wants to protect the domestic suppliers from foreign competition, then it raises
the tariff rate. Increase in tariff rate, increases the effective price in domestic market. Such a
policy restricts volume of import in the nation. Growth in income, inflation and tariff are thus
related to each other and ultimate effect on demand for energy bars depend on the development
of these three determinant factors.
Aggregate demand and aggregate supply
The concept of demand and supply discussed above is relevant for a single market. To
understand the state of overall economy consideration should be given on interaction of
aggregate demand and aggregate supply. Aggregate demand involves demand of the entire
economy at a given point of time. It is captured by the sum of expenditures in the economy.
Expenditures in the economy include consumption expenditure, government expenditure,
investment expenditure and net export (Bernanke, Antonovics & Frank, 2015) Aggregate supply
⊘ This is a preview!⊘
Do you want full access?
Subscribe today to unlock all pages.
Trusted by 1+ million students worldwide
6ECONOMIC PRINCIPLES AND DECISION MAKING
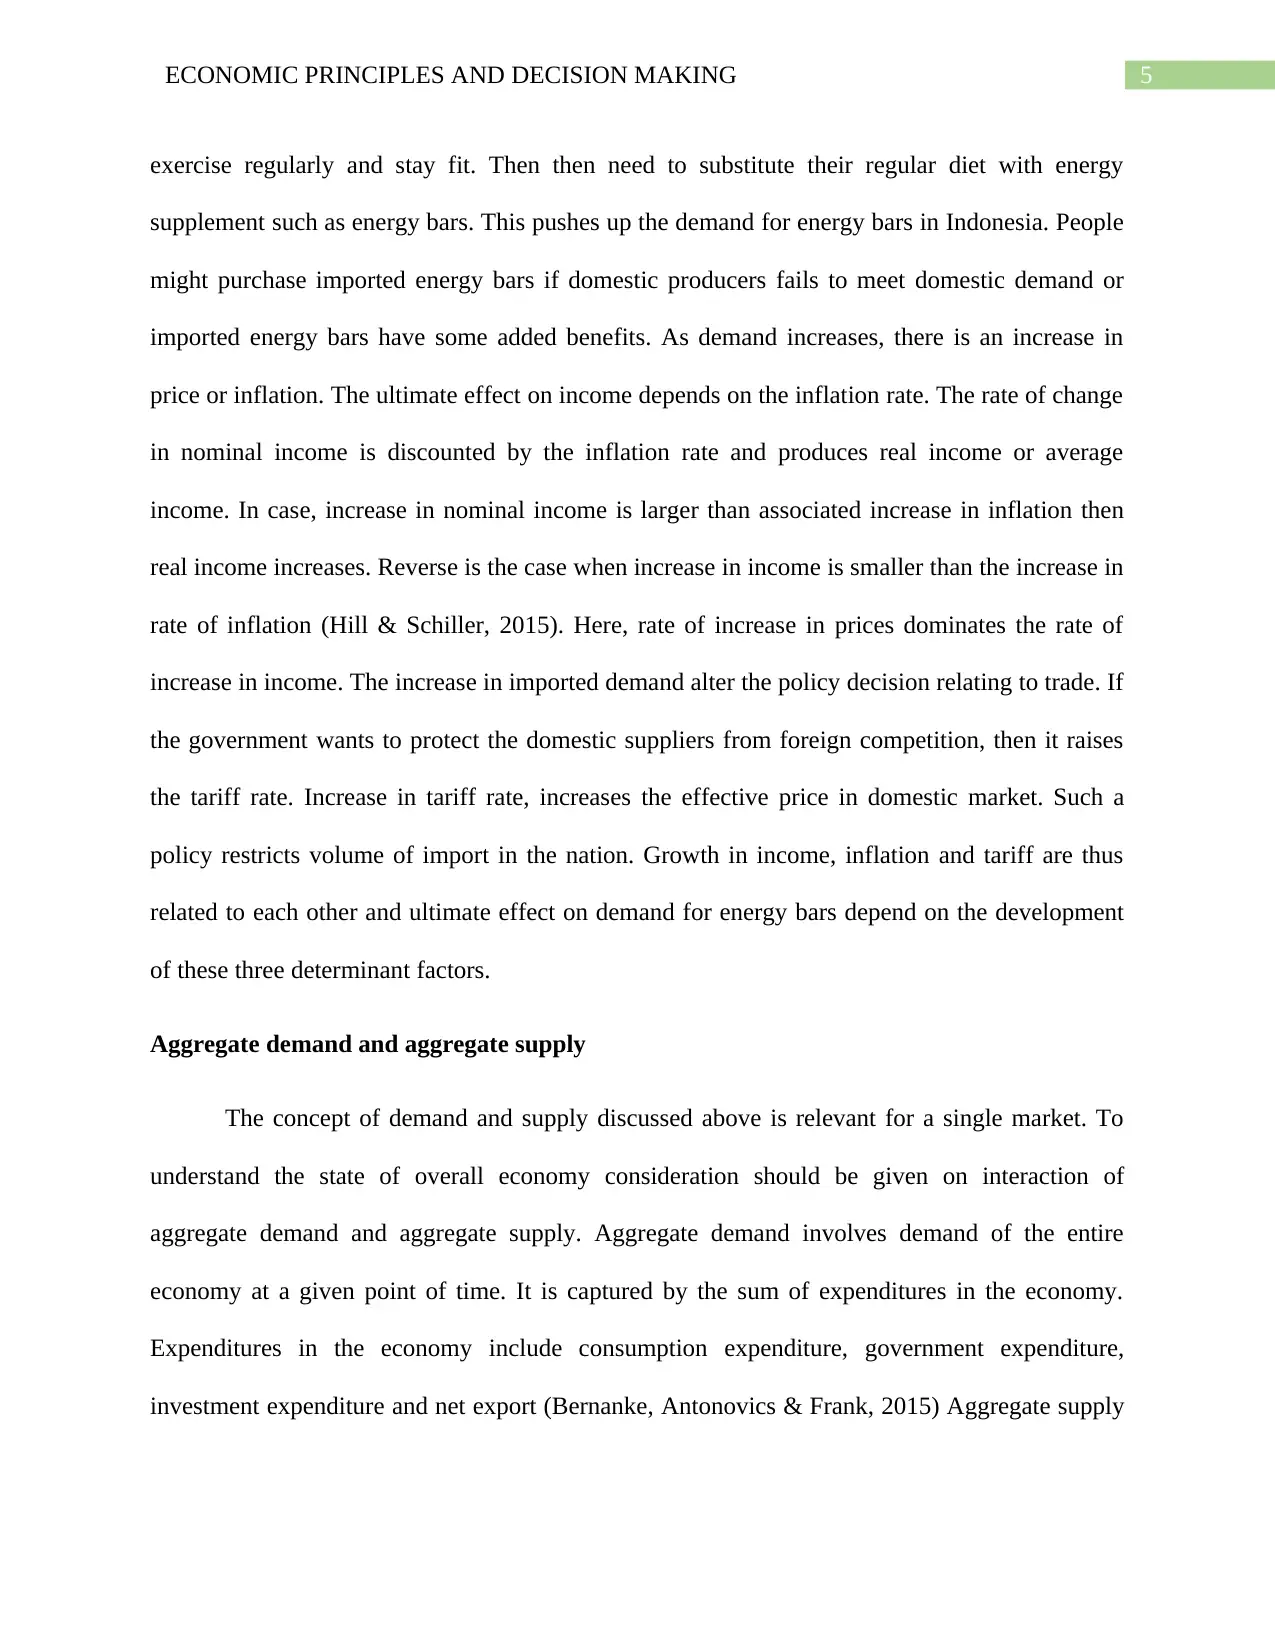
represents aggregate available quantities of goods and services in the nation. The aggregate
supply and aggregate demand together determine income and price level in a country.
Figure 2: Aggregate demand and Aggregate supply
(Source: Goodwin et al., 2015)
In the above figure, the aggregate demand curve is show by the line AD and aggregate
supply curve is shown by AS curve. Macro-economic equilibrium is obtained at point E, where
AD and AS curve intersects. The national income and price level are determined as Y and P
respectively. Any change aggregate demand, aggregate supply or both cause a change in state of
macroeconomic equilibrium and associated change in national income and price level. When
income increases following an increase in aggregate demand, average income of household
increases as well. This raises affordability of households in the economy. An increase in
aggregate demand shifts the macro-economic equilibrium upward pushing prices upward.
Inflation thus increases along with increase in aggregate demand. This is known as demand-pull
inflation. Lower import has a positive influence on aggregate demand in terms of increase in net
export (Maurice, & Thomas, 2015) Increase in tariff rate thus is policy of government to increase
Paraphrase This Document
Need a fresh take? Get an instant paraphrase of this document with our AI Paraphraser
7ECONOMIC PRINCIPLES AND DECISION MAKING
aggregate demand. This explains the inter connection on income, tariff and inflation rate in the
economy. Rise in income raises rate of inflation. This attracts foreign producers in the nation. In
order to secure the interest of the domestic producers, government then decides to restrict import
by increasing tariff.
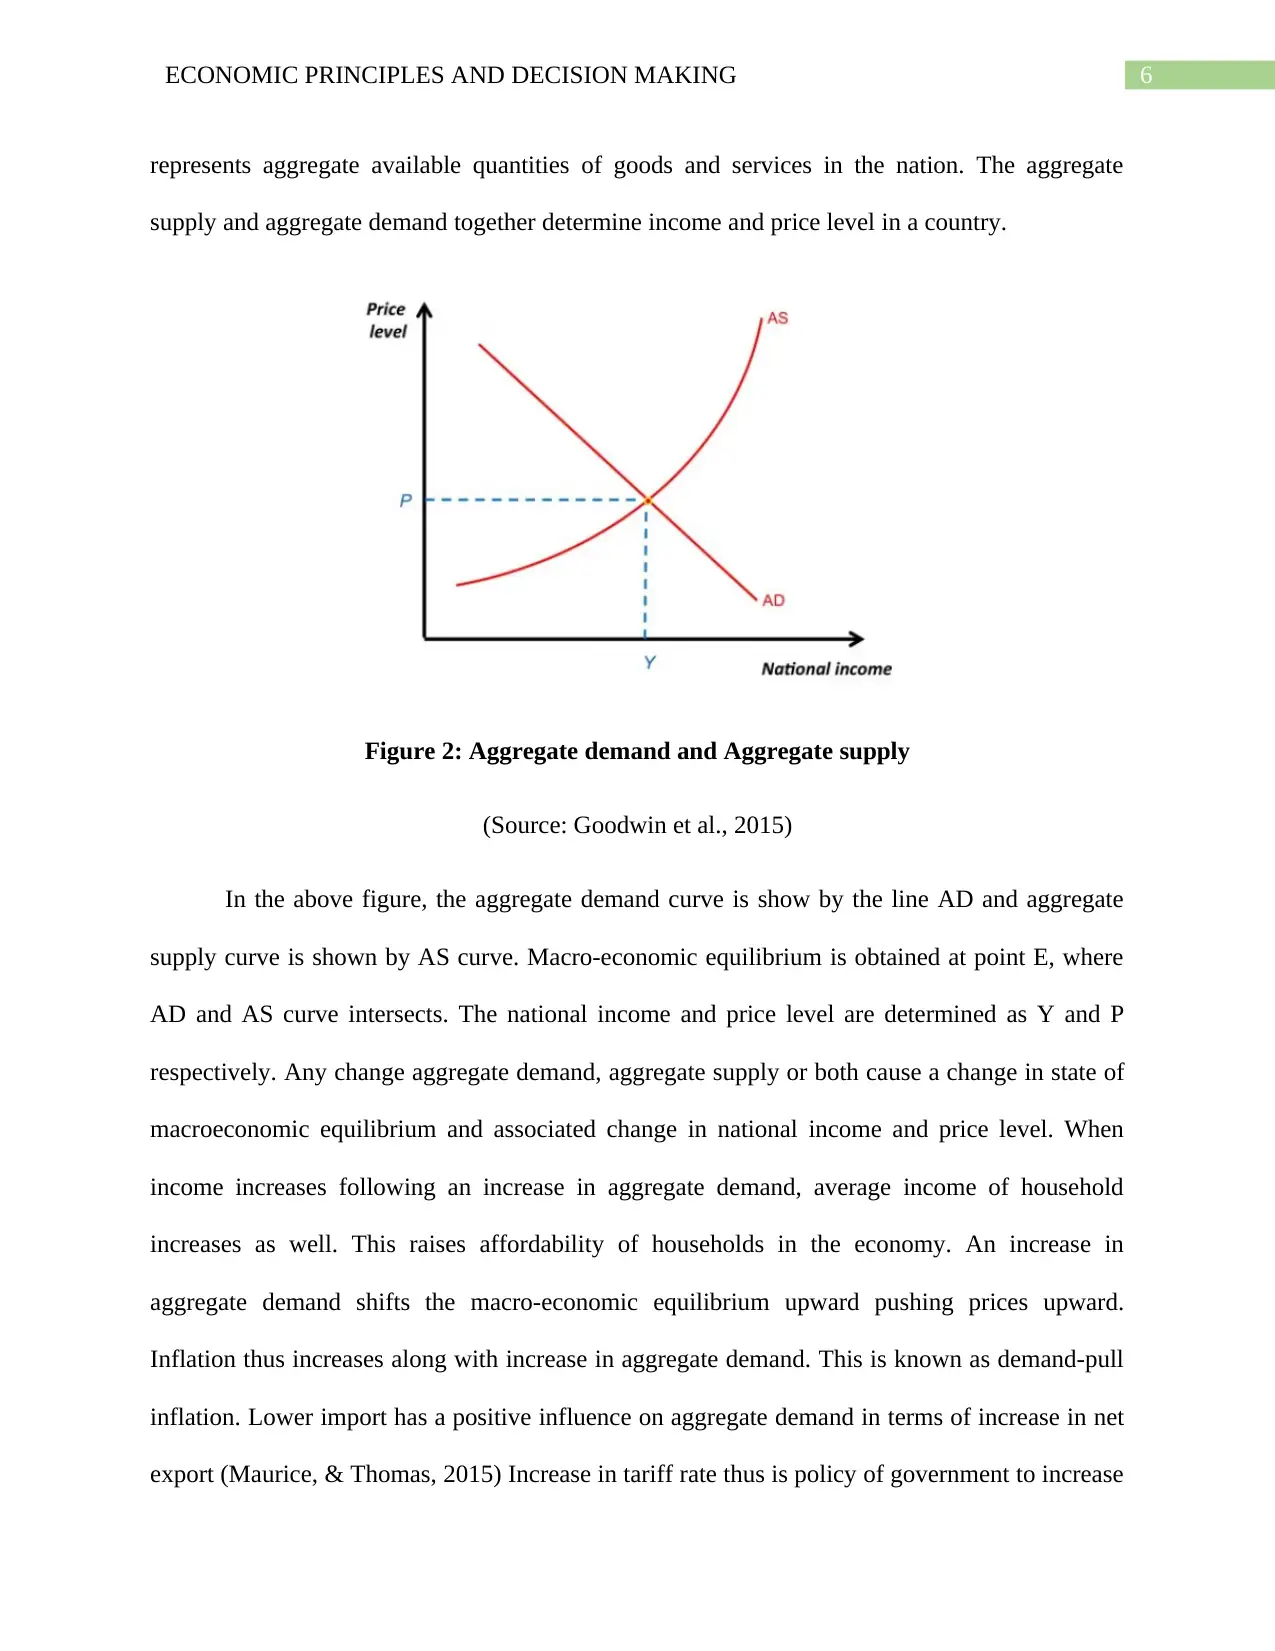
Phillips curve
The concept of Phillips cure explains the association between inflation and
unemployment rate in the economy. The concept is named after A.W. Phillips who developed
the model. The theory states that there is a stable and inverse relation between inflation and
unemployment. According to the theory, economic growth increase inflation, which should
increase job opportunities and lower unemployment (Blanchard, 2016) A low unemployment in
the economy indicates there is high demand of labor in the labor market. The higher labor
demand, increase wage in the market. In industries where labor is used as primary input, increase
in wage increase production cost. Producers then increase price to cover the wage cost resulting
in a high inflation in the economy. An increase in price level increase profitability of the
business. The higher profit encourages business to expand. This in turn increases demand for
labor and lowers unemployment.
aggregate demand. This explains the inter connection on income, tariff and inflation rate in the
economy. Rise in income raises rate of inflation. This attracts foreign producers in the nation. In
order to secure the interest of the domestic producers, government then decides to restrict import
by increasing tariff.
Phillips curve
The concept of Phillips cure explains the association between inflation and
unemployment rate in the economy. The concept is named after A.W. Phillips who developed
the model. The theory states that there is a stable and inverse relation between inflation and
unemployment. According to the theory, economic growth increase inflation, which should
increase job opportunities and lower unemployment (Blanchard, 2016) A low unemployment in
the economy indicates there is high demand of labor in the labor market. The higher labor
demand, increase wage in the market. In industries where labor is used as primary input, increase
in wage increase production cost. Producers then increase price to cover the wage cost resulting
in a high inflation in the economy. An increase in price level increase profitability of the
business. The higher profit encourages business to expand. This in turn increases demand for
labor and lowers unemployment.
8ECONOMIC PRINCIPLES AND DECISION MAKING
Figure 3: Phillips curve
(Source: Coibion & Gorodnichenko, 2015)
When there is an increase in income and associated increase in demand, price level
increase causing an increase in rate of inflation. As stated by Phillips Curve, increased inflation
causes unemployment rate in the economy to fall. As unemployment falls, there is an increase in
average income and demand.
Laffer Curve
Determining optima tax rate is one central challenge for the government. The optimal
decision regarding tax rate can be taken based on the relationship between tax rate and associated
revenue. The Laffer curve explains the relation between tax rate and tax revenue. The only
source of government funding is the revenue earned from different direct and indirect taxes.
With the objective of stimulating economic expansion, government needs to increase spending in
different areas. To fund these spending governments considers an upward revision in tax rates.
Government however should be aware that raise in tax does not always come with an increase in
tax revenue. Laffer curve depicts the particular relationship between tax rate and associated
revenue. There is an inverted U shaped relationship between tax rate and government revenue
(Miravete, Seim & Thurk, 2018) That is tax revenue initially increases with increase in tax rate.
Then the tax revenue reaches to its maximum limits and then revenue starts to fall. Tax rate
corresponds to the maximum tax revenue indicates the optimal tax rate. Increasing tax rate
beyond the optimal rate cause revenue to fall. Revenue falls to zero at the maximum level of tax.
The same argument also holds for tariff rate. Tariff is a form of tax on import. Government earns
⊘ This is a preview!⊘
Do you want full access?
Subscribe today to unlock all pages.
Trusted by 1+ million students worldwide
9ECONOMIC PRINCIPLES AND DECISION MAKING
revenue corresponding to the imposed tariff. The determination of optimal tariff rate follows the
principle of Laffer curve.
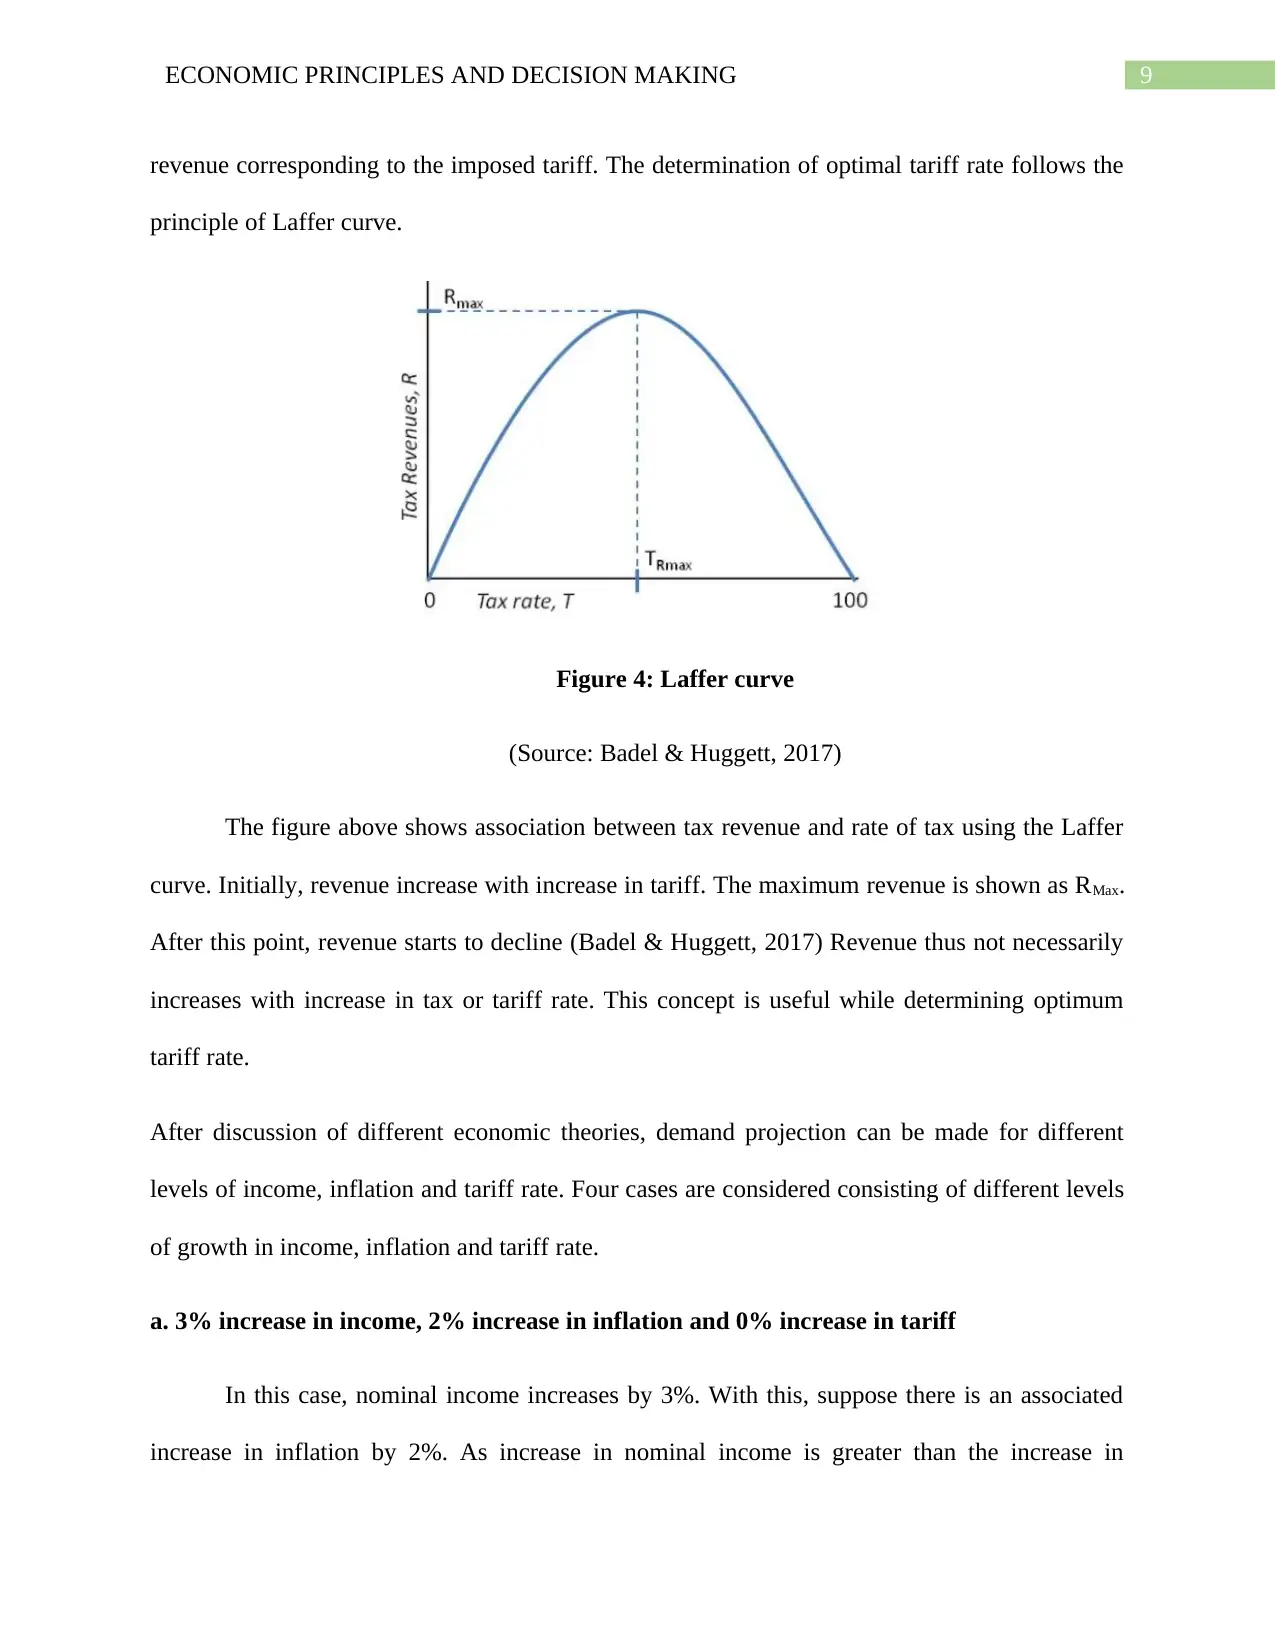
Figure 4: Laffer curve
(Source: Badel & Huggett, 2017)
The figure above shows association between tax revenue and rate of tax using the Laffer
curve. Initially, revenue increase with increase in tariff. The maximum revenue is shown as RMax.
After this point, revenue starts to decline (Badel & Huggett, 2017) Revenue thus not necessarily
increases with increase in tax or tariff rate. This concept is useful while determining optimum
tariff rate.
After discussion of different economic theories, demand projection can be made for different
levels of income, inflation and tariff rate. Four cases are considered consisting of different levels
of growth in income, inflation and tariff rate.
a. 3% increase in income, 2% increase in inflation and 0% increase in tariff
In this case, nominal income increases by 3%. With this, suppose there is an associated
increase in inflation by 2%. As increase in nominal income is greater than the increase in
revenue corresponding to the imposed tariff. The determination of optimal tariff rate follows the
principle of Laffer curve.
Figure 4: Laffer curve
(Source: Badel & Huggett, 2017)
The figure above shows association between tax revenue and rate of tax using the Laffer
curve. Initially, revenue increase with increase in tariff. The maximum revenue is shown as RMax.
After this point, revenue starts to decline (Badel & Huggett, 2017) Revenue thus not necessarily
increases with increase in tax or tariff rate. This concept is useful while determining optimum
tariff rate.
After discussion of different economic theories, demand projection can be made for different
levels of income, inflation and tariff rate. Four cases are considered consisting of different levels
of growth in income, inflation and tariff rate.
a. 3% increase in income, 2% increase in inflation and 0% increase in tariff
In this case, nominal income increases by 3%. With this, suppose there is an associated
increase in inflation by 2%. As increase in nominal income is greater than the increase in
Paraphrase This Document
Need a fresh take? Get an instant paraphrase of this document with our AI Paraphraser
10ECONOMIC PRINCIPLES AND DECISION MAKING
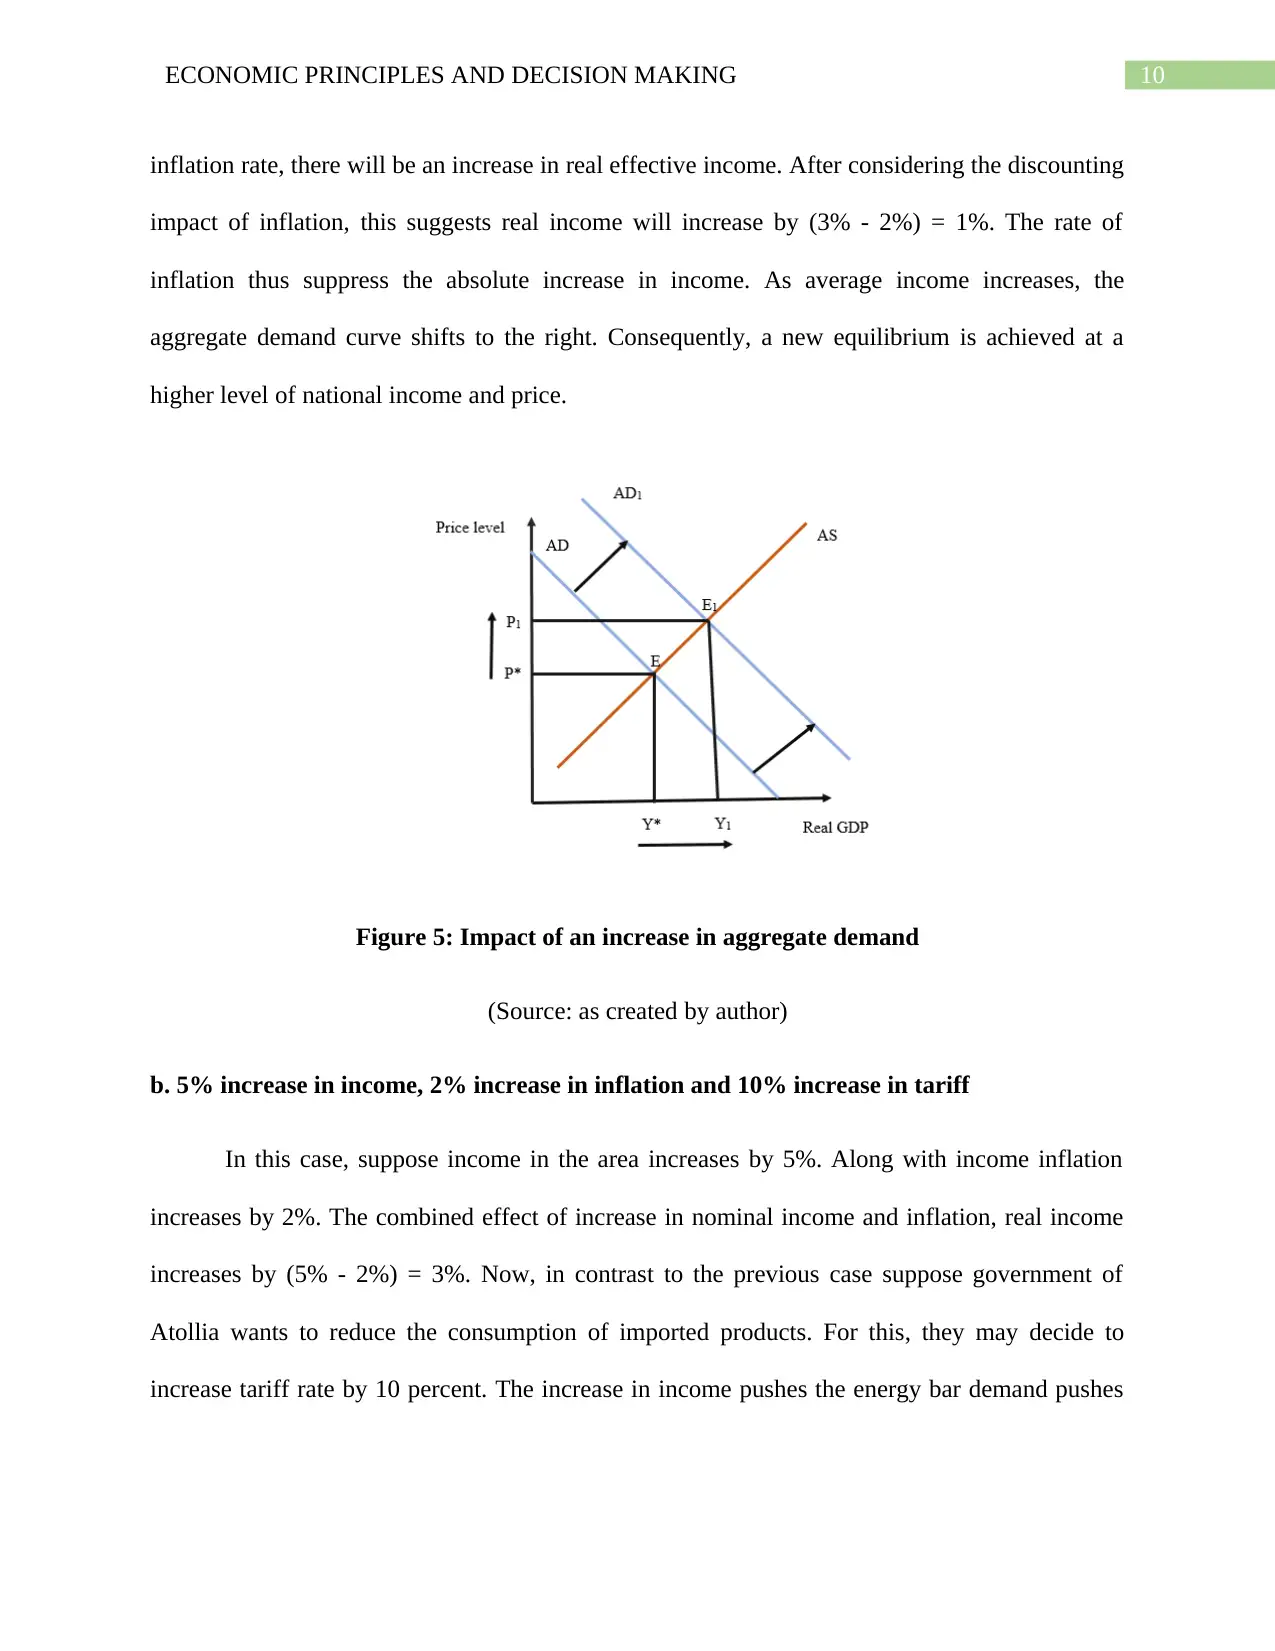
inflation rate, there will be an increase in real effective income. After considering the discounting
impact of inflation, this suggests real income will increase by (3% - 2%) = 1%. The rate of
inflation thus suppress the absolute increase in income. As average income increases, the
aggregate demand curve shifts to the right. Consequently, a new equilibrium is achieved at a
higher level of national income and price.
Figure 5: Impact of an increase in aggregate demand
(Source: as created by author)
b. 5% increase in income, 2% increase in inflation and 10% increase in tariff
In this case, suppose income in the area increases by 5%. Along with income inflation
increases by 2%. The combined effect of increase in nominal income and inflation, real income
increases by (5% - 2%) = 3%. Now, in contrast to the previous case suppose government of
Atollia wants to reduce the consumption of imported products. For this, they may decide to
increase tariff rate by 10 percent. The increase in income pushes the energy bar demand pushes
11ECONOMIC PRINCIPLES AND DECISION MAKING
up while the increase in tariff rate lowers the demand. The ultimate effect on demand depends on
relative strength of tariff and income.
c. 1% increase in income, 4% increase in inflation and 7.5% increase in tariff
Consider the case, where nominal income increases by 1% and inflation increases by 4%.
In this situation, as increase in inflation is larger than increase in income, real income would
decline by (4% - 1%) = 3%. With a decline in income, demand is projected to be declined as
well. The increase in tariff by 7.5 percent further has an adverse effect on demand for energy
bars. Both the force thus give a downward pressure on energy bar demand. The projected
demand can be obtained from the estimated demand equation.
d. 7% increase in income, 5% increase in inflation and 5% increase in tariff
Consider the scenario where income increases by 7%, inflation increases by 5% and tariff
increases by 5%. Here, increase in income exceeds the increase the rate of inflation. The real
income thus would increase by (7% - 5%) = 2%. The 5% increase in tariff further pushes the
demand downward. There are thus two alternative forces on energy bar demand. The income
effect increase demand for energy bar while increase in tariff lowers the demand. The projected
impact on demand depends on coefficient of income and tariff.
Analysis of demand
In order to analyze the market demand of energy bars the research department of Atollia
considers three determinant factors – income, tariff, number of gyms and inflation rate. The
projected demand function is given as
ln ( Demand )=a+ ( b × ln ( income ) ) + ( c × ln (tariff ) ) +(d × ln ( number of Gyms ) )+(e ×ln ( inflation ) )
⊘ This is a preview!⊘
Do you want full access?
Subscribe today to unlock all pages.
Trusted by 1+ million students worldwide
1 out of 25
Related Documents


Your All-in-One AI-Powered Toolkit for Academic Success.
+13062052269
info@desklib.com
Available 24*7 on WhatsApp / Email
![[object Object]](/_next/static/media/star-bottom.7253800d.svg)
Unlock your academic potential
Copyright © 2020–2026 A2Z Services. All Rights Reserved. Developed and managed by ZUCOL.