ECON 6000 - Schmeckt Gut Case: Economic Principles & Decisions
VerifiedAdded on 2023/06/13
|10
|1838
|345
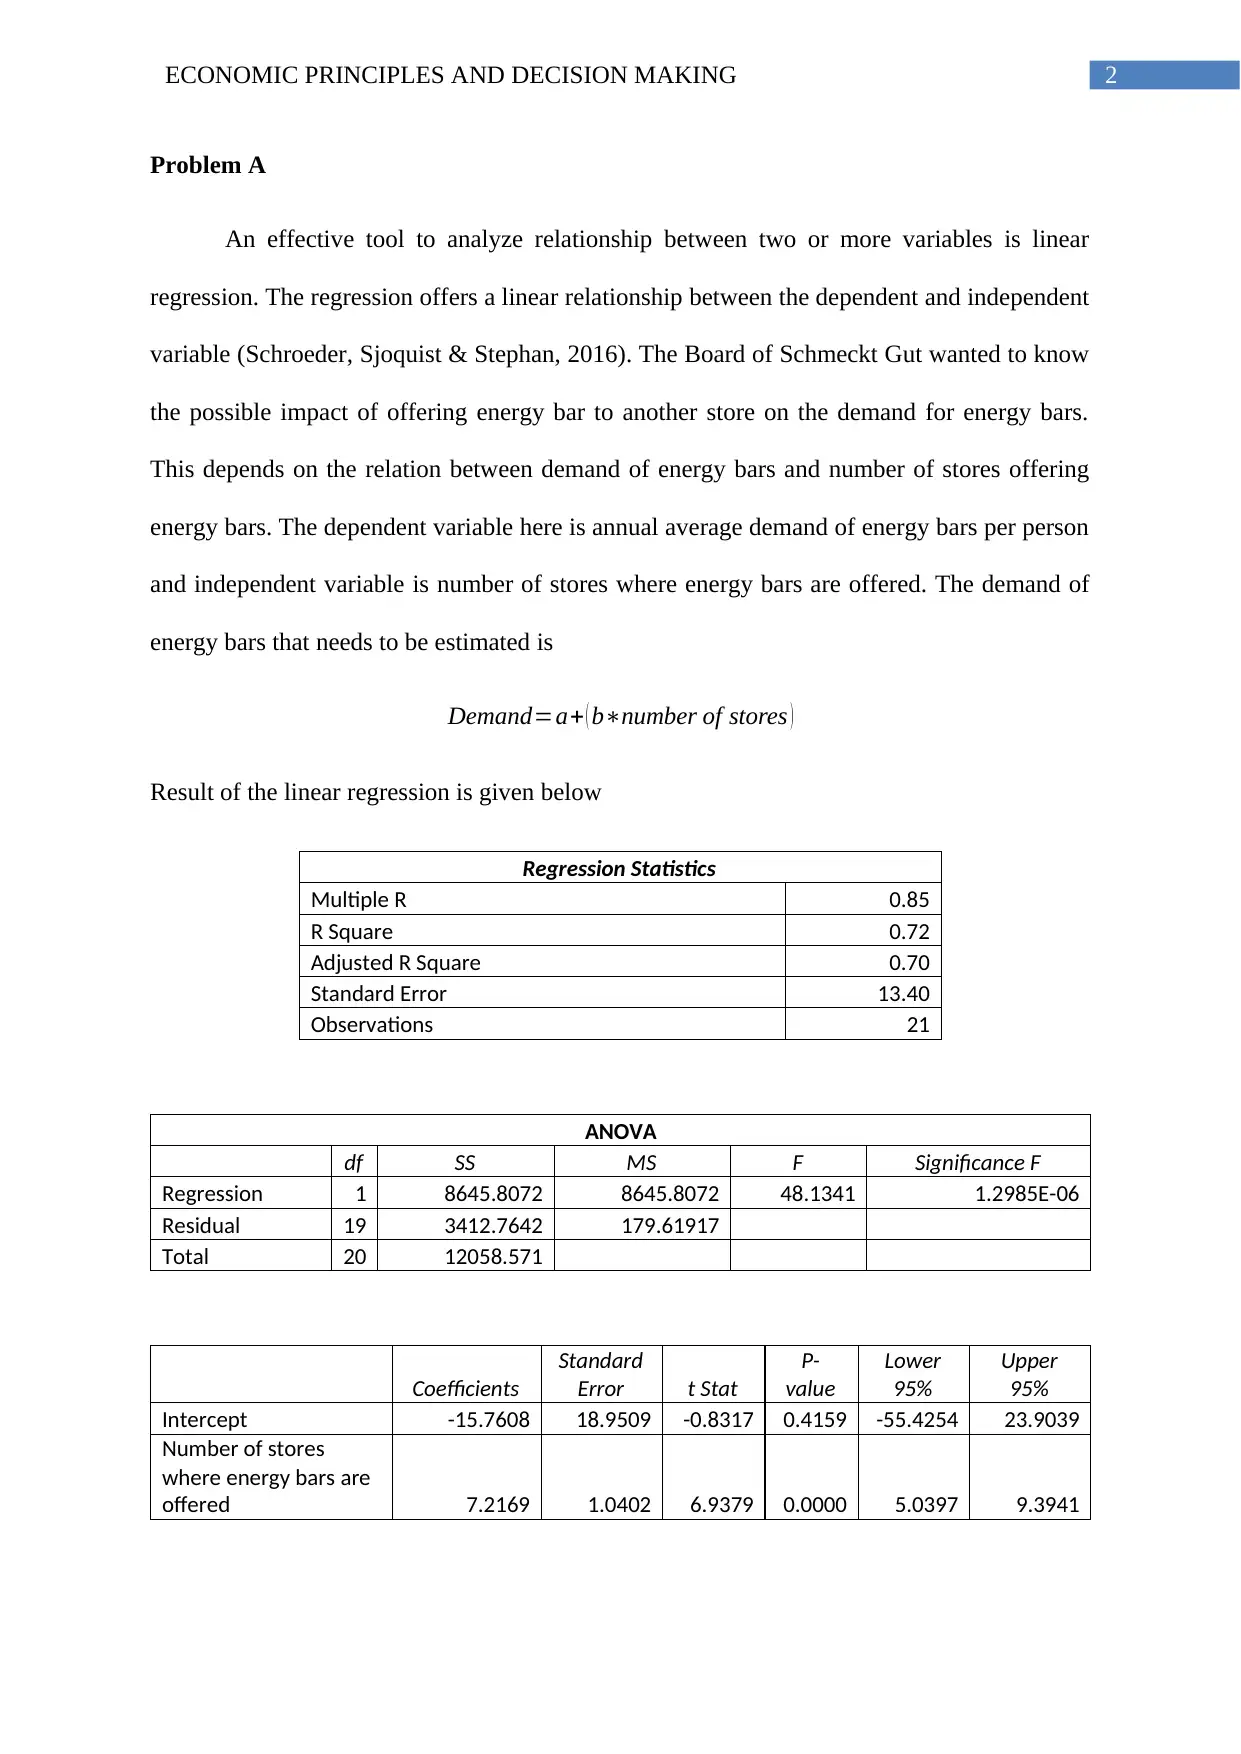
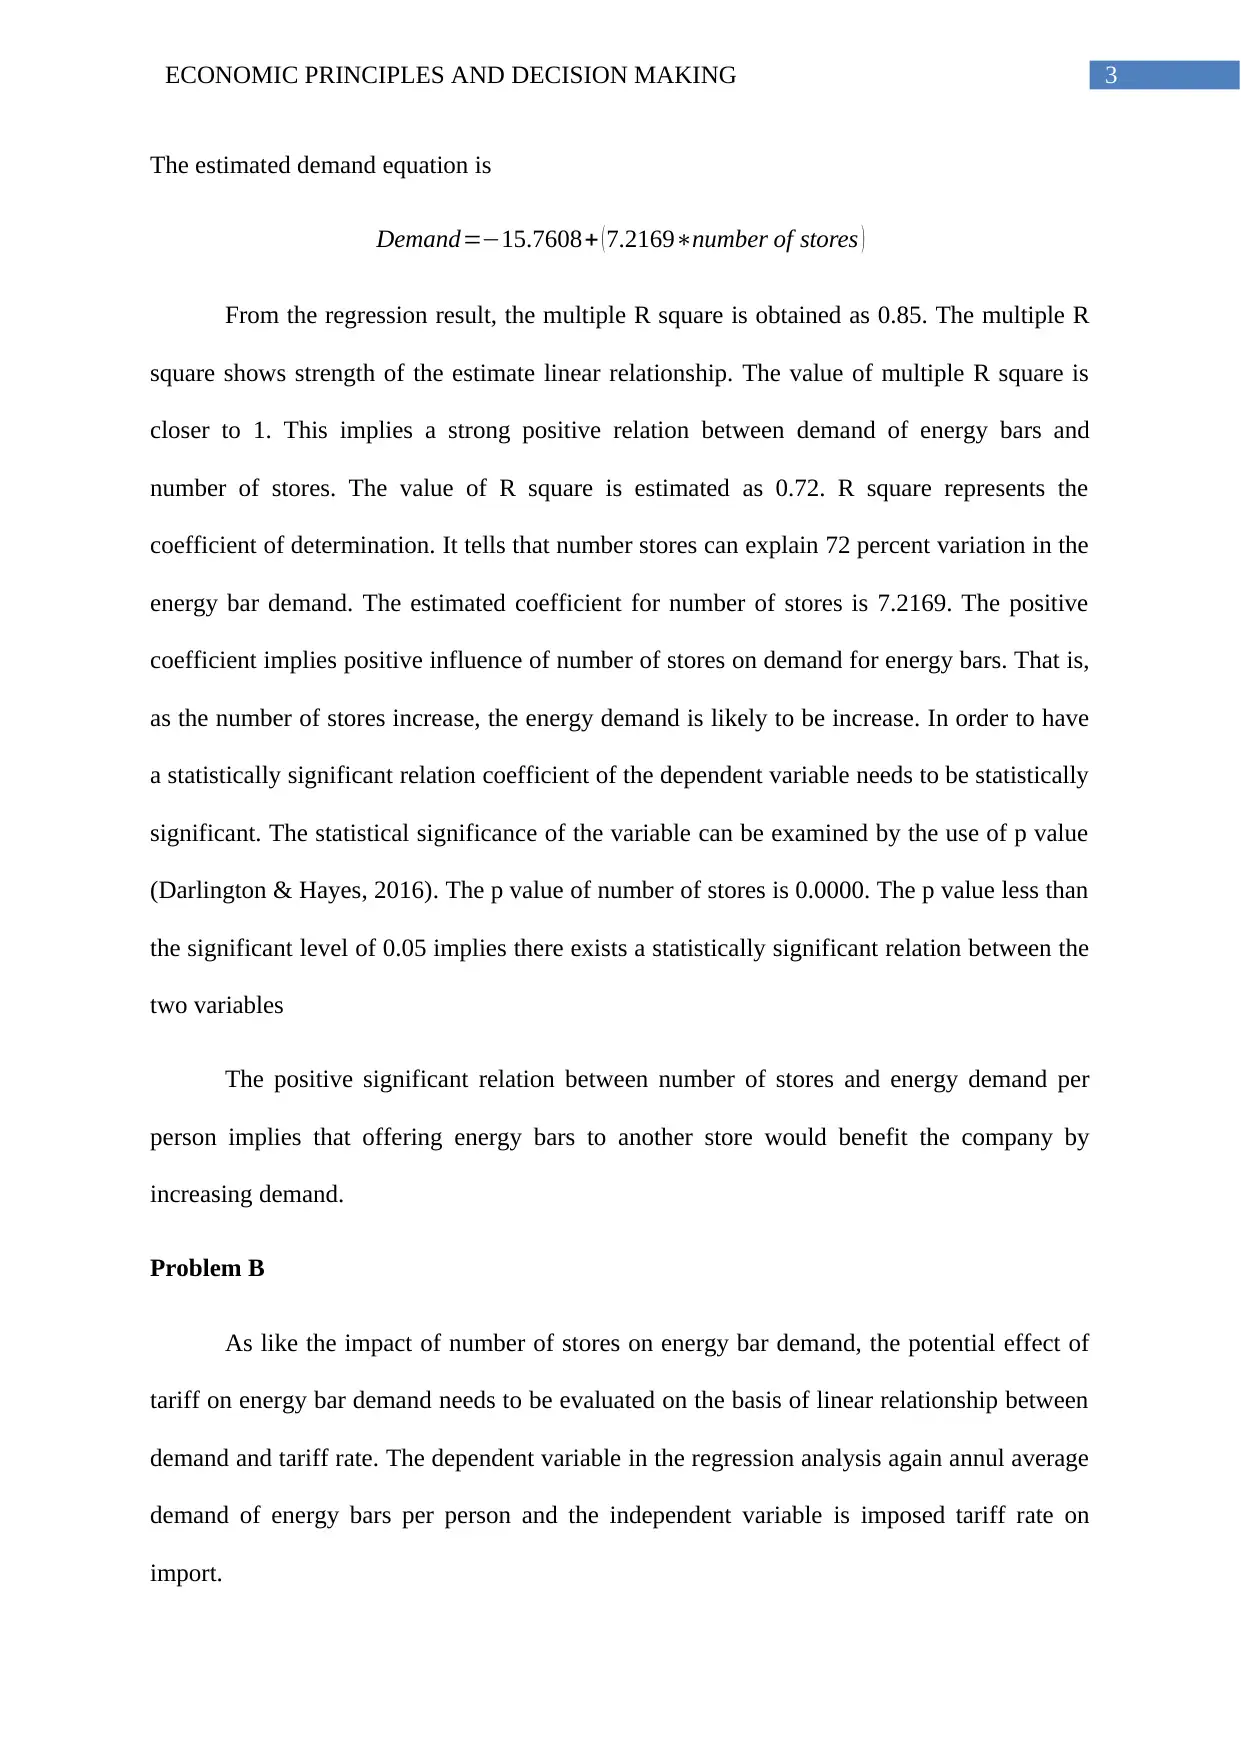
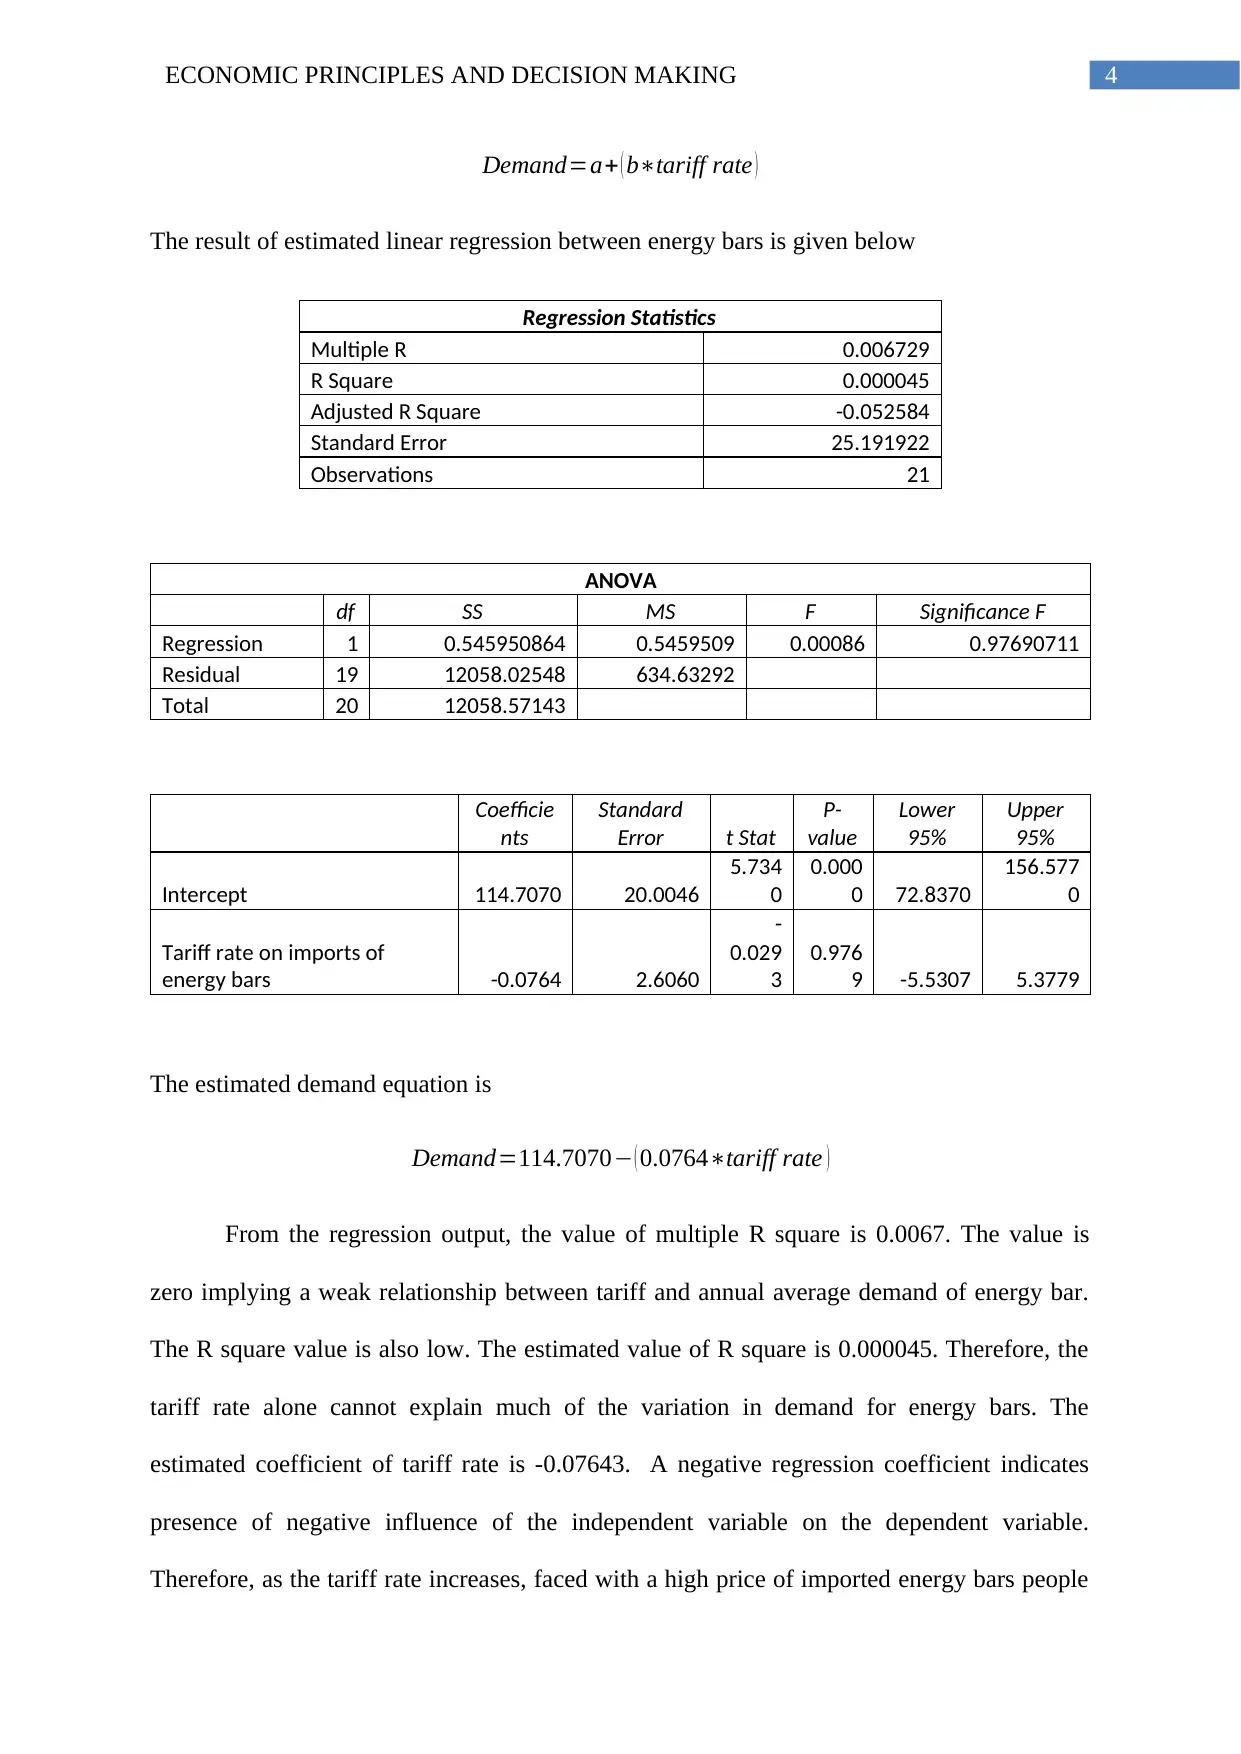
Report
AI Summary
This report analyzes the economic principles behind decision-making using the Schmeckt Gut case study. It employs linear regression to assess the impact of store expansion and tariff rates on energy bar demand. The analysis reveals a strong positive correlation between the number of stores and demand, while tariff rates show a negative but statistically insignificant impact. Furthermore, the report discusses the benefits of free trade and potential distortions from trade regulations, highlighting the importance of international trade for companies like Schmeckt Gut. The document also includes relevant graphs and regression outputs to support its findings. Desklib provides a platform for students to access this and similar assignments for their study needs.

1 out of 10
Related Documents


Your All-in-One AI-Powered Toolkit for Academic Success.
+13062052269
info@desklib.com
Available 24*7 on WhatsApp / Email
![[object Object]](/_next/static/media/star-bottom.7253800d.svg)
Copyright © 2020–2026 A2Z Services. All Rights Reserved. Developed and managed by ZUCOL.