Economic Assignment: Demand Function Estimation and Recommendations

Verified

Added on  2019/10/31

|8
|1409
|314
Report
AI Summary
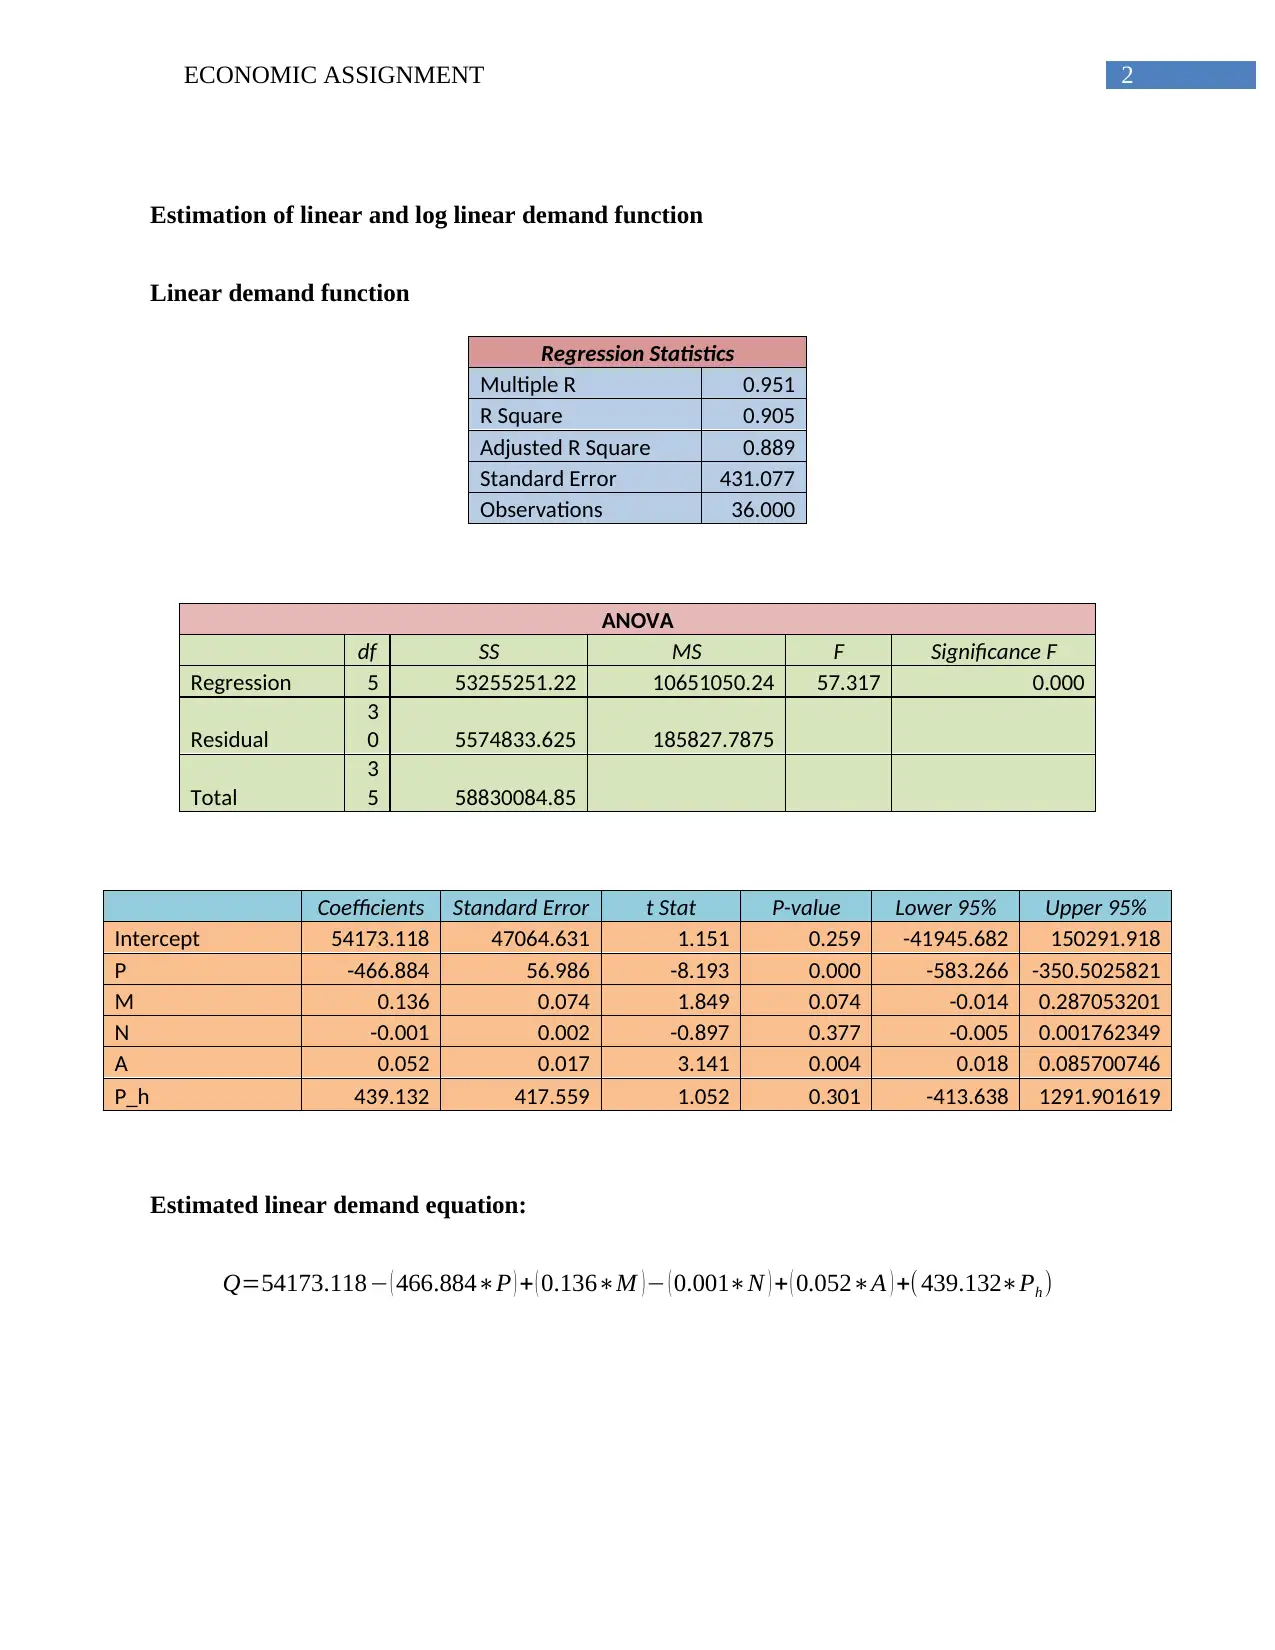
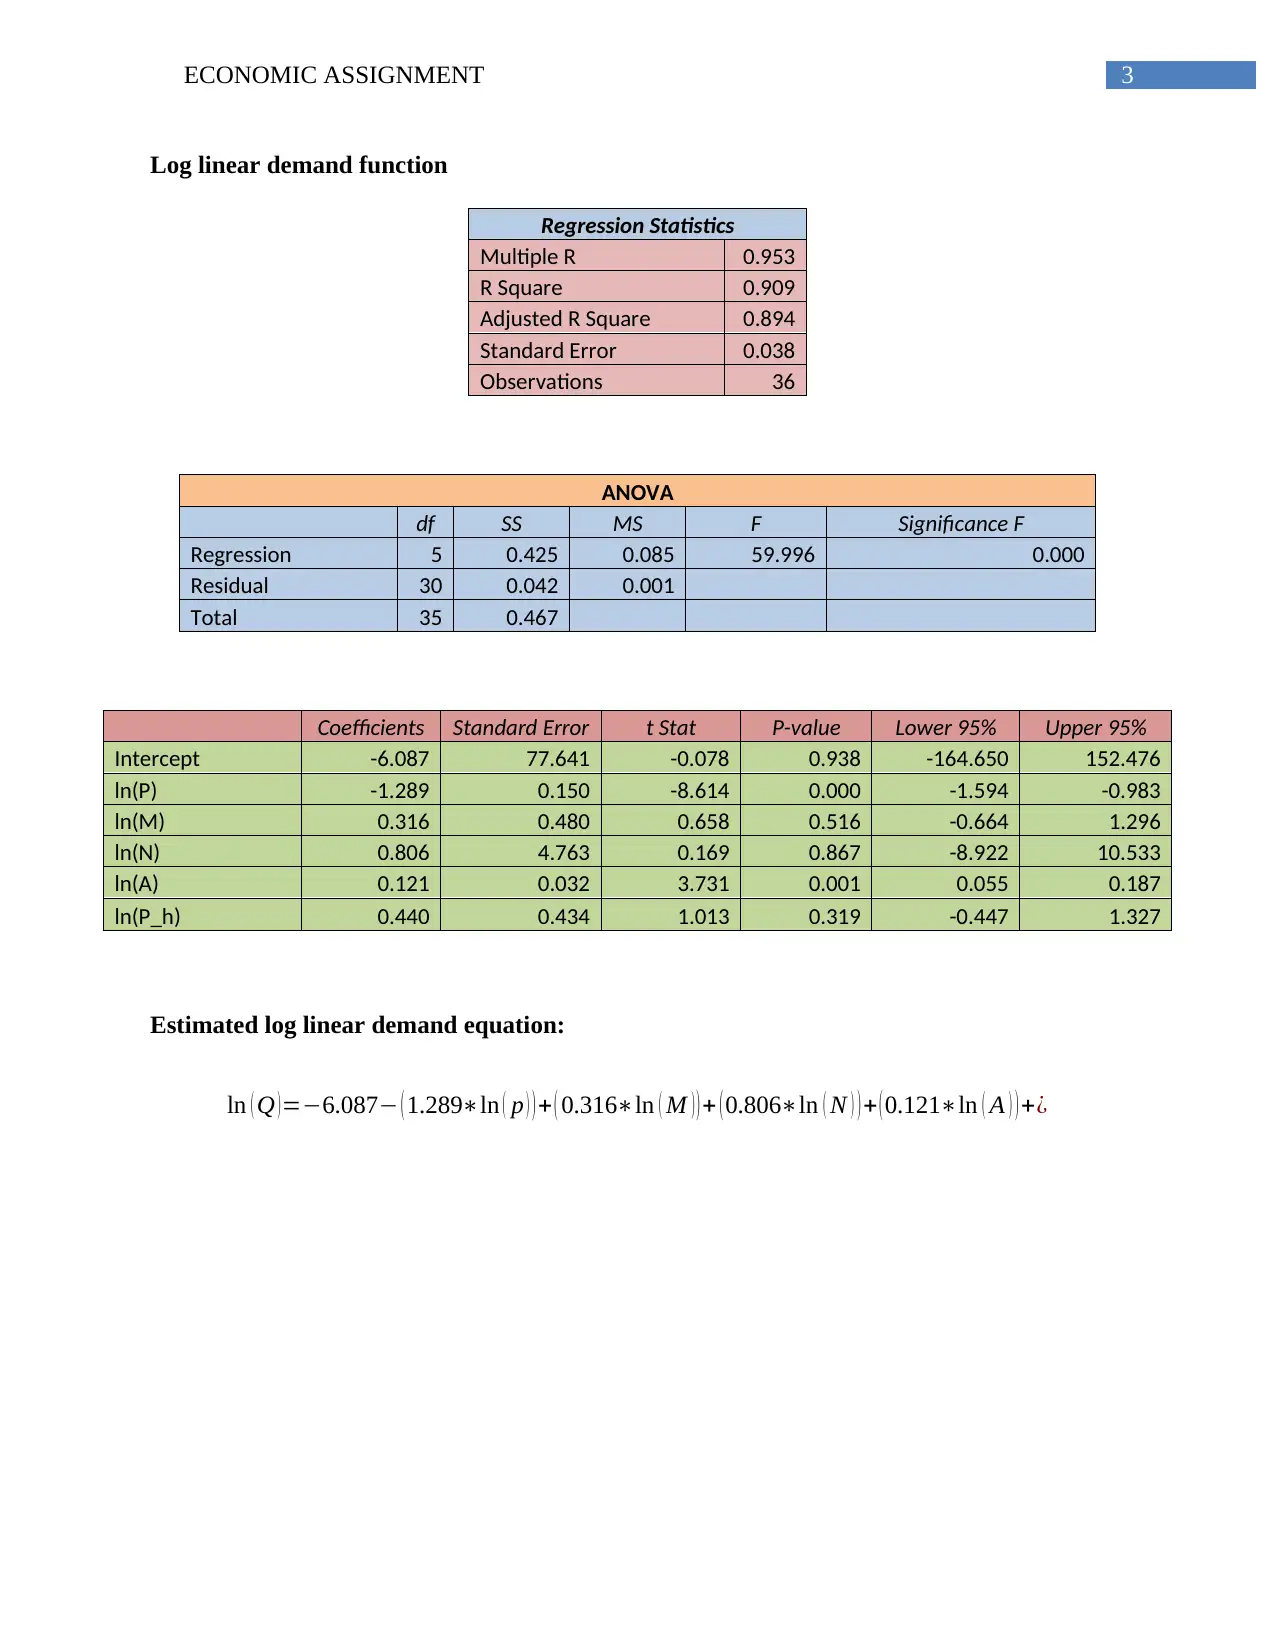
This report presents an economic analysis of the demand for Quick kits, a hepatitis diagnostic tool. The analysis employs both linear and log linear demand functions to identify factors influencing sales. Key variables considered include the product's price, disposable income, advertising expenditure, national population, and the price of a competitor's product (Hepa test). Regression analysis is used to estimate the demand functions, with the results indicating that price and advertising expenditure significantly impact sales. The report includes an interpretation of the estimated demand functions, highlighting the statistical significance of the coefficients and the explanatory power of the models. Based on the analysis, recommendations are made to senior management, emphasizing the importance of pricing strategies and advertising investment to boost sales. The report concludes with a summary of the findings and a bibliography of cited sources.
Document Page
Running head: ECONOMIC ASSIGNMENT
Economic Assignment
Course Title
Name of the Student
Name of the University
Author note
tabler-icon-diamond-filled.svg

Paraphrase This Document

Need a fresh take? Get an instant paraphrase of this document with our AI Paraphraser
Document Page
1ECONOMIC ASSIGNMENT
Table of Contents
Estimation of linear and log linear demand function.......................................................................2
Linear demand function...............................................................................................................2
Log linear demand function.........................................................................................................3
Interpretation of Estimated demand functions.................................................................................4
Recommendation to senior management.........................................................................................5
Summary of analysis and recommendation.....................................................................................5
Bibliography....................................................................................................................................7
Document Page
2ECONOMIC ASSIGNMENT
Estimation of linear and log linear demand function
Linear demand function
Regression Statistics
Multiple R 0.951
R Square 0.905
Adjusted R Square 0.889
Standard Error 431.077
Observations 36.000
ANOVA
df SS MS F Significance F
Regression 5 53255251.22 10651050.24 57.317 0.000
Residual
3
0 5574833.625 185827.7875
Total
3
5 58830084.85
Coefficients Standard Error t Stat P-value Lower 95% Upper 95%
Intercept 54173.118 47064.631 1.151 0.259 -41945.682 150291.918
P -466.884 56.986 -8.193 0.000 -583.266 -350.5025821
M 0.136 0.074 1.849 0.074 -0.014 0.287053201
N -0.001 0.002 -0.897 0.377 -0.005 0.001762349
A 0.052 0.017 3.141 0.004 0.018 0.085700746
P_h 439.132 417.559 1.052 0.301 -413.638 1291.901619
Estimated linear demand equation:
Q=54173.118 ( 466.884P ) + ( 0.136M ) ( 0.001N ) + ( 0.052A ) +( 439.132Ph )
Document Page
3ECONOMIC ASSIGNMENT
Log linear demand function
Regression Statistics
Multiple R 0.953
R Square 0.909
Adjusted R Square 0.894
Standard Error 0.038
Observations 36
ANOVA
df SS MS F Significance F
Regression 5 0.425 0.085 59.996 0.000
Residual 30 0.042 0.001
Total 35 0.467
Coefficients Standard Error t Stat P-value Lower 95% Upper 95%
Intercept -6.087 77.641 -0.078 0.938 -164.650 152.476
ln(P) -1.289 0.150 -8.614 0.000 -1.594 -0.983
ln(M) 0.316 0.480 0.658 0.516 -0.664 1.296
ln(N) 0.806 4.763 0.169 0.867 -8.922 10.533
ln(A) 0.121 0.032 3.731 0.001 0.055 0.187
ln(P_h) 0.440 0.434 1.013 0.319 -0.447 1.327
Estimated log linear demand equation:
ln ( Q )=6.087 ( 1.289ln ( p ) ) + ( 0.316ln ( M ) ) + ( 0.806ln ( N ) ) + ( 0.121ln ( A ) ) +¿
tabler-icon-diamond-filled.svg

Paraphrase This Document

Need a fresh take? Get an instant paraphrase of this document with our AI Paraphraser
Document Page
4ECONOMIC ASSIGNMENT
Interpretation of Estimated demand functions
In the demand function, the dependent variable is number of Quick kits sold, Q. Apart
from own price of Quick kits, P, there are other factors influencing demand for Quick kits. In
determining demand for any good disposable income plays an important role. After tax income
or disposable income for determining demand is denoted as M. ‘N’ denotes national population.
Advertising expenditure is noted as the variable A. The only substitute product for Quick kits is
Hepa test. Hence, price of Heap test is also included in the demand function and denoted as P_h.
The linear demand regression has a R square value of .905. This implies the explanatory
variables together explain 90.5% variation in demand for Quick kits.For the linear demand
function, value of intercept is 54173.118. The intercept is not significant as the p value is .259
(greater than 0.05). The coefficient for own price is -466.884. The variable is statistically
significant. This implies there is a significantly negative relation between price and number of
Quick kits sold. Co-efficient of the variable, describing after tax income is positive with value
being 0.136. However, the variable is not statistically significant. National population is
negatively related with demand for Quick kits but again it is insignificant. The next variable
taken for consideration is advertising expenditure. The co-efficient is positive and significant.
Price of heap test has a positive impact on demand like any other substitute good. This is not a
significant variable.
Next, the log linear demand function is estimated. The R square value here is .909. This
means the independent variables are good estimators of demand for Quick kits. They explained
here 90.9% demand variation in Quick kits. The values of coefficients and intercept are reduced
as compared to simple linear demand function. The results are more or less same. Price for Quick
kits is negative and significant. After tax, income positively affects demand but not significantly.
Document Page
5ECONOMIC ASSIGNMENT
The variable national population is positive here, which was negative while considering linear
demand function. However, for both the demand model this variable is insignificant. Advertising
expenditure is positive and significant as like the previous case. The price of its only competitor
product heap test is likely to have a positive impact on demand. Since, the variable is not
significant, MedDiagno can easily sustain its monopoly position.
Recommendation to senior management
The senior management should consider the demand functions before designing
marketing strategy. The demand functions suggest that only price and advertising expenditure
are the two demand influencing factors. Therefore, to increase sales of Quick kits focus should
be given on these two factors.
Price of quick kits is negatively related with demand. Therefore, as price reduces demand
increases. When Med Diagno offer a lower price for Hepatitis diagnostic tool kit, then more
people will buy the product. Another way to increases sales is to increase expenditure on
advertising. The effect on advertising expenditure on Quick kit demand is positive. Therefore,
advertising expenditure can be increased to promote sales of the medical diagnostic tool. Though
competitor’s product price seems insignificant in the analysis, Med Diagno should always be
ware of its competitor’s strategy to capture a greater market share.
Summary of analysis and recommendation
In the report, an analysis is made on demand for a hepatitis diagnostic tool, Quick kit, by
considering both linear and non-linear demand function. Different demand influencing factors
are considered for demand analysis. These factors include price of the tool kit, average income of
Document Page
6ECONOMIC ASSIGNMENT
the household after payment of tax, expenditure on advertising, national population and finally
price of the competitor good, hepa test. The result for both the demand function is more or less
same. Price of Quick kit and advertising expenditure are appeared as two factors affecting sales
of Quick kits. Income has a positive but non-significant affect on demand. The only competitor’s
product Hepa test does not have a significant effect on demand. Average disposable income does
not influence demand. National population again does not influence demand.
Recommendations have been made based on the estimated demand equation.
Management should focus on offering a low price for Quick kits. Advertisement expenditure can
also be increased to increase sale and profit of Med Diagno.
Current market price of Quick kit is $30.00. The price is not optimal, as quantity demand
is not optimized with this price. When price decreases below $30 then demand increases. This is
also supported from regression result of demand. Average advertising expenditure over the last
three years is $22,917. In the last three years, investment on advertising expenditure had
remained fluctuating. However, investment on advertising is a good investment as it has a
positive influence on number of Quick kits.
tabler-icon-diamond-filled.svg

Paraphrase This Document

Need a fresh take? Get an instant paraphrase of this document with our AI Paraphraser
Document Page
7ECONOMIC ASSIGNMENT
Bibliography
Cameron, A. C., & Trivedi, P. K. (2013). Regression analysis of count data(Vol. 53). Cambridge
university press.
Chatterjee, S., & Hadi, A. S. (2015). Regression analysis by example. John Wiley & Sons.
Draper, N. R., & Smith, H. (2014). Applied regression analysis. John Wiley & Sons.
Faraway, J. J. (2016). Extending the linear model with R: generalized linear, mixed effects and
nonparametric regression models (Vol. 124). CRC press.
Grégoire, G. (2014). Multiple linear regression. European Astronomical Society Publications
Series, 66, 45-72.
Harrell Jr, F. E. (2015). Regression modeling strategies: with applications to linear models,
logistic and ordinal regression, and survival analysis. Springer.
Harrell Jr, F. E. (2015). Regression modeling strategies: with applications to linear models,
logistic and ordinal regression, and survival analysis. Springer.
Nassif, A. B., Ho, D., & Capretz, L. F. (2013). Towards an early software estimation using log-
linear regression and a multilayer perceptron model. Journal of Systems and
Software, 86(1), 144-160.
chevron_up_icon
1 out of 8
circle_padding
hide_on_mobile
zoom_out_icon
[object Object]