Economic Report: Determinants of Demand, Supply, and Price Elasticity
VerifiedAdded on 2021/01/02
|12
|2431
|443
Report
AI Summary
This report provides a comprehensive analysis of the economic environment, focusing on the determinants of demand and supply, including factors like price and income. It delves into the concept of price elasticity, exploring its different types and illustrating their impact with examples, including an analysis of McDonald's. The report also examines macroeconomic objectives, particularly full employment and price stability, and discusses the roles of monetary and fiscal policies in regulating domestic product growth. It concludes by summarizing the key findings and referencing relevant sources. The report provides insights into how various economic factors influence consumer behavior, market dynamics, and government interventions.
ECONOMIC
ENVIRONMENT
ENVIRONMENT
Paraphrase This Document
Need a fresh take? Get an instant paraphrase of this document with our AI Paraphraser
Table of Contents
INTRODUCTION...........................................................................................................................1
MAIN BODY...................................................................................................................................1
Changes in determinants of demand............................................................................................1
Changes in determinants of supply..............................................................................................3
The influence of price elasticity in determining price.................................................................4
Different types of elasticity..........................................................................................................6
The impact of two different types of elasticity in chosen product or service..............................7
Two government macro-economic objectives.............................................................................7
The role of monetary and fiscal policies in regulating domestic product growth.......................8
CONCLUSION................................................................................................................................8
REFERENCES................................................................................................................................9
INTRODUCTION
Economic environment refers to factors of economics which affects behavior of
consumers (Metcalfe, ed., 2018). It consists of all external factors in market and economy. The
report will lay emphasis on changes in determinants of supply and demand. Also, it will lay
focus on influence on price elasticity. The different types of elasticity will also be determined in
the report. The impact of different types of elasticity on McDonald's will be discussed in the
report. This report will be focusing on macro-economic objectives and role of monetary and
fiscal policy in regulation of domestic product.
MAIN BODY
Changes in determinants of demand.
Some demand determinants will discuss below as :
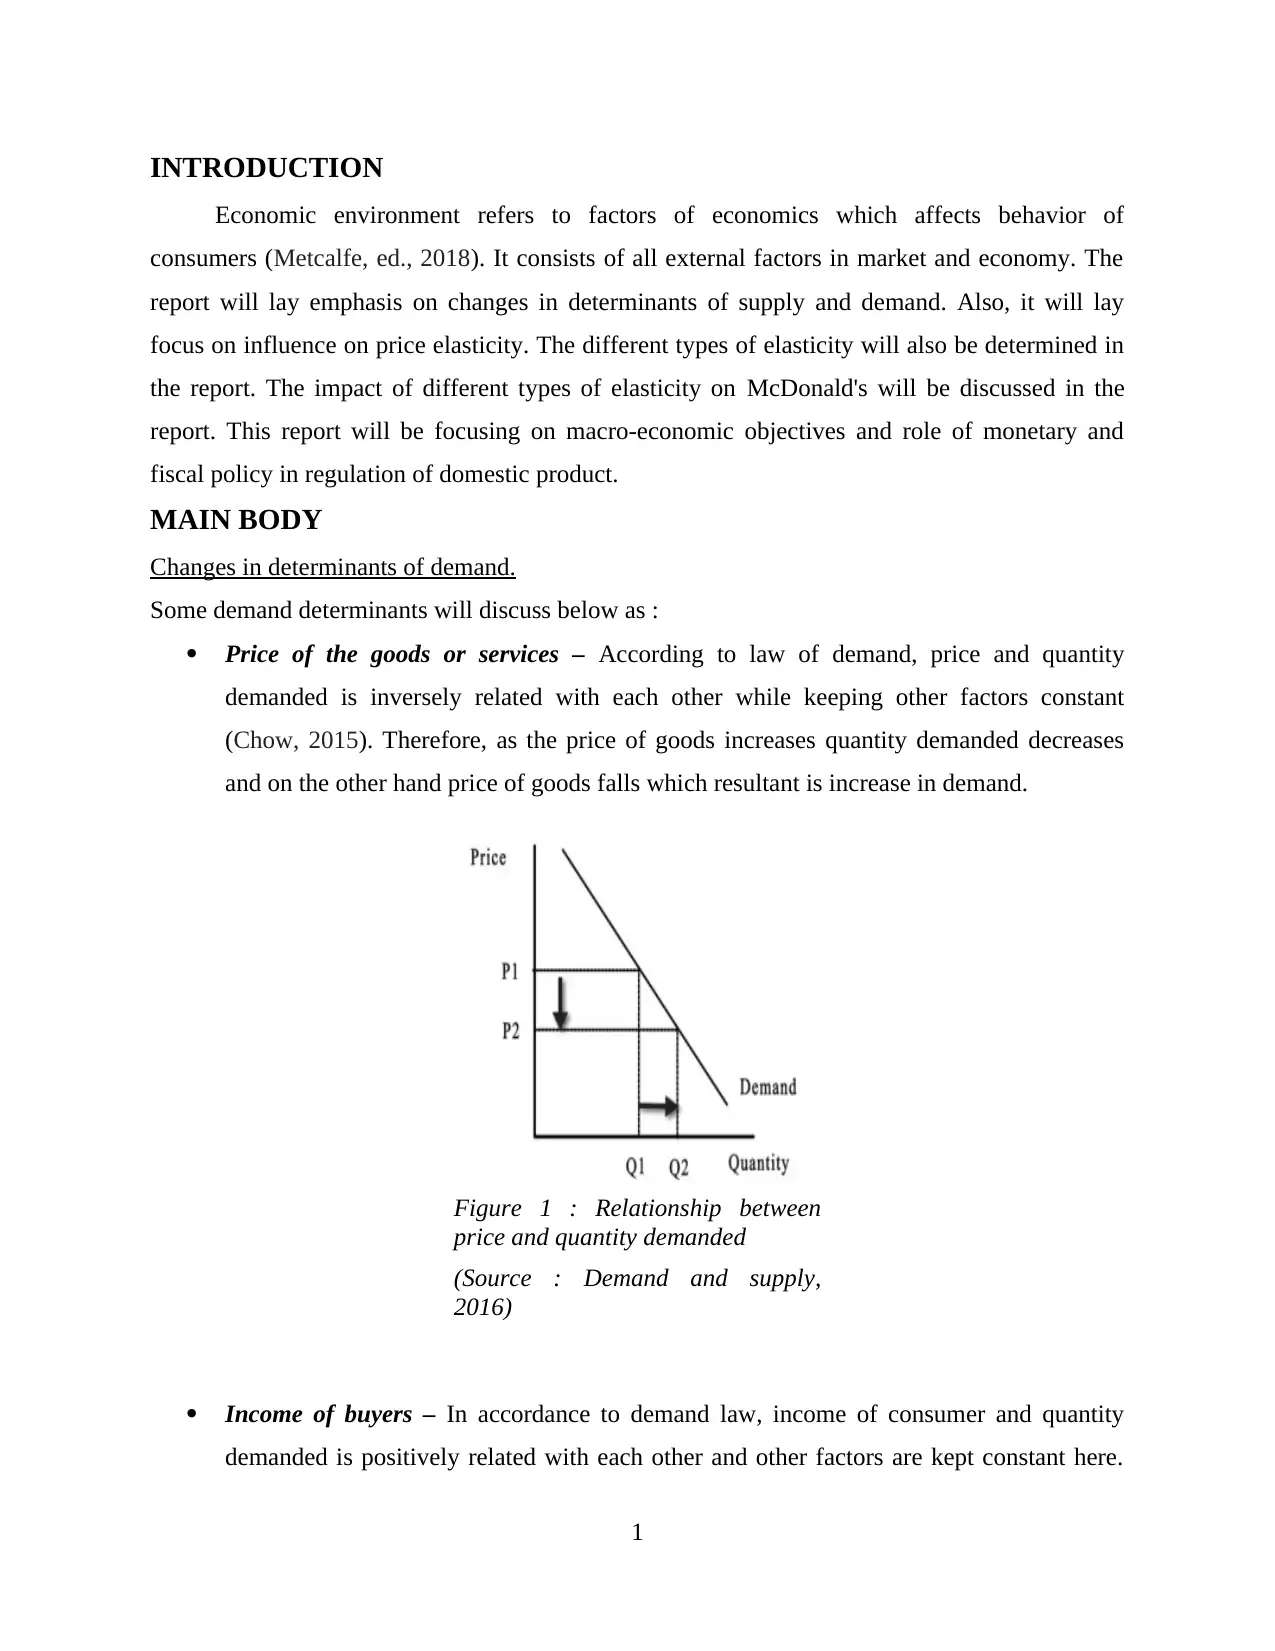
Price of the goods or services – According to law of demand, price and quantity
demanded is inversely related with each other while keeping other factors constant
(Chow, 2015). Therefore, as the price of goods increases quantity demanded decreases
and on the other hand price of goods falls which resultant is increase in demand.
Income of buyers – In accordance to demand law, income of consumer and quantity
demanded is positively related with each other and other factors are kept constant here.
1
Figure 1 : Relationship between
price and quantity demanded
(Source : Demand and supply,
2016)
Economic environment refers to factors of economics which affects behavior of
consumers (Metcalfe, ed., 2018). It consists of all external factors in market and economy. The
report will lay emphasis on changes in determinants of supply and demand. Also, it will lay
focus on influence on price elasticity. The different types of elasticity will also be determined in
the report. The impact of different types of elasticity on McDonald's will be discussed in the
report. This report will be focusing on macro-economic objectives and role of monetary and
fiscal policy in regulation of domestic product.
MAIN BODY
Changes in determinants of demand.
Some demand determinants will discuss below as :
Price of the goods or services – According to law of demand, price and quantity
demanded is inversely related with each other while keeping other factors constant
(Chow, 2015). Therefore, as the price of goods increases quantity demanded decreases
and on the other hand price of goods falls which resultant is increase in demand.
Income of buyers – In accordance to demand law, income of consumer and quantity
demanded is positively related with each other and other factors are kept constant here.
1
Figure 1 : Relationship between
price and quantity demanded
(Source : Demand and supply,
2016)
⊘ This is a preview!⊘
Do you want full access?
Subscribe today to unlock all pages.
Trusted by 1+ million students worldwide
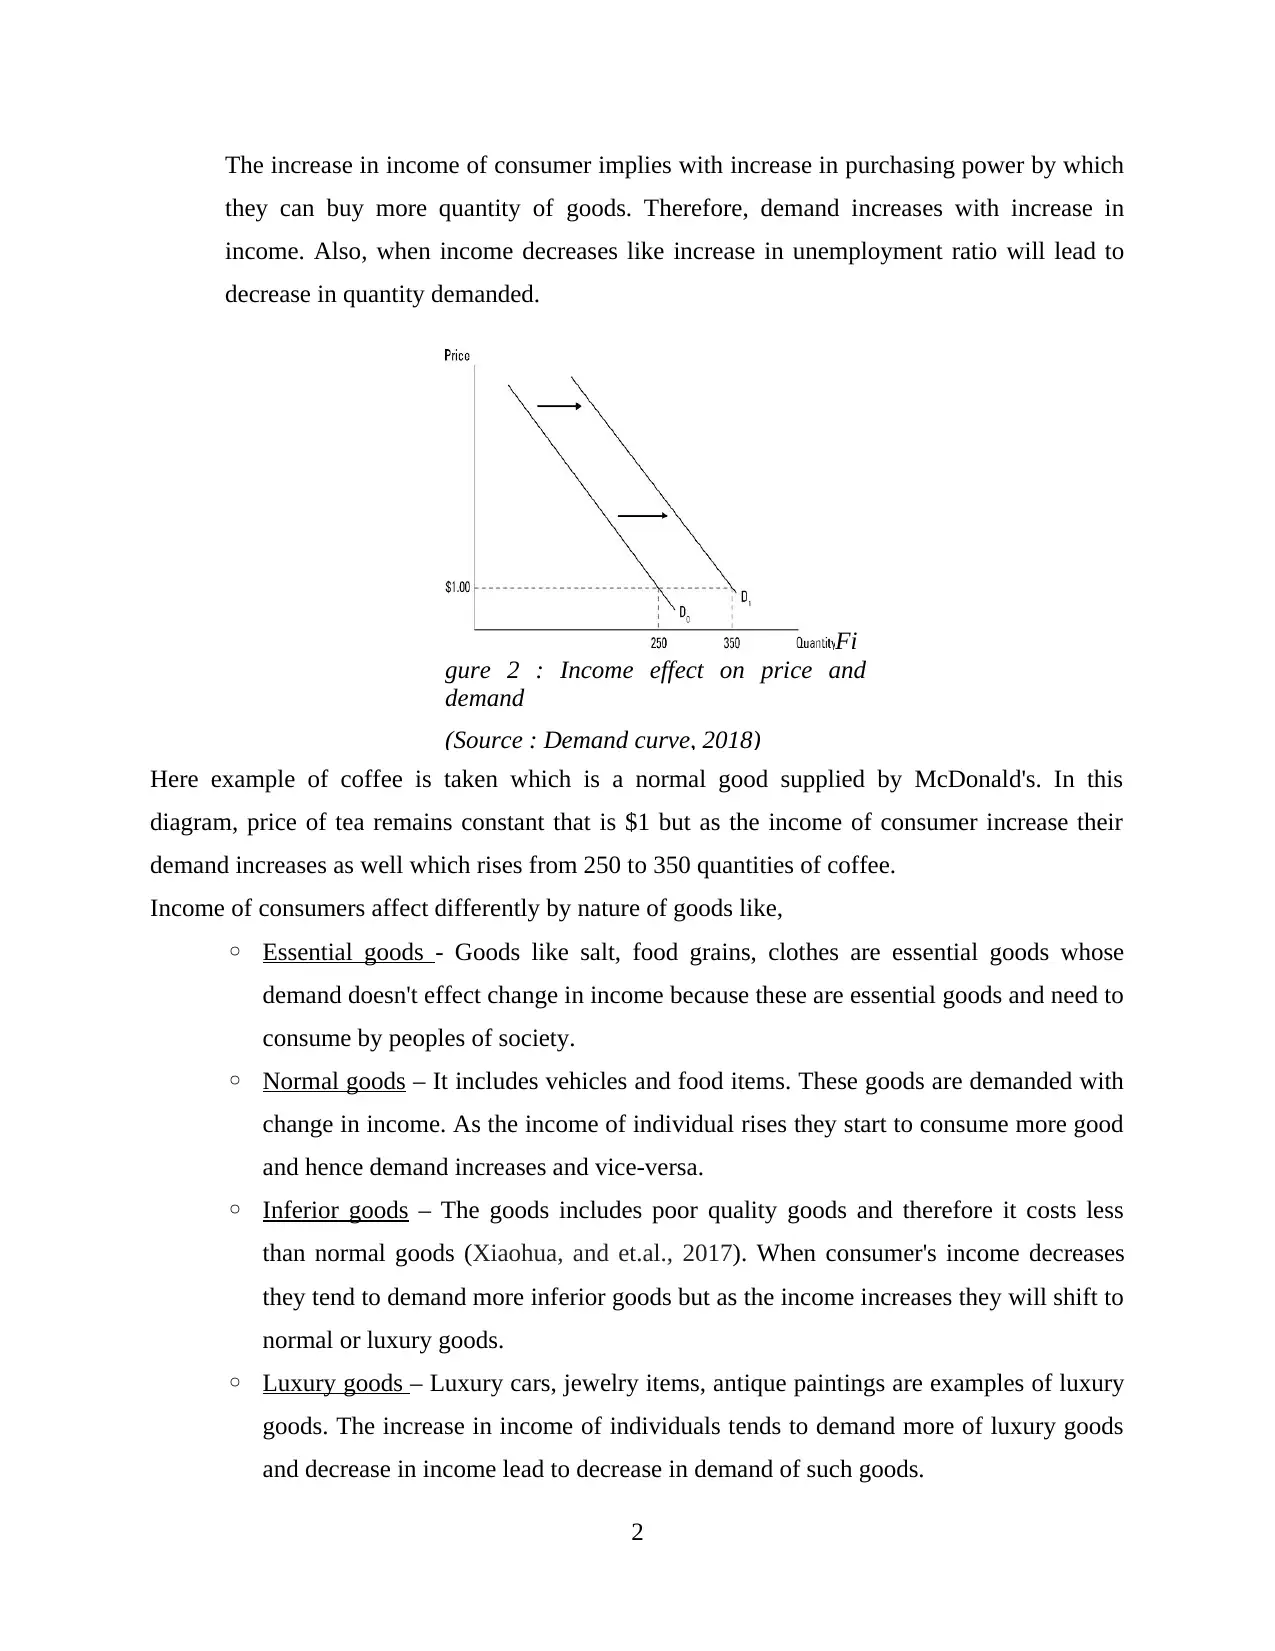
The increase in income of consumer implies with increase in purchasing power by which
they can buy more quantity of goods. Therefore, demand increases with increase in
income. Also, when income decreases like increase in unemployment ratio will lead to
decrease in quantity demanded.
Here example of coffee is taken which is a normal good supplied by McDonald's. In this
diagram, price of tea remains constant that is $1 but as the income of consumer increase their
demand increases as well which rises from 250 to 350 quantities of coffee.
Income of consumers affect differently by nature of goods like,
◦ Essential goods - Goods like salt, food grains, clothes are essential goods whose
demand doesn't effect change in income because these are essential goods and need to
consume by peoples of society.
◦ Normal goods – It includes vehicles and food items. These goods are demanded with
change in income. As the income of individual rises they start to consume more good
and hence demand increases and vice-versa.
◦ Inferior goods – The goods includes poor quality goods and therefore it costs less
than normal goods (Xiaohua, and et.al., 2017). When consumer's income decreases
they tend to demand more inferior goods but as the income increases they will shift to
normal or luxury goods.
◦ Luxury goods – Luxury cars, jewelry items, antique paintings are examples of luxury
goods. The increase in income of individuals tends to demand more of luxury goods
and decrease in income lead to decrease in demand of such goods.
2
Fi
gure 2 : Income effect on price and
demand
(Source : Demand curve, 2018)
Paraphrase This Document
Need a fresh take? Get an instant paraphrase of this document with our AI Paraphraser
2. Changes in determinants of supply.
There are many determinants of supply, Here are some factors which will discuss below :
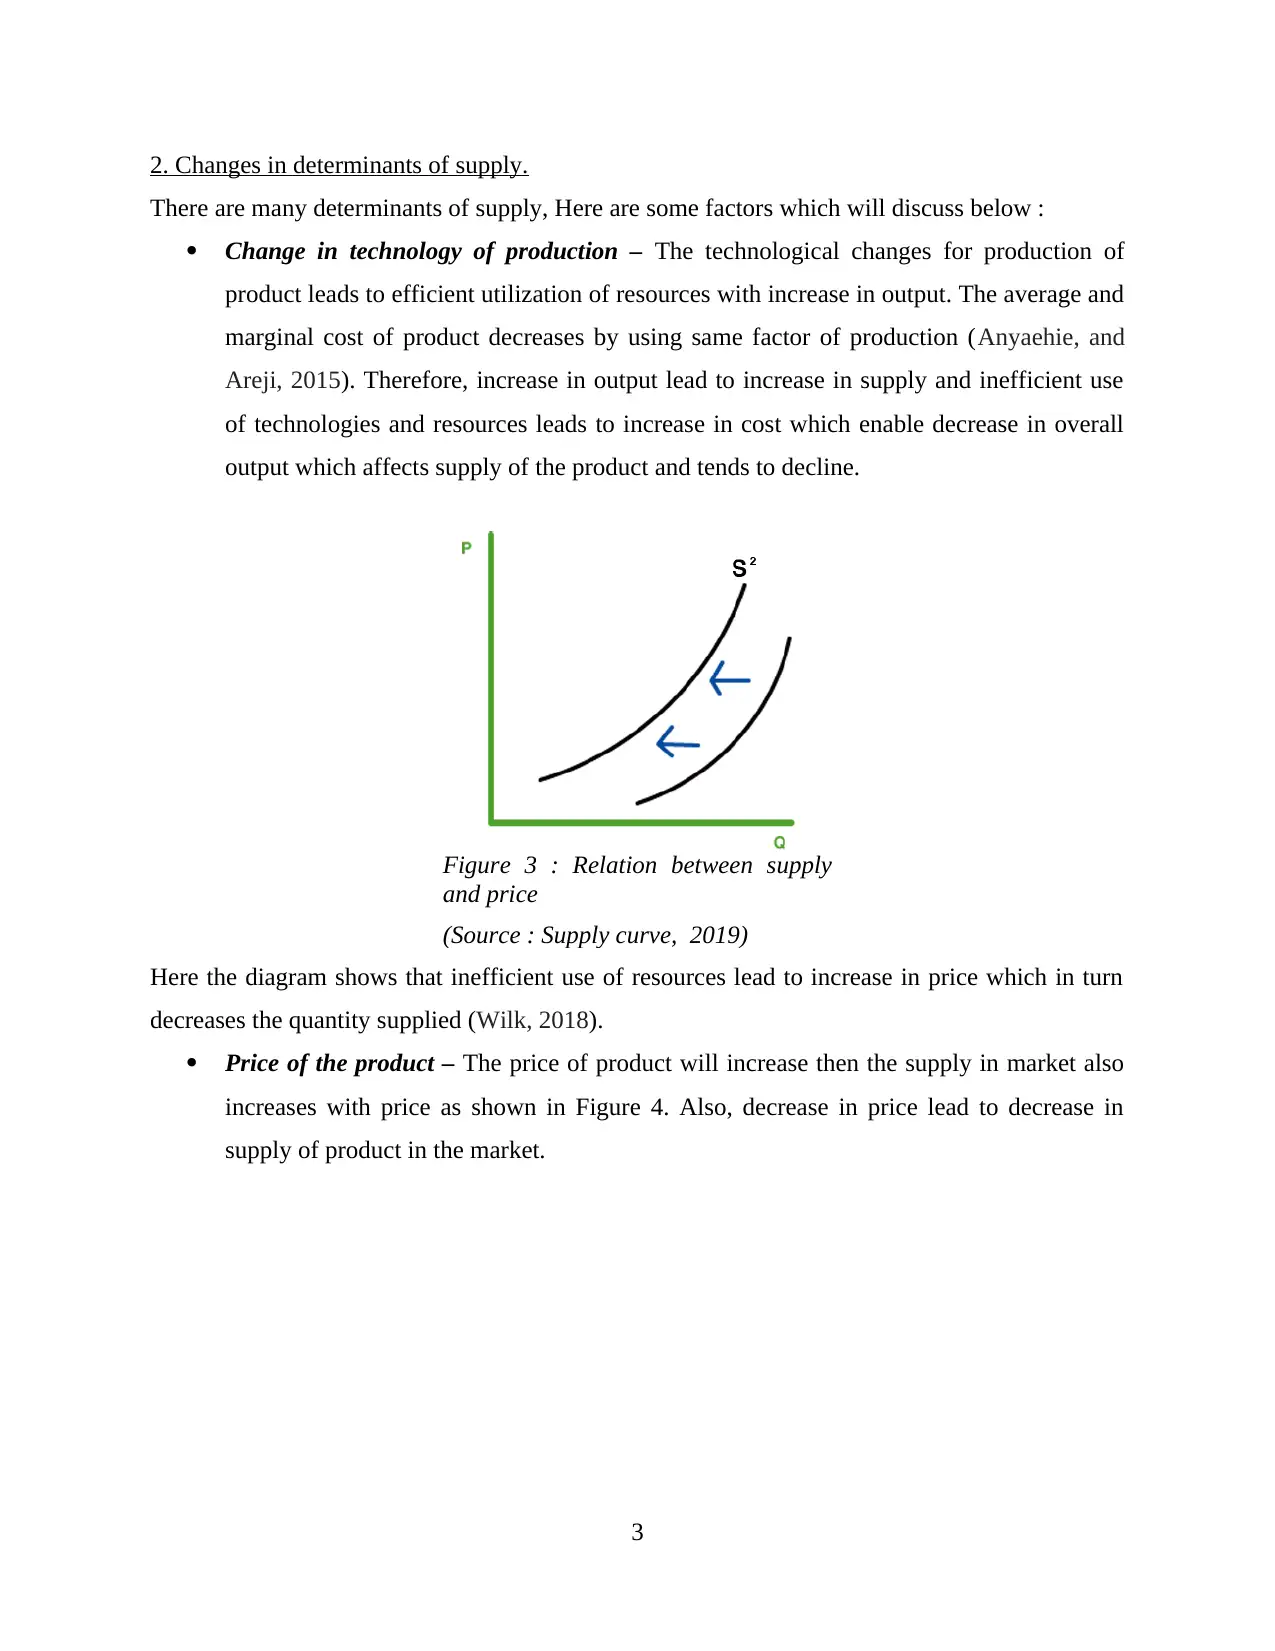
Change in technology of production – The technological changes for production of
product leads to efficient utilization of resources with increase in output. The average and
marginal cost of product decreases by using same factor of production (Anyaehie, and
Areji, 2015). Therefore, increase in output lead to increase in supply and inefficient use
of technologies and resources leads to increase in cost which enable decrease in overall
output which affects supply of the product and tends to decline.
Here the diagram shows that inefficient use of resources lead to increase in price which in turn
decreases the quantity supplied (Wilk, 2018).
Price of the product – The price of product will increase then the supply in market also
increases with price as shown in Figure 4. Also, decrease in price lead to decrease in
supply of product in the market.
3
Figure 3 : Relation between supply
and price
(Source : Supply curve, 2019)
There are many determinants of supply, Here are some factors which will discuss below :
Change in technology of production – The technological changes for production of
product leads to efficient utilization of resources with increase in output. The average and
marginal cost of product decreases by using same factor of production (Anyaehie, and
Areji, 2015). Therefore, increase in output lead to increase in supply and inefficient use
of technologies and resources leads to increase in cost which enable decrease in overall
output which affects supply of the product and tends to decline.
Here the diagram shows that inefficient use of resources lead to increase in price which in turn
decreases the quantity supplied (Wilk, 2018).
Price of the product – The price of product will increase then the supply in market also
increases with price as shown in Figure 4. Also, decrease in price lead to decrease in
supply of product in the market.
3
Figure 3 : Relation between supply
and price
(Source : Supply curve, 2019)
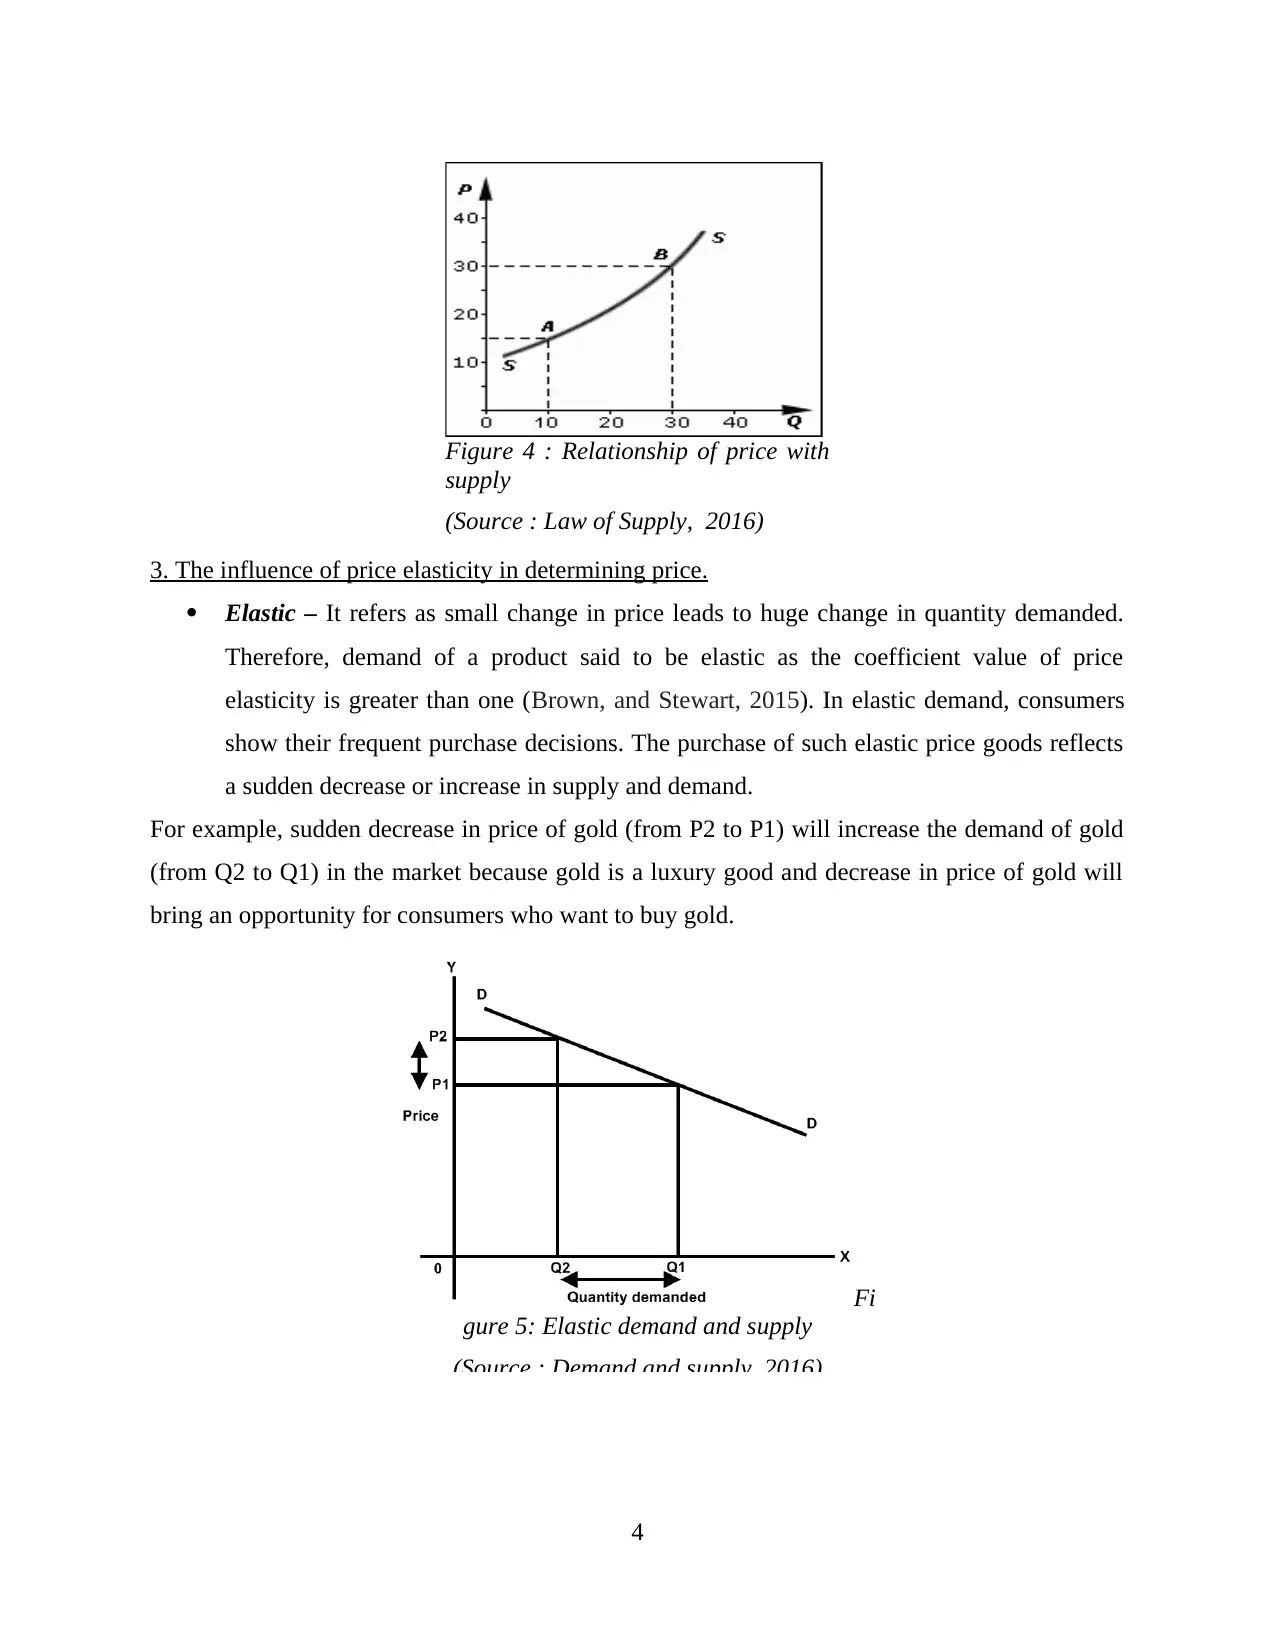
Figure 4 : Relationship of price with
supply
(Source : Law of Supply, 2016)
3. The influence of price elasticity in determining price.
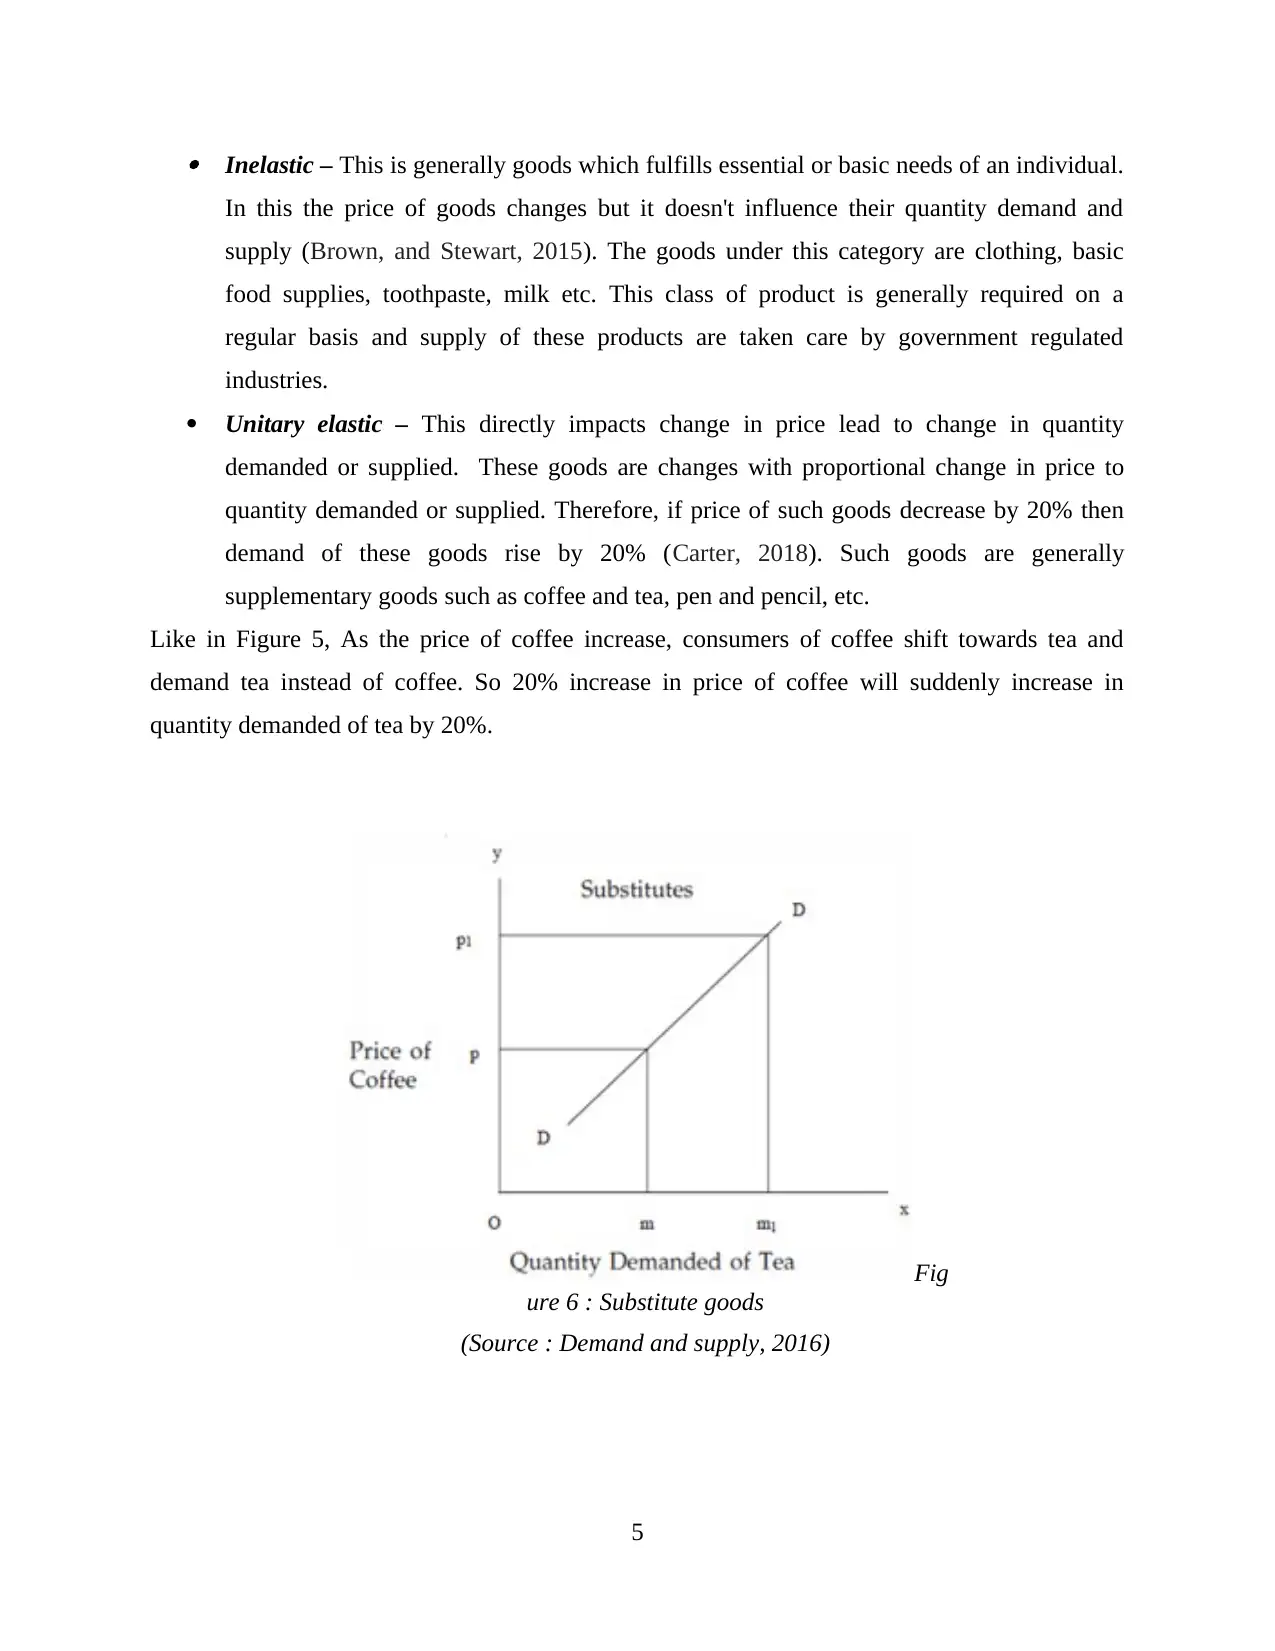
Elastic – It refers as small change in price leads to huge change in quantity demanded.
Therefore, demand of a product said to be elastic as the coefficient value of price
elasticity is greater than one (Brown, and Stewart, 2015). In elastic demand, consumers
show their frequent purchase decisions. The purchase of such elastic price goods reflects
a sudden decrease or increase in supply and demand.
For example, sudden decrease in price of gold (from P2 to P1) will increase the demand of gold
(from Q2 to Q1) in the market because gold is a luxury good and decrease in price of gold will
bring an opportunity for consumers who want to buy gold.
4
Fi
gure 5: Elastic demand and supply
(Source : Demand and supply, 2016)
supply
(Source : Law of Supply, 2016)
3. The influence of price elasticity in determining price.
Elastic – It refers as small change in price leads to huge change in quantity demanded.
Therefore, demand of a product said to be elastic as the coefficient value of price
elasticity is greater than one (Brown, and Stewart, 2015). In elastic demand, consumers
show their frequent purchase decisions. The purchase of such elastic price goods reflects
a sudden decrease or increase in supply and demand.
For example, sudden decrease in price of gold (from P2 to P1) will increase the demand of gold
(from Q2 to Q1) in the market because gold is a luxury good and decrease in price of gold will
bring an opportunity for consumers who want to buy gold.
4
Fi
gure 5: Elastic demand and supply
(Source : Demand and supply, 2016)
⊘ This is a preview!⊘
Do you want full access?
Subscribe today to unlock all pages.
Trusted by 1+ million students worldwide
Inelastic – This is generally goods which fulfills essential or basic needs of an individual.
In this the price of goods changes but it doesn't influence their quantity demand and
supply (Brown, and Stewart, 2015). The goods under this category are clothing, basic
food supplies, toothpaste, milk etc. This class of product is generally required on a
regular basis and supply of these products are taken care by government regulated
industries.
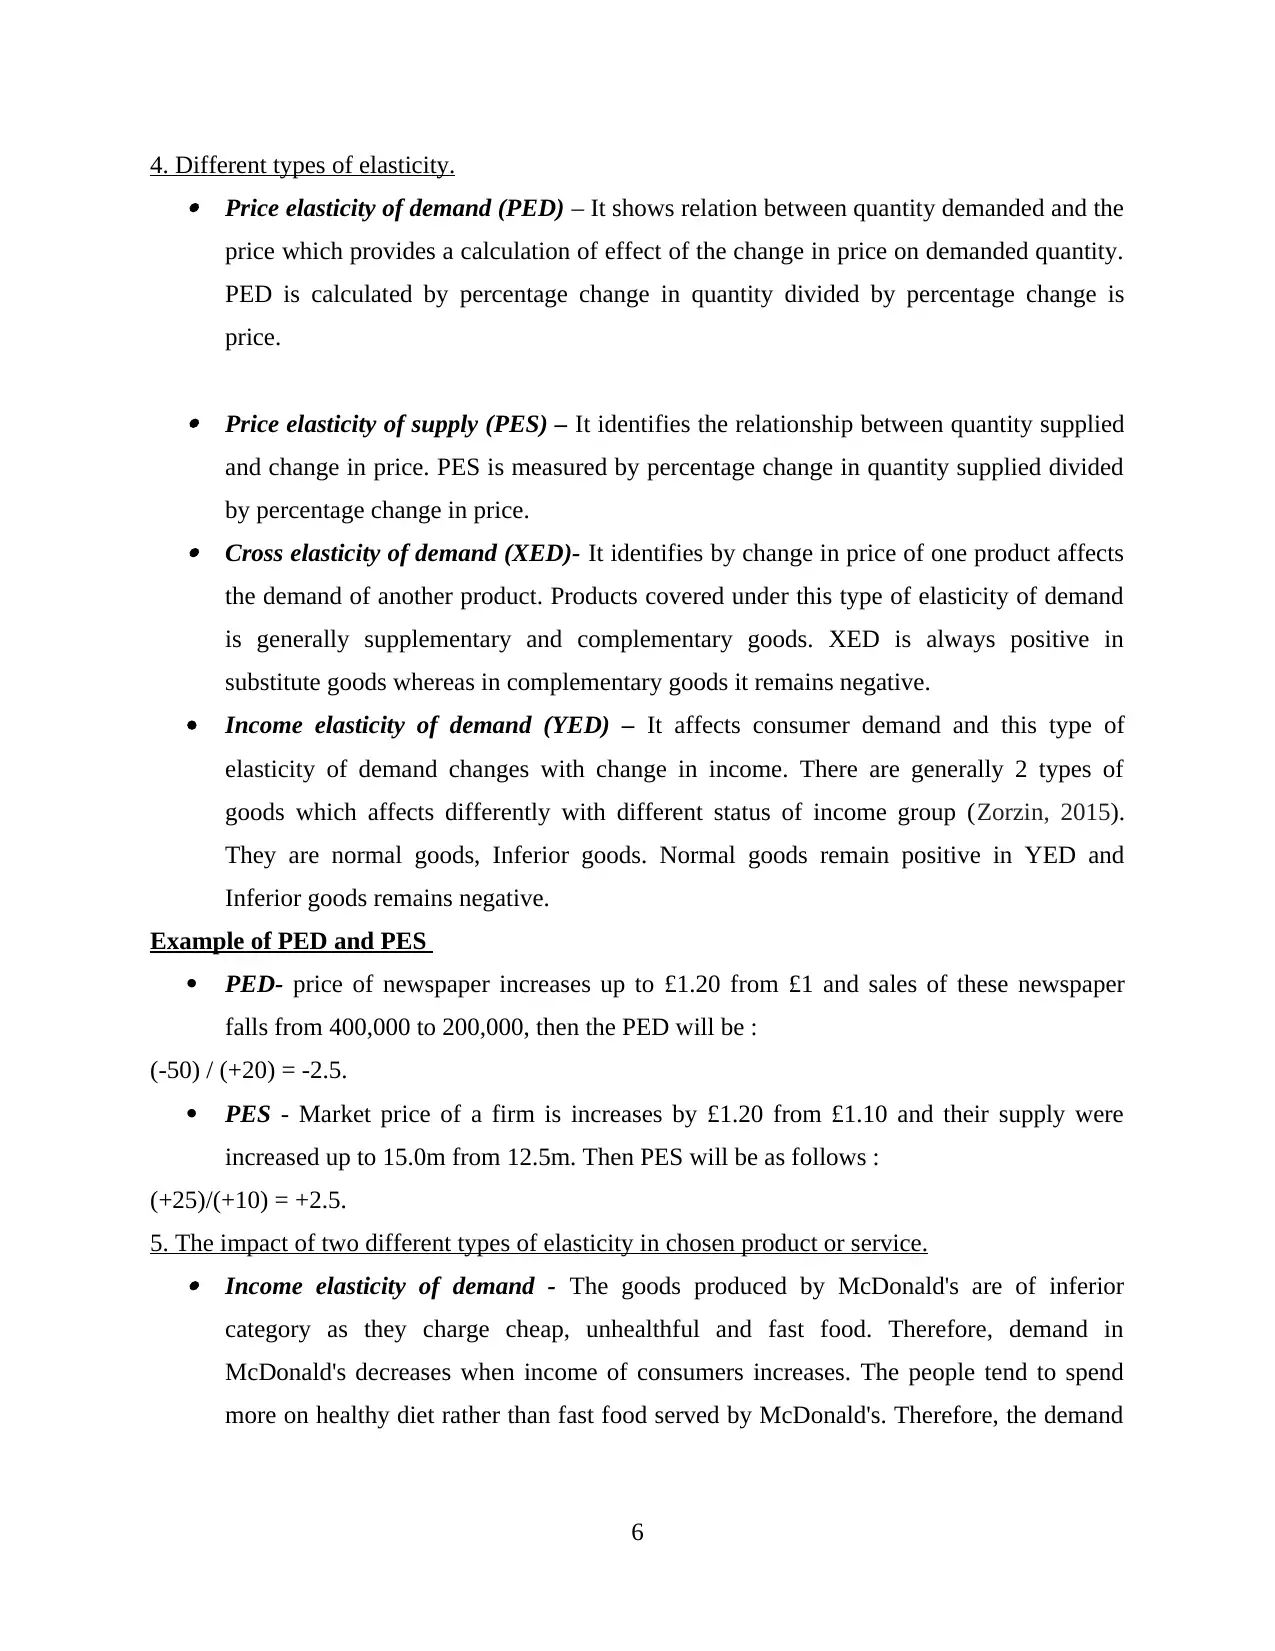
Unitary elastic – This directly impacts change in price lead to change in quantity
demanded or supplied. These goods are changes with proportional change in price to
quantity demanded or supplied. Therefore, if price of such goods decrease by 20% then
demand of these goods rise by 20% (Carter, 2018). Such goods are generally
supplementary goods such as coffee and tea, pen and pencil, etc.
Like in Figure 5, As the price of coffee increase, consumers of coffee shift towards tea and
demand tea instead of coffee. So 20% increase in price of coffee will suddenly increase in
quantity demanded of tea by 20%.
5
Fig
ure 6 : Substitute goods
(Source : Demand and supply, 2016)
In this the price of goods changes but it doesn't influence their quantity demand and
supply (Brown, and Stewart, 2015). The goods under this category are clothing, basic
food supplies, toothpaste, milk etc. This class of product is generally required on a
regular basis and supply of these products are taken care by government regulated
industries.
Unitary elastic – This directly impacts change in price lead to change in quantity
demanded or supplied. These goods are changes with proportional change in price to
quantity demanded or supplied. Therefore, if price of such goods decrease by 20% then
demand of these goods rise by 20% (Carter, 2018). Such goods are generally
supplementary goods such as coffee and tea, pen and pencil, etc.
Like in Figure 5, As the price of coffee increase, consumers of coffee shift towards tea and
demand tea instead of coffee. So 20% increase in price of coffee will suddenly increase in
quantity demanded of tea by 20%.
5
Fig
ure 6 : Substitute goods
(Source : Demand and supply, 2016)
Paraphrase This Document
Need a fresh take? Get an instant paraphrase of this document with our AI Paraphraser
4. Different types of elasticity. Price elasticity of demand (PED) – It shows relation between quantity demanded and the
price which provides a calculation of effect of the change in price on demanded quantity.
PED is calculated by percentage change in quantity divided by percentage change is
price.
Price elasticity of supply (PES) – It identifies the relationship between quantity supplied
and change in price. PES is measured by percentage change in quantity supplied divided
by percentage change in price. Cross elasticity of demand (XED)- It identifies by change in price of one product affects
the demand of another product. Products covered under this type of elasticity of demand
is generally supplementary and complementary goods. XED is always positive in
substitute goods whereas in complementary goods it remains negative.
Income elasticity of demand (YED) – It affects consumer demand and this type of
elasticity of demand changes with change in income. There are generally 2 types of
goods which affects differently with different status of income group (Zorzin, 2015).
They are normal goods, Inferior goods. Normal goods remain positive in YED and
Inferior goods remains negative.
Example of PED and PES
PED- price of newspaper increases up to £1.20 from £1 and sales of these newspaper
falls from 400,000 to 200,000, then the PED will be :
(-50) / (+20) = -2.5.
PES - Market price of a firm is increases by £1.20 from £1.10 and their supply were
increased up to 15.0m from 12.5m. Then PES will be as follows :
(+25)/(+10) = +2.5.
5. The impact of two different types of elasticity in chosen product or service. Income elasticity of demand - The goods produced by McDonald's are of inferior
category as they charge cheap, unhealthful and fast food. Therefore, demand in
McDonald's decreases when income of consumers increases. The people tend to spend
more on healthy diet rather than fast food served by McDonald's. Therefore, the demand
6
is lower than what the company is supplying in the market. So, McDonald's bear more
cost for the waste of their product.
Cross elasticity of demand – As McDonald's entered into new segment that is McCafe,
by this the company is giving competition to Starbucks because they serve luxury coffee
at lower price. So, the McCafe attracts customer of Starbucks by their lower price and
they gain a strong customer base by entering in new range of market. Therefore, McCafe
demand matches their supply and they tend to manage their cost of production in order to
charge nominal cost for their luxury coffee.
6. Two government macro-economic objectives. Full employment or lower unemployment – This objective is to provide full employment
in UK. For this UK government measures level of employment by including those
unemployed young people who are not eligible, married women, sick peoples (Elena, and
et.al., 2016). Therefore, the active members includes only working population and it
includes all employed and unemployed registered peoples. The government of UK as the
employment level rises nearly 28 million workers.
Price stability – It is measured by annual change rate of Retail price index (RPI). Price
stability occurs only when inflation rate is zero. UK government target underlying
inflation rate or RPIX by charging annual percentage. By using this measure the RPI
affects itself as they control interest rates and inflation.
The role of monetary and fiscal policies in regulating domestic product growth.
The role of fiscal policy is to promote stability of macro-economic through sustaining
demand on aggregate basis and private sector's income during downturn in economic and
through economic activity moderation in strong period growth. The role of monetary policy is
achievement of stability of price and to manage fluctuations among economy. Also, they take
control on credit on inflation and price level stabilization and to stable rate of exchange.
Equilibrium in balance of payment is also key role of Monetary policy and to promote economic
development for regulating domestic product growth.
CONCLUSION
The report concluded about environment of economics. This report begun with the
determinants of demand and supply which was explained by taking two examples of each. Also,
price elasticity was determined in the report. Then the report covers different types of elasticity
7
⊘ This is a preview!⊘
Do you want full access?
Subscribe today to unlock all pages.
Trusted by 1+ million students worldwide
and their impact on the company McDonald's. Government objectives like full employment and
price stability in macro-economics were also described in the report and the report was ended
with describing the role of fiscal and monetary policy in regulating domestic product growth.
8
price stability in macro-economics were also described in the report and the report was ended
with describing the role of fiscal and monetary policy in regulating domestic product growth.
8
Paraphrase This Document
Need a fresh take? Get an instant paraphrase of this document with our AI Paraphraser
REFERENCES
Books and Journals
Metcalfe, S. ed., 2018. Evolutionary theories of economic and technological change: present
status and future prospects(Vol. 44). Routledge.
Elena, P. and et.al., 2016. TOWARDS ECONOMIC SECURITY THROUGH
DIVERSIFICATION: CASE OF KAZAKHSTAN. Journal of Security & Sustainability
Issues. 5(4).
Zorzin, N., 2015. Archaeology and capitalism: successful relationship or economic and ethical
alienation?. In Ethics and archaeological praxis (pp. 115-139). Springer, New York, NY.
Carter, N., 2018. The politics of the environment: Ideas, activism, policy. Cambridge University
Press.
Wilk, R. R., 2018. Economies and cultures: foundations of economic anthropology. Routledge.
Xiaohua, W. and et.al., 2017. Research on China’s rural household energy consumption–
Household investigation of typical counties in 8 economic zones. Renewable and
Sustainable Energy Reviews. 68. pp.28-32.
Woolcock, S., 2016. European Union economic diplomacy: the role of the EU in external
economic relations. Routledge.
Chow, G. C., 2015. China's economic transformation. John Wiley & Sons.
Anyaehie, M. C. and Areji, A. C., 2015. Economic diversification for sustainable development in
Nigeria. Open journal of political science. 5(02). p.87.
Brown, G. K. and Stewart, F., 2015. Economic and political causes of conflict: An overview and
some policy implications. Managing Conflict in a World Adrift, pp.199-227.
Online
Demand and supply. 2016. [Online]. Available through :
<https://johnzamen.com/microeconomics/demand-and-supply/>.
Supply curve. 2019. [Online]. Available through :
<https://www.shmoop.com/supply-demand/supply-curve.html>.
Demand curve. 2018. [Online]. Available through : <https://www.quora.com/How-do-we-know-
how-much-the-demand-curve-will-shift-if-the-demand-of-a-good-rises-due-to-some-
reason-In-diagrams-we-generally-show-the-demand-curve-shifting-to-the-right-but-how-
do-economists-determine-how-much-the-demand-curve-will-shift >.
9
Law of Supply. 2016. [Online]. Available through :
<https://courses.lumenlearning.com/boundless-economics/chapter/supply/>.
10
<https://courses.lumenlearning.com/boundless-economics/chapter/supply/>.
10
⊘ This is a preview!⊘
Do you want full access?
Subscribe today to unlock all pages.
Trusted by 1+ million students worldwide
1 out of 12
Related Documents


Your All-in-One AI-Powered Toolkit for Academic Success.
+13062052269
info@desklib.com
Available 24*7 on WhatsApp / Email
![[object Object]](/_next/static/media/star-bottom.7253800d.svg)
Unlock your academic potential
Copyright © 2020–2026 A2Z Services. All Rights Reserved. Developed and managed by ZUCOL.