49003 Economic Evaluation Assignment 1: Autumn 2017 Analysis
VerifiedAdded on 2023/01/20
|7
|964
|23
Homework Assignment
AI Summary
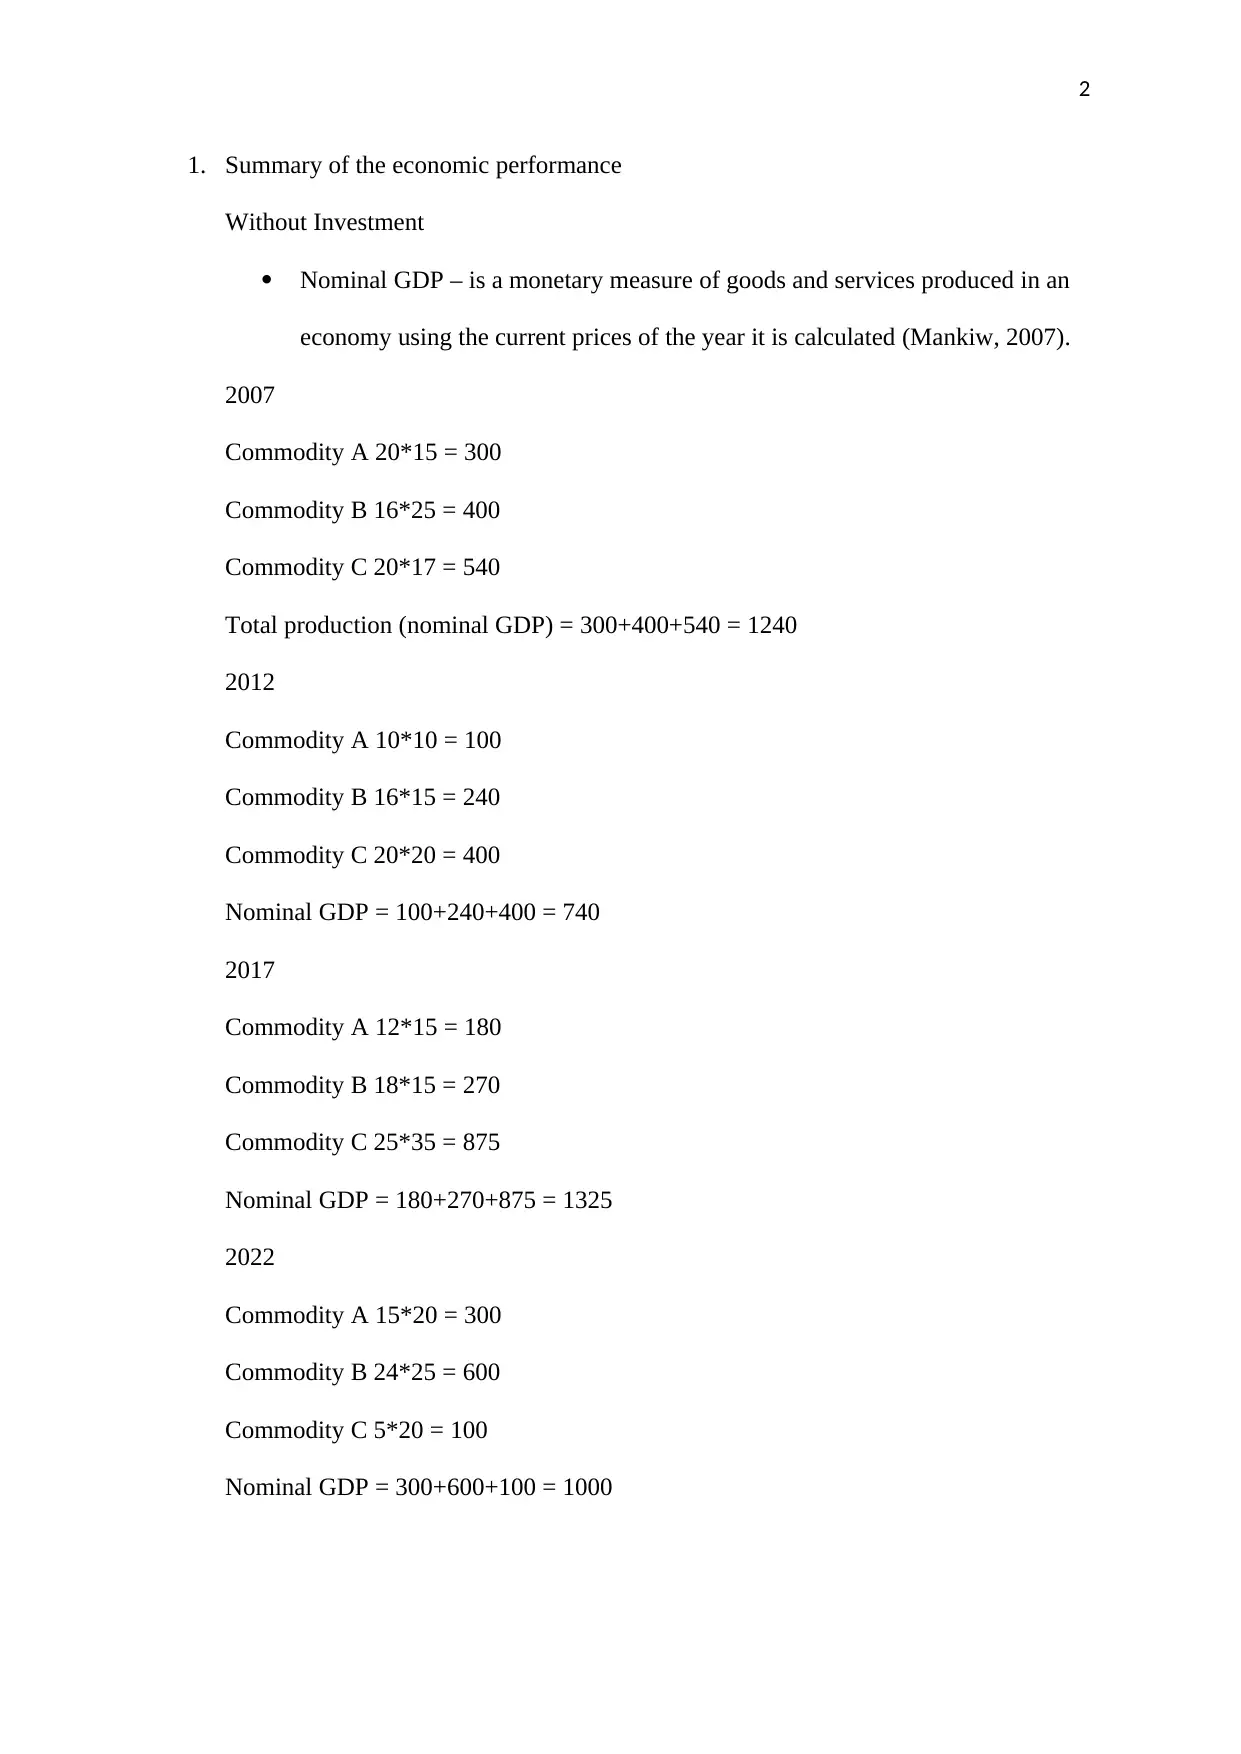
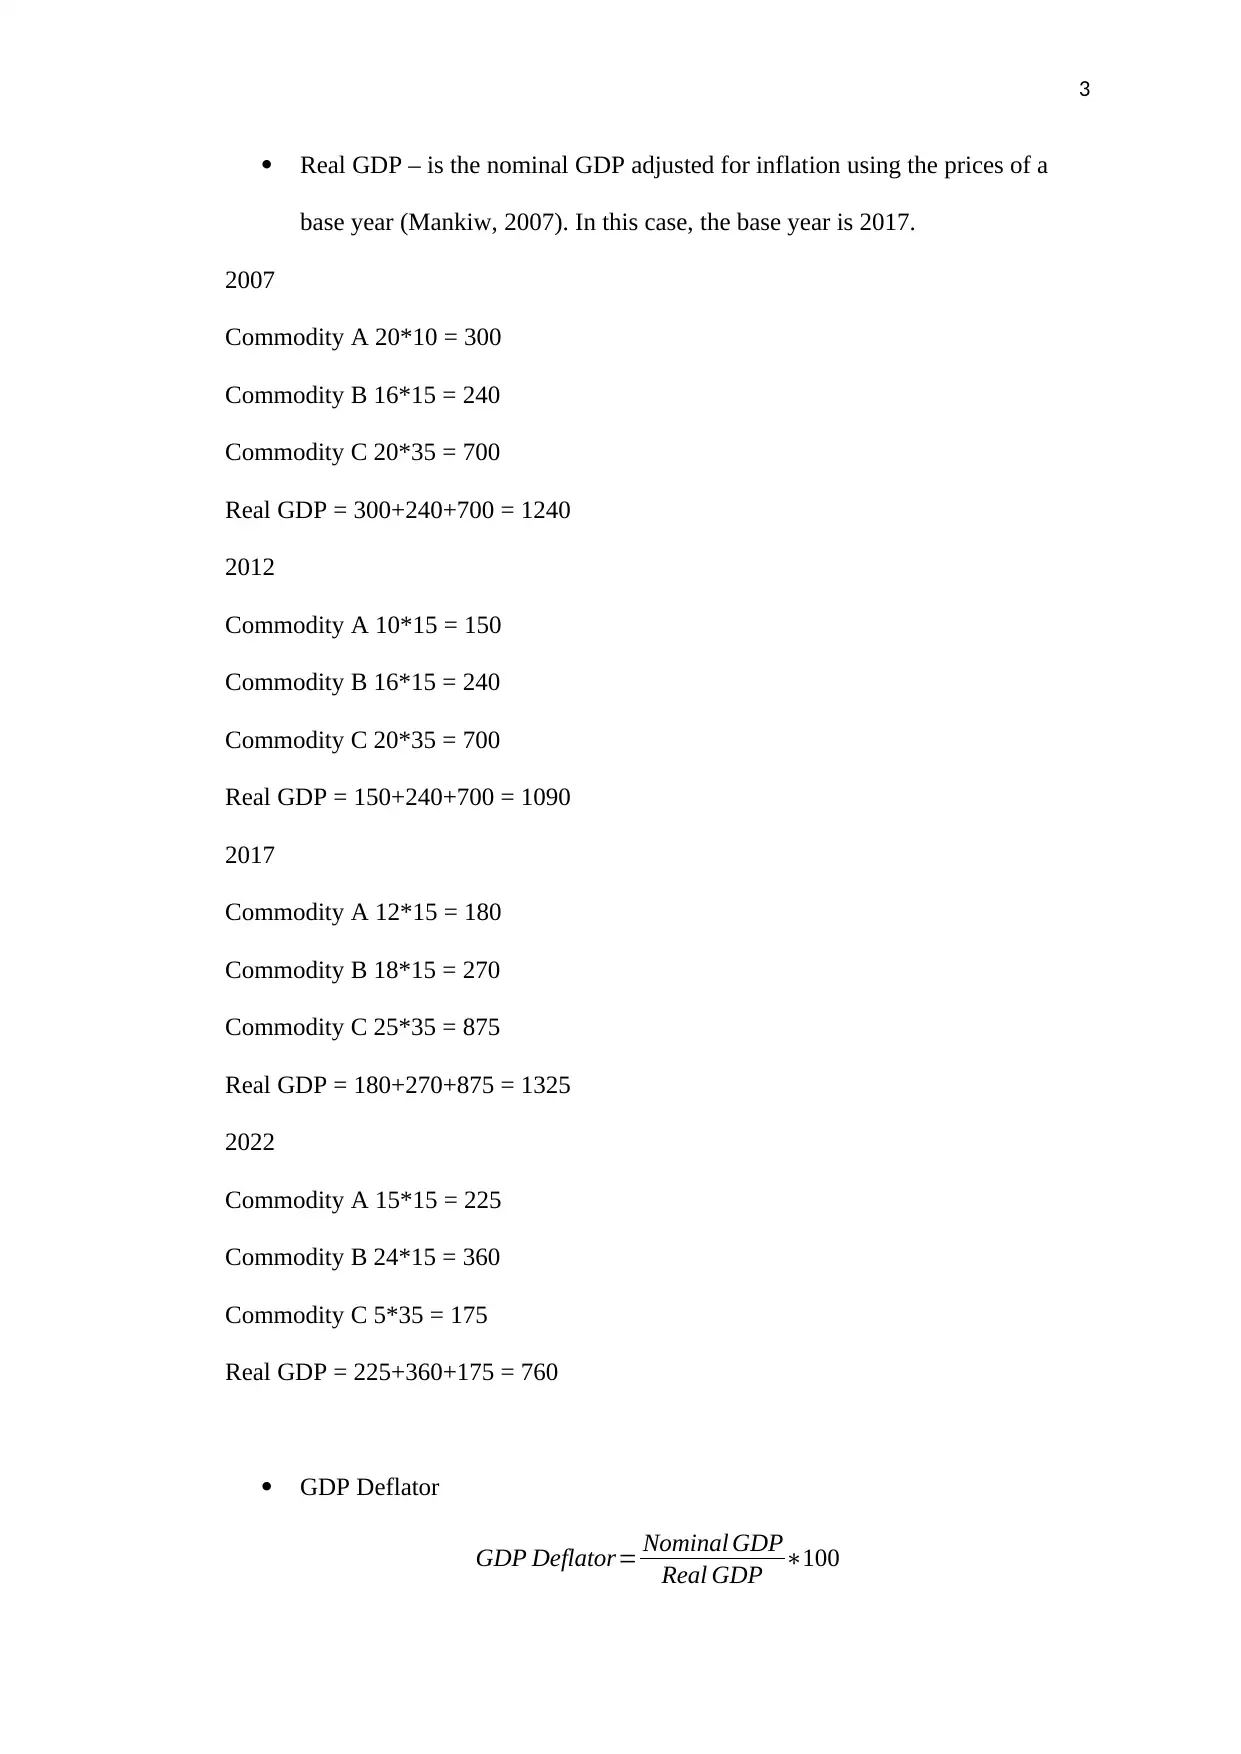
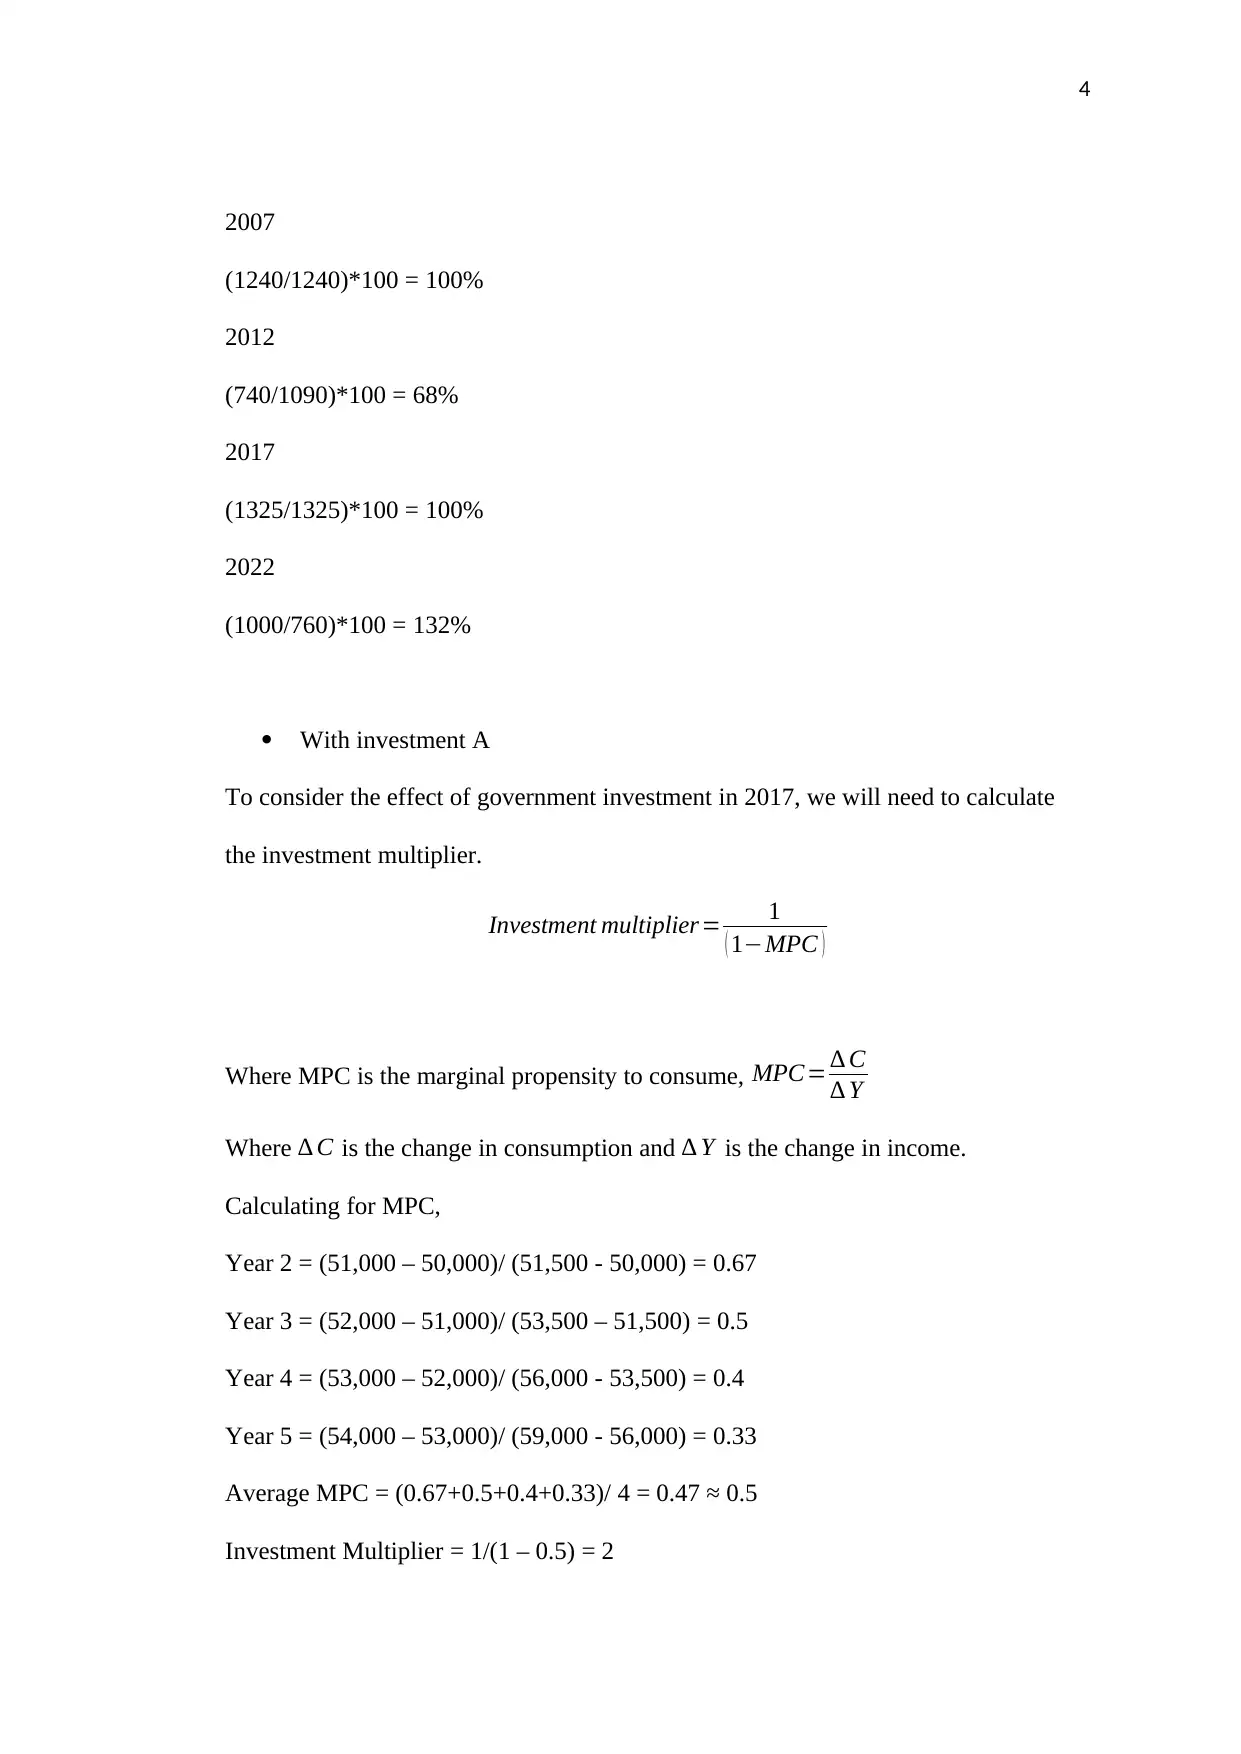
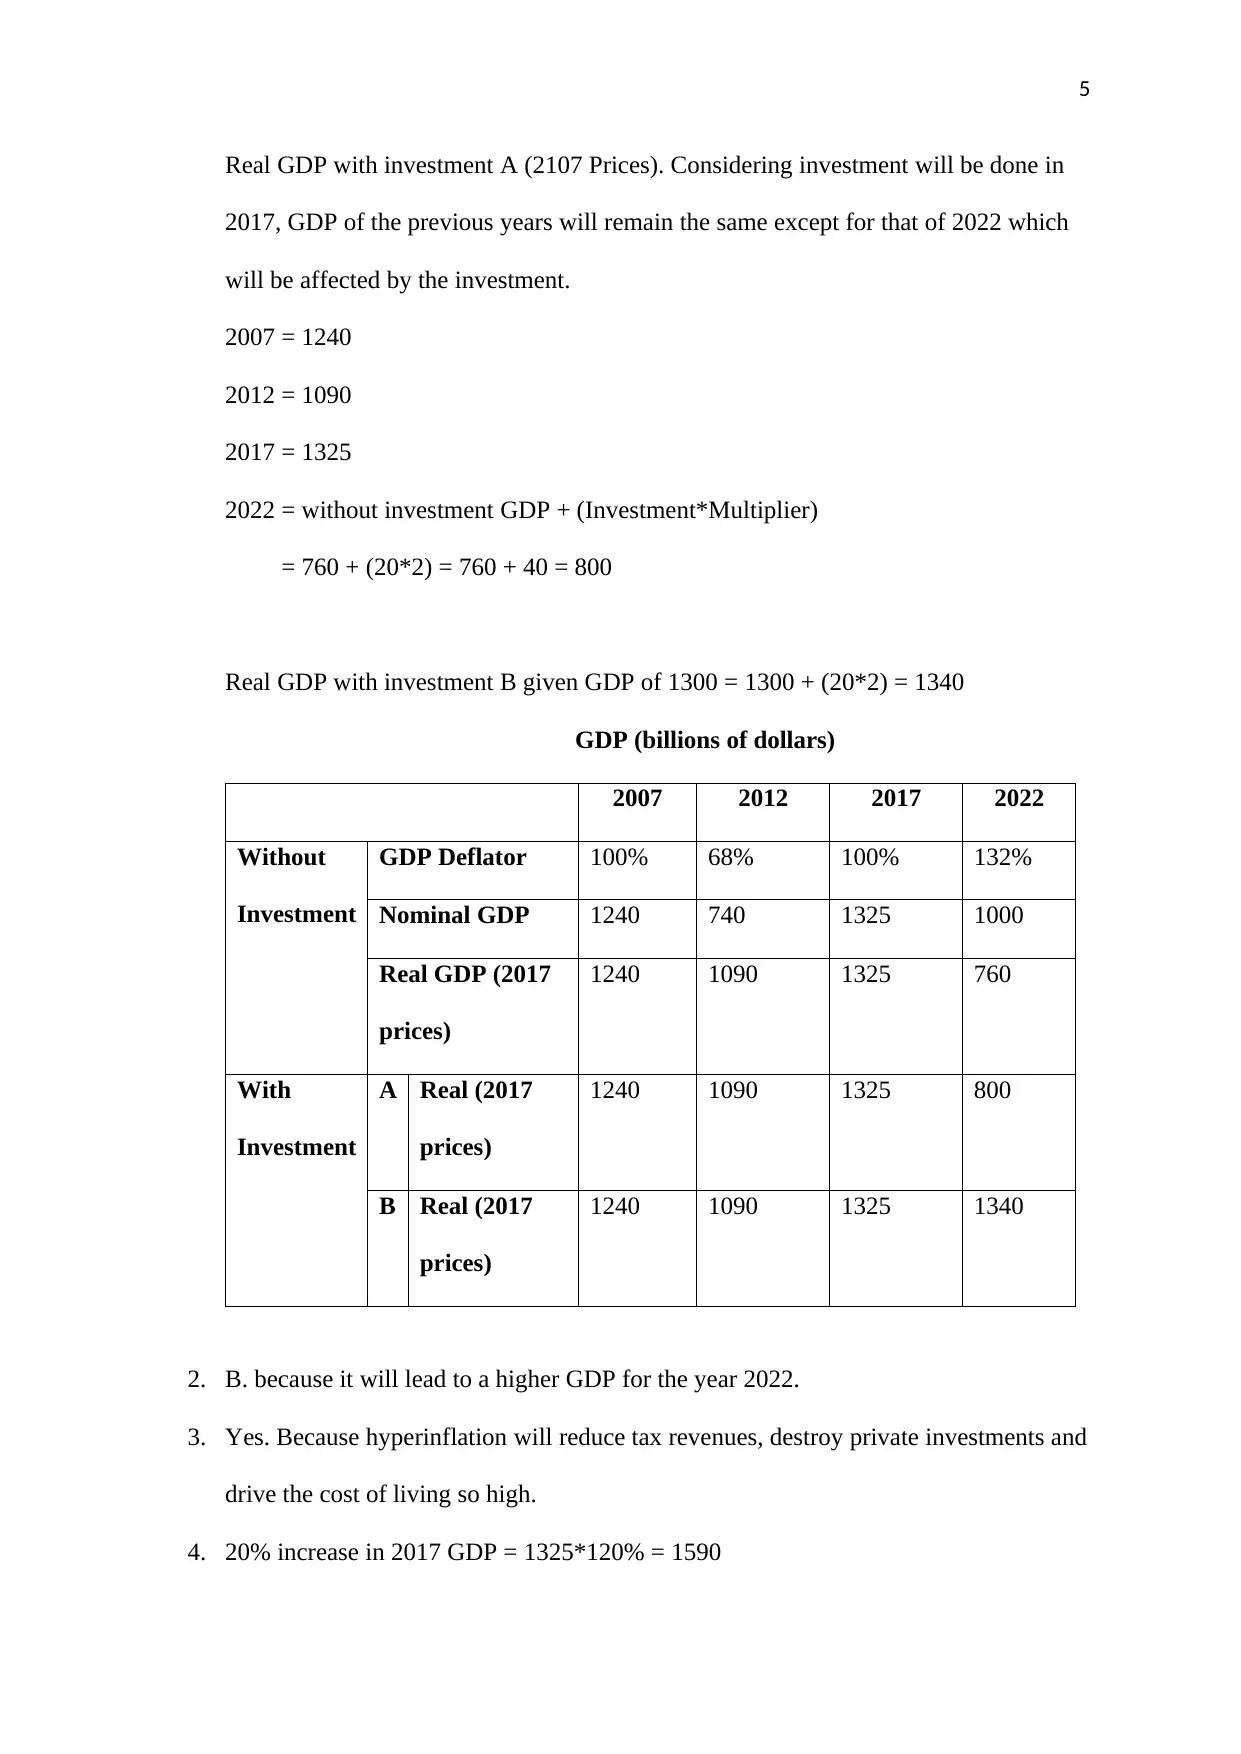
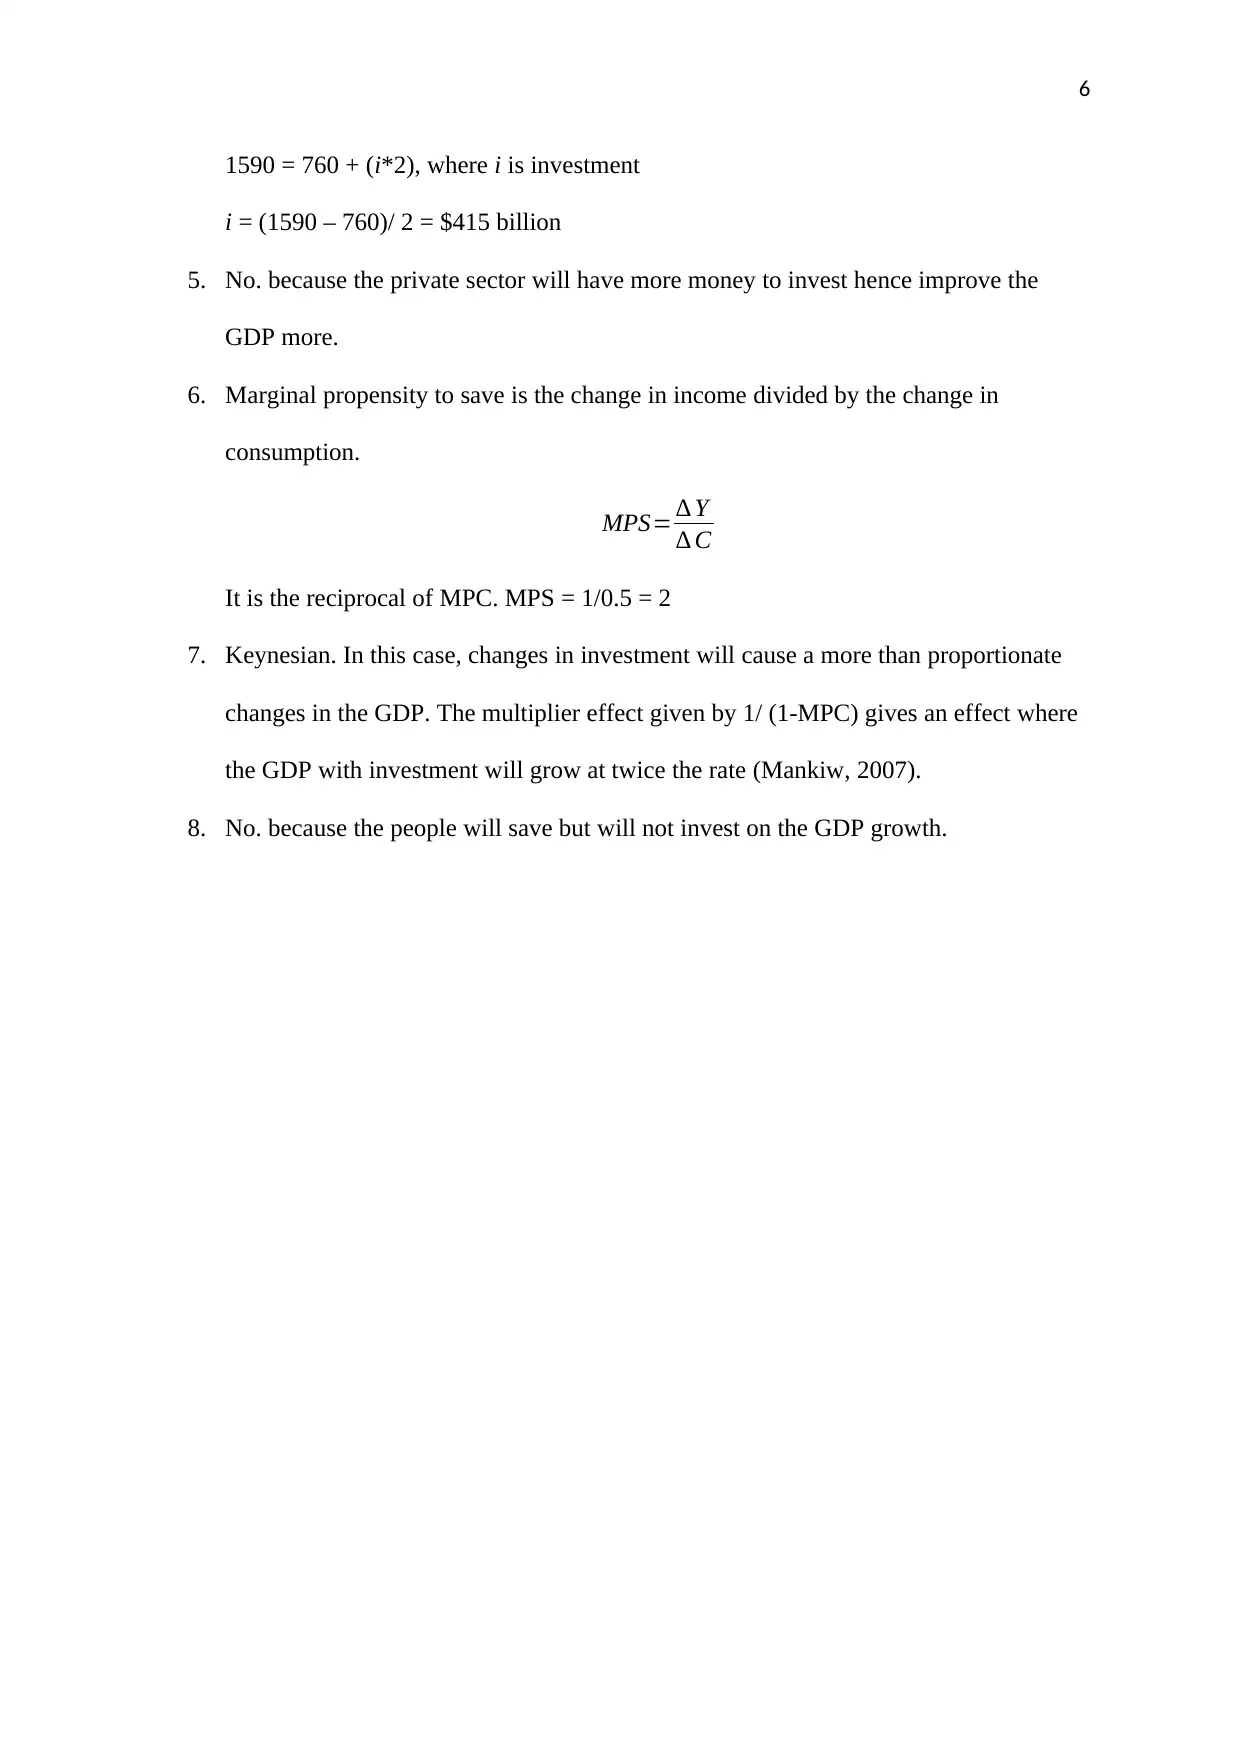
This assignment analyzes the economic performance of a country, focusing on nominal GDP, real GDP, and the GDP deflator across multiple years (2007, 2012, 2017, and 2022). The solution calculates these metrics both without and with government investment, considering an investment multiplier. It evaluates two investment proposals, recommending the one that leads to higher GDP in 2022. The assignment explores the impact of hyperinflation and determines the required investment amount to achieve a 20% GDP increase. It further discusses the marginal propensity to save and identifies the economic model as Keynesian, highlighting the multiplier effect. The solution includes references to relevant economic literature.

1
49003ECONOMIC EVALUATION
Assignment #1 (autumn 2017)
Student’s Name
Student’s Number
Institution Affiliated
49003ECONOMIC EVALUATION
Assignment #1 (autumn 2017)
Student’s Name
Student’s Number
Institution Affiliated
Paraphrase This Document
Need a fresh take? Get an instant paraphrase of this document with our AI Paraphraser

2
1. Summary of the economic performance
Without Investment
Nominal GDP – is a monetary measure of goods and services produced in an
economy using the current prices of the year it is calculated (Mankiw, 2007).
2007
Commodity A 20*15 = 300
Commodity B 16*25 = 400
Commodity C 20*17 = 540
Total production (nominal GDP) = 300+400+540 = 1240
2012
Commodity A 10*10 = 100
Commodity B 16*15 = 240
Commodity C 20*20 = 400
Nominal GDP = 100+240+400 = 740
2017
Commodity A 12*15 = 180
Commodity B 18*15 = 270
Commodity C 25*35 = 875
Nominal GDP = 180+270+875 = 1325
2022
Commodity A 15*20 = 300
Commodity B 24*25 = 600
Commodity C 5*20 = 100
Nominal GDP = 300+600+100 = 1000

3
Real GDP – is the nominal GDP adjusted for inflation using the prices of a
base year (Mankiw, 2007). In this case, the base year is 2017.
2007
Commodity A 20*10 = 300
Commodity B 16*15 = 240
Commodity C 20*35 = 700
Real GDP = 300+240+700 = 1240
2012
Commodity A 10*15 = 150
Commodity B 16*15 = 240
Commodity C 20*35 = 700
Real GDP = 150+240+700 = 1090
2017
Commodity A 12*15 = 180
Commodity B 18*15 = 270
Commodity C 25*35 = 875
Real GDP = 180+270+875 = 1325
2022
Commodity A 15*15 = 225
Commodity B 24*15 = 360
Commodity C 5*35 = 175
Real GDP = 225+360+175 = 760
GDP Deflator
GDP Deflator= Nominal GDP
Real GDP ∗100
⊘ This is a preview!⊘
Do you want full access?
Subscribe today to unlock all pages.

Trusted by 1+ million students worldwide

4
2007
(1240/1240)*100 = 100%
2012
(740/1090)*100 = 68%
2017
(1325/1325)*100 = 100%
2022
(1000/760)*100 = 132%
With investment A
To consider the effect of government investment in 2017, we will need to calculate
the investment multiplier.
Investment multiplier= 1
( 1−MPC )
Where MPC is the marginal propensity to consume, MPC= ∆ C
∆ Y
Where ∆ C is the change in consumption and ∆ Y is the change in income.
Calculating for MPC,
Year 2 = (51,000 – 50,000)/ (51,500 - 50,000) = 0.67
Year 3 = (52,000 – 51,000)/ (53,500 – 51,500) = 0.5
Year 4 = (53,000 – 52,000)/ (56,000 - 53,500) = 0.4
Year 5 = (54,000 – 53,000)/ (59,000 - 56,000) = 0.33
Average MPC = (0.67+0.5+0.4+0.33)/ 4 = 0.47 ≈ 0.5
Investment Multiplier = 1/(1 – 0.5) = 2
Paraphrase This Document
Need a fresh take? Get an instant paraphrase of this document with our AI Paraphraser

5
Real GDP with investment A (2107 Prices). Considering investment will be done in
2017, GDP of the previous years will remain the same except for that of 2022 which
will be affected by the investment.
2007 = 1240
2012 = 1090
2017 = 1325
2022 = without investment GDP + (Investment*Multiplier)
= 760 + (20*2) = 760 + 40 = 800
Real GDP with investment B given GDP of 1300 = 1300 + (20*2) = 1340
GDP (billions of dollars)
2007 2012 2017 2022
Without
Investment
GDP Deflator 100% 68% 100% 132%
Nominal GDP 1240 740 1325 1000
Real GDP (2017
prices)
1240 1090 1325 760
With
Investment
A Real (2017
prices)
1240 1090 1325 800
B Real (2017
prices)
1240 1090 1325 1340
2. B. because it will lead to a higher GDP for the year 2022.
3. Yes. Because hyperinflation will reduce tax revenues, destroy private investments and
drive the cost of living so high.
4. 20% increase in 2017 GDP = 1325*120% = 1590

6
1590 = 760 + (i*2), where i is investment
i = (1590 – 760)/ 2 = $415 billion
5. No. because the private sector will have more money to invest hence improve the
GDP more.
6. Marginal propensity to save is the change in income divided by the change in
consumption.
MPS= ∆ Y
∆ C
It is the reciprocal of MPC. MPS = 1/0.5 = 2
7. Keynesian. In this case, changes in investment will cause a more than proportionate
changes in the GDP. The multiplier effect given by 1/ (1-MPC) gives an effect where
the GDP with investment will grow at twice the rate (Mankiw, 2007).
8. No. because the people will save but will not invest on the GDP growth.
⊘ This is a preview!⊘
Do you want full access?
Subscribe today to unlock all pages.

Trusted by 1+ million students worldwide

7
References
ABEL, A. B., BERNANKE, B., & CROUSHORE, D. D. (2017). Macroeconomics.
CATE, T. (2013). An encyclopedia of Keynesian economics.
DORNBUSCH, R., FISCHER, S., & STARTZ, R. (2014). Macroeconomics.
MANKIW, N. G. (2997). Macroeconomics. New York, Worth Publishers.
TIMLIN, M. F. (2014). Keynesian economics. http://www.deslibris.ca/ID/448174.
1 out of 7
Your All-in-One AI-Powered Toolkit for Academic Success.
+13062052269
info@desklib.com
Available 24*7 on WhatsApp / Email
Unlock your academic potential
Copyright © 2020–2026 A2Z Services. All Rights Reserved. Developed and managed by ZUCOL.


