Economic Factor Analysis: Impact on Business Performance and Ratios
VerifiedAdded on 2023/01/05
|12
|3192
|20
Report
AI Summary
This report examines the influence of economic factors on business performance, dividing the analysis into two parts: macroeconomic and microeconomic factors. It explores how these factors, including market conditions, customer income, and interest rates, affect a company's operations. The report further analyzes financial performance using ratio analysis, calculating key ratios like Return on Capital Employed, Net Profit Margin, Current Ratio, Debtors Collection Period, Creditors Collection Period, and Efficiency Ratio for a specific company over three years. The analysis reveals the company's financial health, highlighting areas of strength and weakness, and providing insights into its liquidity, profitability, and operational efficiency. The report concludes with recommendations based on the financial analysis.

St John Ambulance
Paraphrase This Document
Need a fresh take? Get an instant paraphrase of this document with our AI Paraphraser
EXECUTIVE SUMMARY
The module is related of economic factor and their impact on business. In order to take wise
decisions and drive the organisation to higher heights, economic conditions influence the firm.
This starts, however, with an appreciation of the position and the execution inside company of
industrial and external influences. The assignment is based on analysis of different kinds of
factors and their impact on business performance. In order to make detailed analysis, the report is
divided into two parts named as A & B. In the part A detailed information about impact of
factors like Macro-Economic, MICRO Economic is mentioned on business. While in part B,
analysis of ratios has been done. The analysis has been done in order to assess financial
performance of mentioned company. The key ratios which are calculated and interpreted are
Return on capital employed, Net profit margin etc.
The ratio analysis plays a key role in order to make proper analysis of financial performance of
companies. Ratio analysis represents a quantitative approach by examiner the financial reports,
including the balance sheet and sales reports, for obtaining insights into liquidity, operating
performance and profitability. Ratio analyses are the basic foundations of the study of equity.
Ratio analysis is a valuable method for managing quarter reports that increases the over time
comprehension and offers key corporate performance metrics. Supervisors can use ratio analysis
to define advantages and disadvantages that can form policies and actions. This technique is
useful to save time and cost of companies to make analysis of financial performance of a
particular year.
Contents
EXECUTIVE SUMMARY.............................................................................................................2
Contents...........................................................................................................................................3
INTRODUCTION...........................................................................................................................1
MAIN BODY..................................................................................................................................1
A. Analysis of Economic Factors and their impacts on the Business.........................................1
B. Given below ratios are calculated for three years...................................................................3
RECOMMENDATION...................................................................................................................7
CONCLUSION................................................................................................................................8
REFRENCES...................................................................................................................................1
⊘ This is a preview!⊘
Do you want full access?
Subscribe today to unlock all pages.
Trusted by 1+ million students worldwide
INTRODUCTION
The economic variables include demand, wages, borrowing costs, bank and inflation, as well as
general leading forecasts, which influence industry (Bahloul and et.al., 2018). There are also
some laws in the country listed in the following: market legal considerations. Basically, there are
two types of economic factors which are macro and micro. Under macroeconomic factors those
elements are including which are related to make a significant impact on overall performance of
business. On the other hands, in micro economic factors various kinds of elements are included
which can affect both to the small and large business entities. The report is divided in different
sections and in next part of report detailed analysis of financial performance has been done by
help of ratio analysis. Mainly, there are key ratios profitability, liquidity etc. are computed which
are interpreted in order to assess financial performance of given company.
MAIN BODY
A. Analysis of Economic Factors and their impacts on the Business.
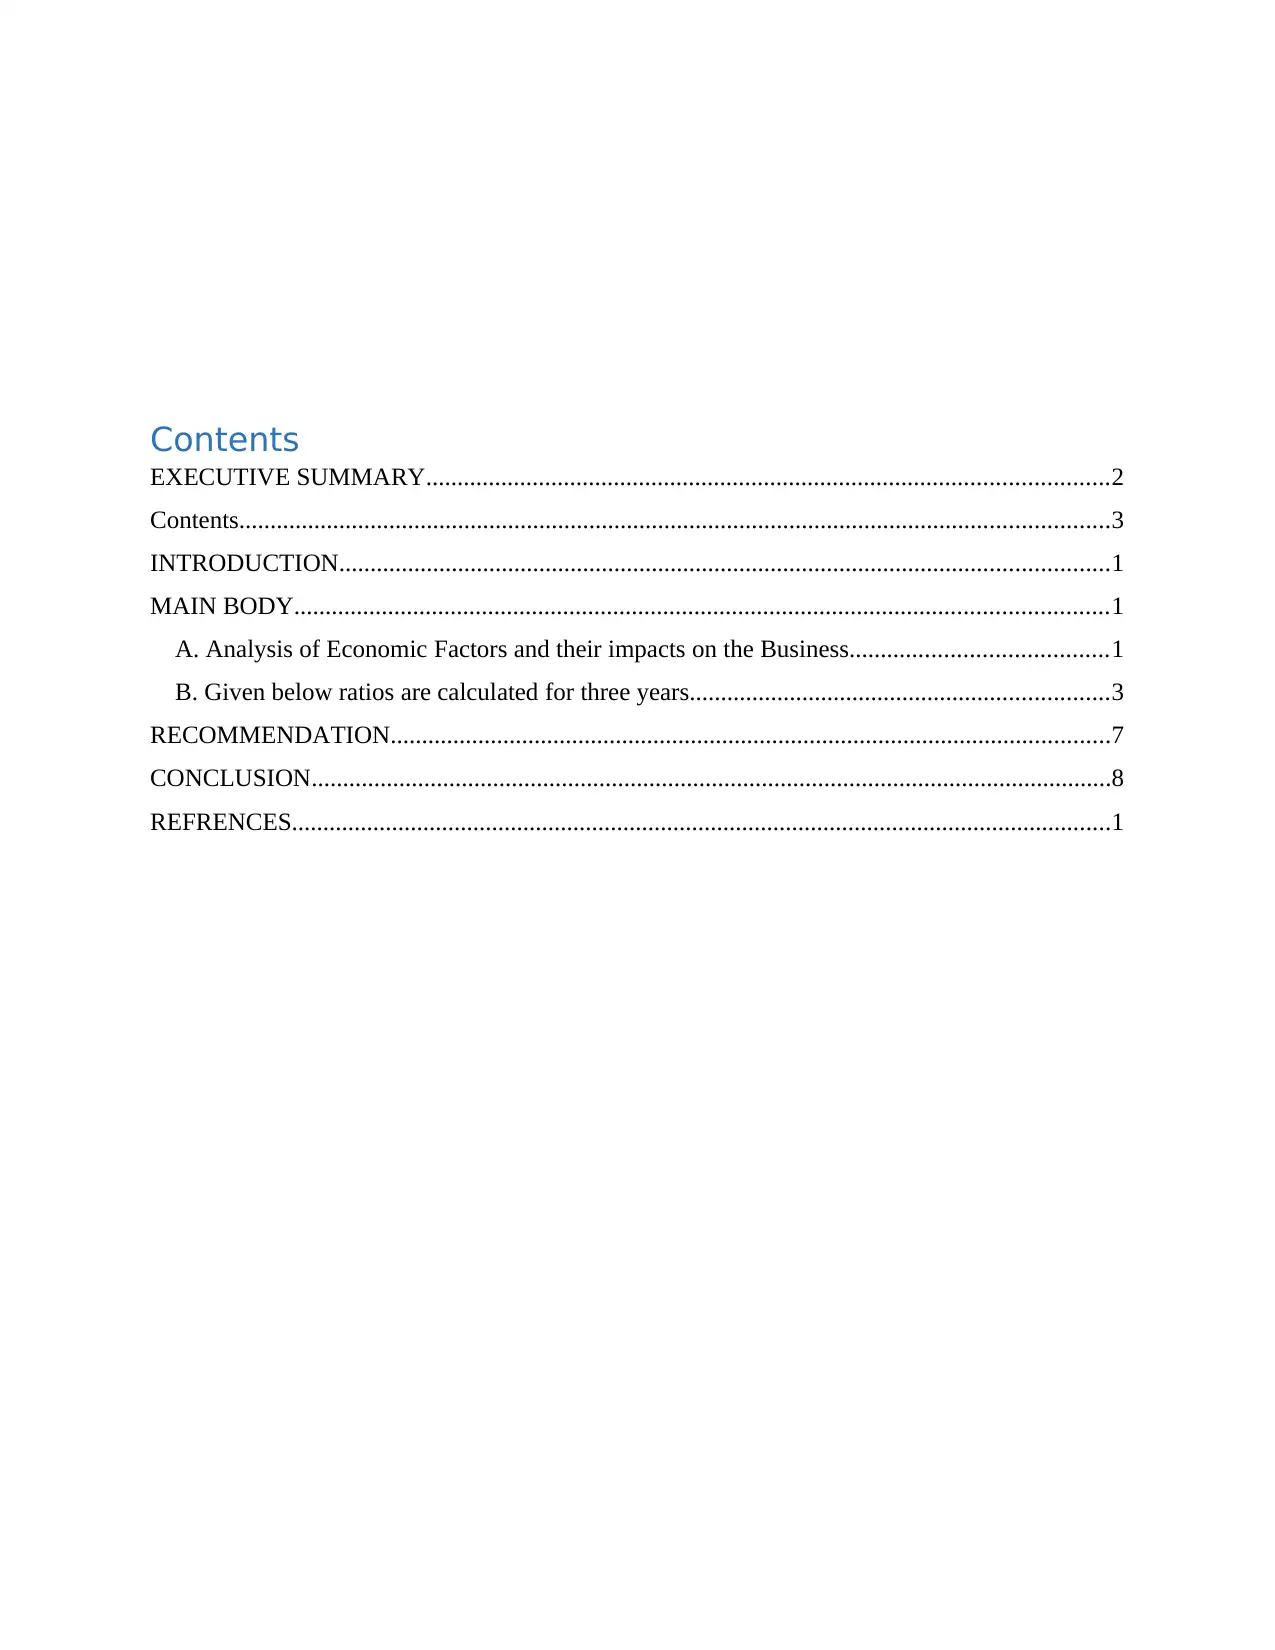
Macro-Economic Factors- A significant monetary, natural or geographic event which main load
a regional and national economic is a factors. Instead of a few chosen people, macroeconomic
conditions have an effect on vast communities (Cai, 2016). Economic production, unemployment
levels and inflation are manifestations of macroeconomic influences. These economic prosperity
metrics. Below a diagram is presented which states that macroeconomic factor can affect the
business:
1
The economic variables include demand, wages, borrowing costs, bank and inflation, as well as
general leading forecasts, which influence industry (Bahloul and et.al., 2018). There are also
some laws in the country listed in the following: market legal considerations. Basically, there are
two types of economic factors which are macro and micro. Under macroeconomic factors those
elements are including which are related to make a significant impact on overall performance of
business. On the other hands, in micro economic factors various kinds of elements are included
which can affect both to the small and large business entities. The report is divided in different
sections and in next part of report detailed analysis of financial performance has been done by
help of ratio analysis. Mainly, there are key ratios profitability, liquidity etc. are computed which
are interpreted in order to assess financial performance of given company.
MAIN BODY
A. Analysis of Economic Factors and their impacts on the Business.
Macro-Economic Factors- A significant monetary, natural or geographic event which main load
a regional and national economic is a factors. Instead of a few chosen people, macroeconomic
conditions have an effect on vast communities (Cai, 2016). Economic production, unemployment
levels and inflation are manifestations of macroeconomic influences. These economic prosperity
metrics. Below a diagram is presented which states that macroeconomic factor can affect the
business:
1
Paraphrase This Document
Need a fresh take? Get an instant paraphrase of this document with our AI Paraphraser
The above chart is showing that shift in price of products can affect the demand of products.
The chart is stating that when price of product increases than demand of product is decrease.
While if price of product decreases than demand of product is increasing (Tkachev. and
et.al., 2018). It is showing that there is significant relation between demand and price of
product.
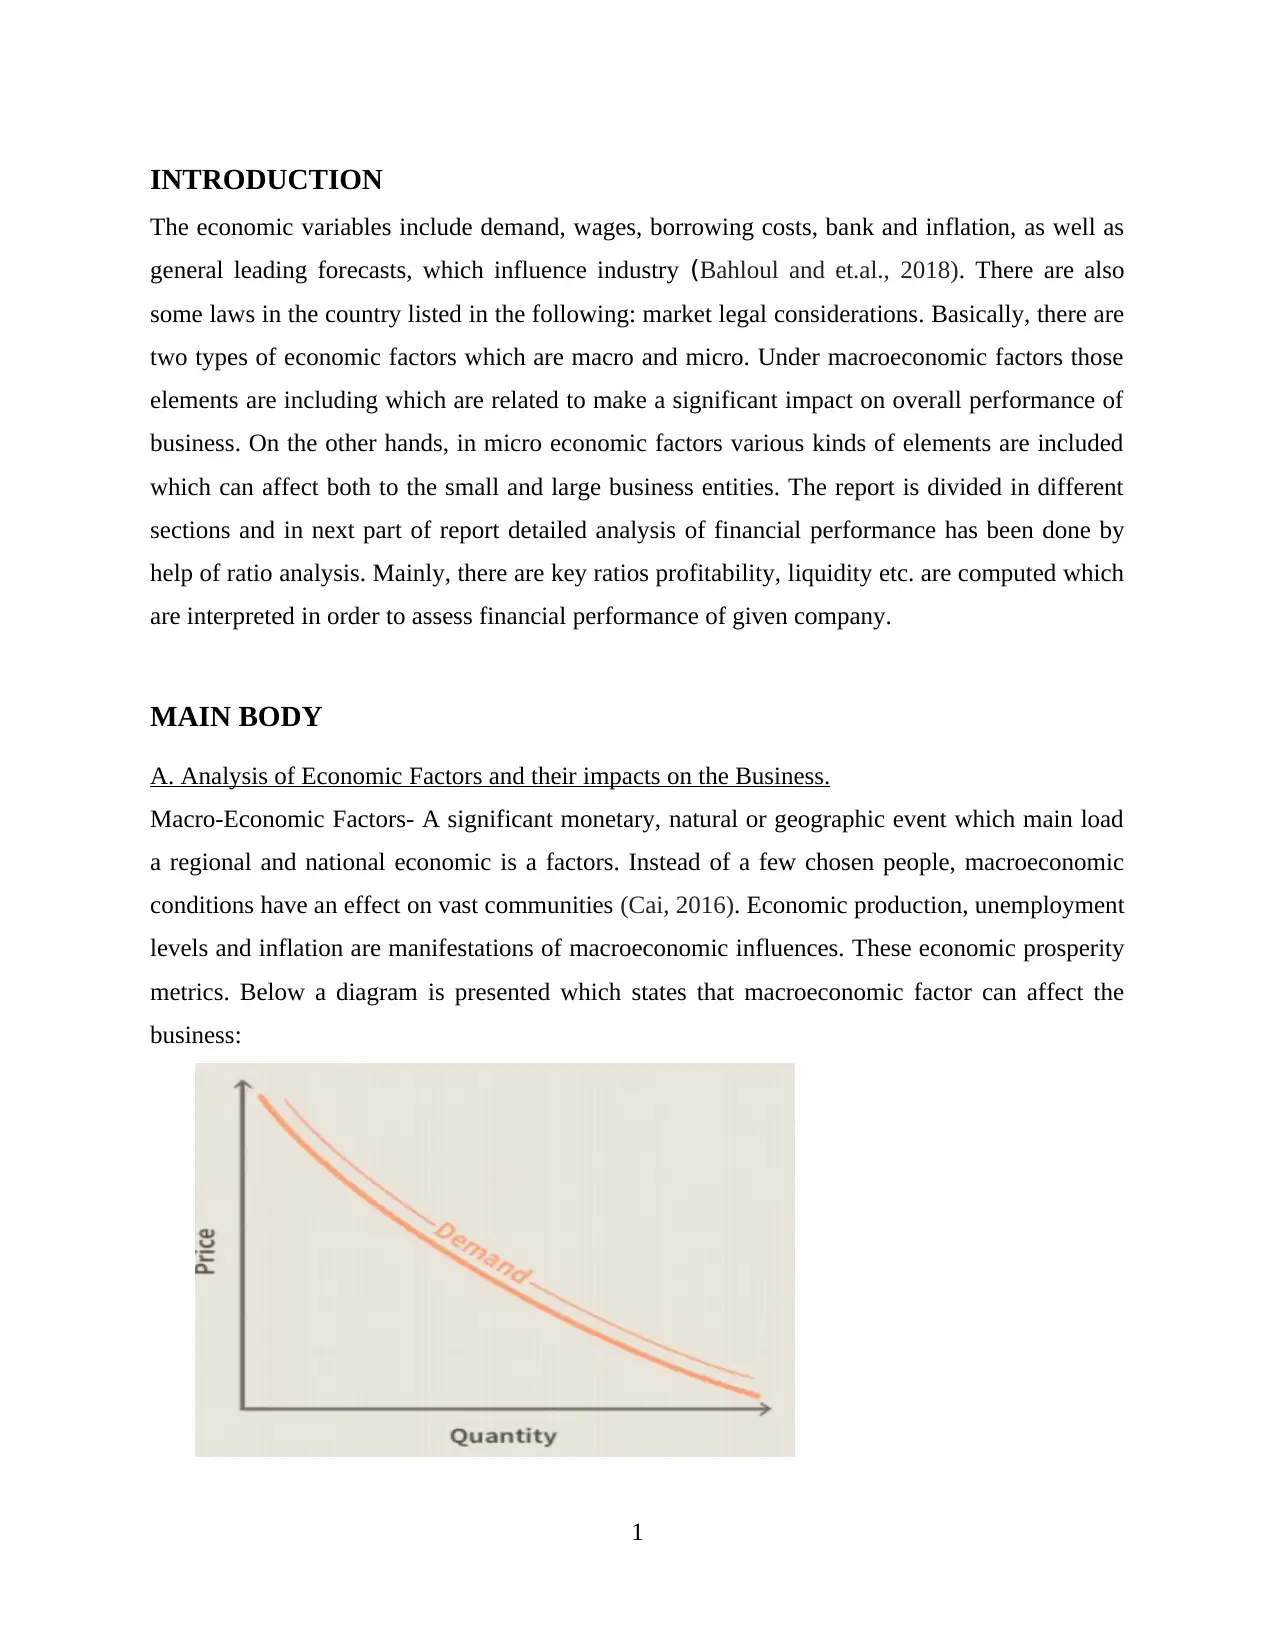
Micro economic factor- Microeconomics encompasses influences that affect individuals and
companies on the allocation and accessibility of capital (Cui, 2016). Customers, workers, rivals,
media, shareholders and vendors are six microeconomic market drivers influencing nearly every
market. These factors have a significant impact on company’s performance. This is so because
customers have ability to increase and decrease in demand of products and services. Below a
diagram is presented which shows that micro economic factors have significant impact on
business:
The above chart shows relation between income of customers and demand of goods. As
income of customer increase the demand of product is decreasing (Yap, Komalasari and
Hadiansah, 2018.
Comment on performance of company.
In last three years, company’s performance has been affected and changed in effective manner.
This is so because change in interest rate in UK is leading to decrease in loan capacity of
company and they are not able to take financial assistance in order to meet customers’ demand
(Danoshana and Ravivathani, 2019). As well as change in income level of customers is also
2
The chart is stating that when price of product increases than demand of product is decrease.
While if price of product decreases than demand of product is increasing (Tkachev. and
et.al., 2018). It is showing that there is significant relation between demand and price of
product.
Micro economic factor- Microeconomics encompasses influences that affect individuals and
companies on the allocation and accessibility of capital (Cui, 2016). Customers, workers, rivals,
media, shareholders and vendors are six microeconomic market drivers influencing nearly every
market. These factors have a significant impact on company’s performance. This is so because
customers have ability to increase and decrease in demand of products and services. Below a
diagram is presented which shows that micro economic factors have significant impact on
business:
The above chart shows relation between income of customers and demand of goods. As
income of customer increase the demand of product is decreasing (Yap, Komalasari and
Hadiansah, 2018.
Comment on performance of company.
In last three years, company’s performance has been affected and changed in effective manner.
This is so because change in interest rate in UK is leading to decrease in loan capacity of
company and they are not able to take financial assistance in order to meet customers’ demand
(Danoshana and Ravivathani, 2019). As well as change in income level of customers is also
2
leading to variation in product’s demand. This is so because income is higher than customers will
demand for more products.
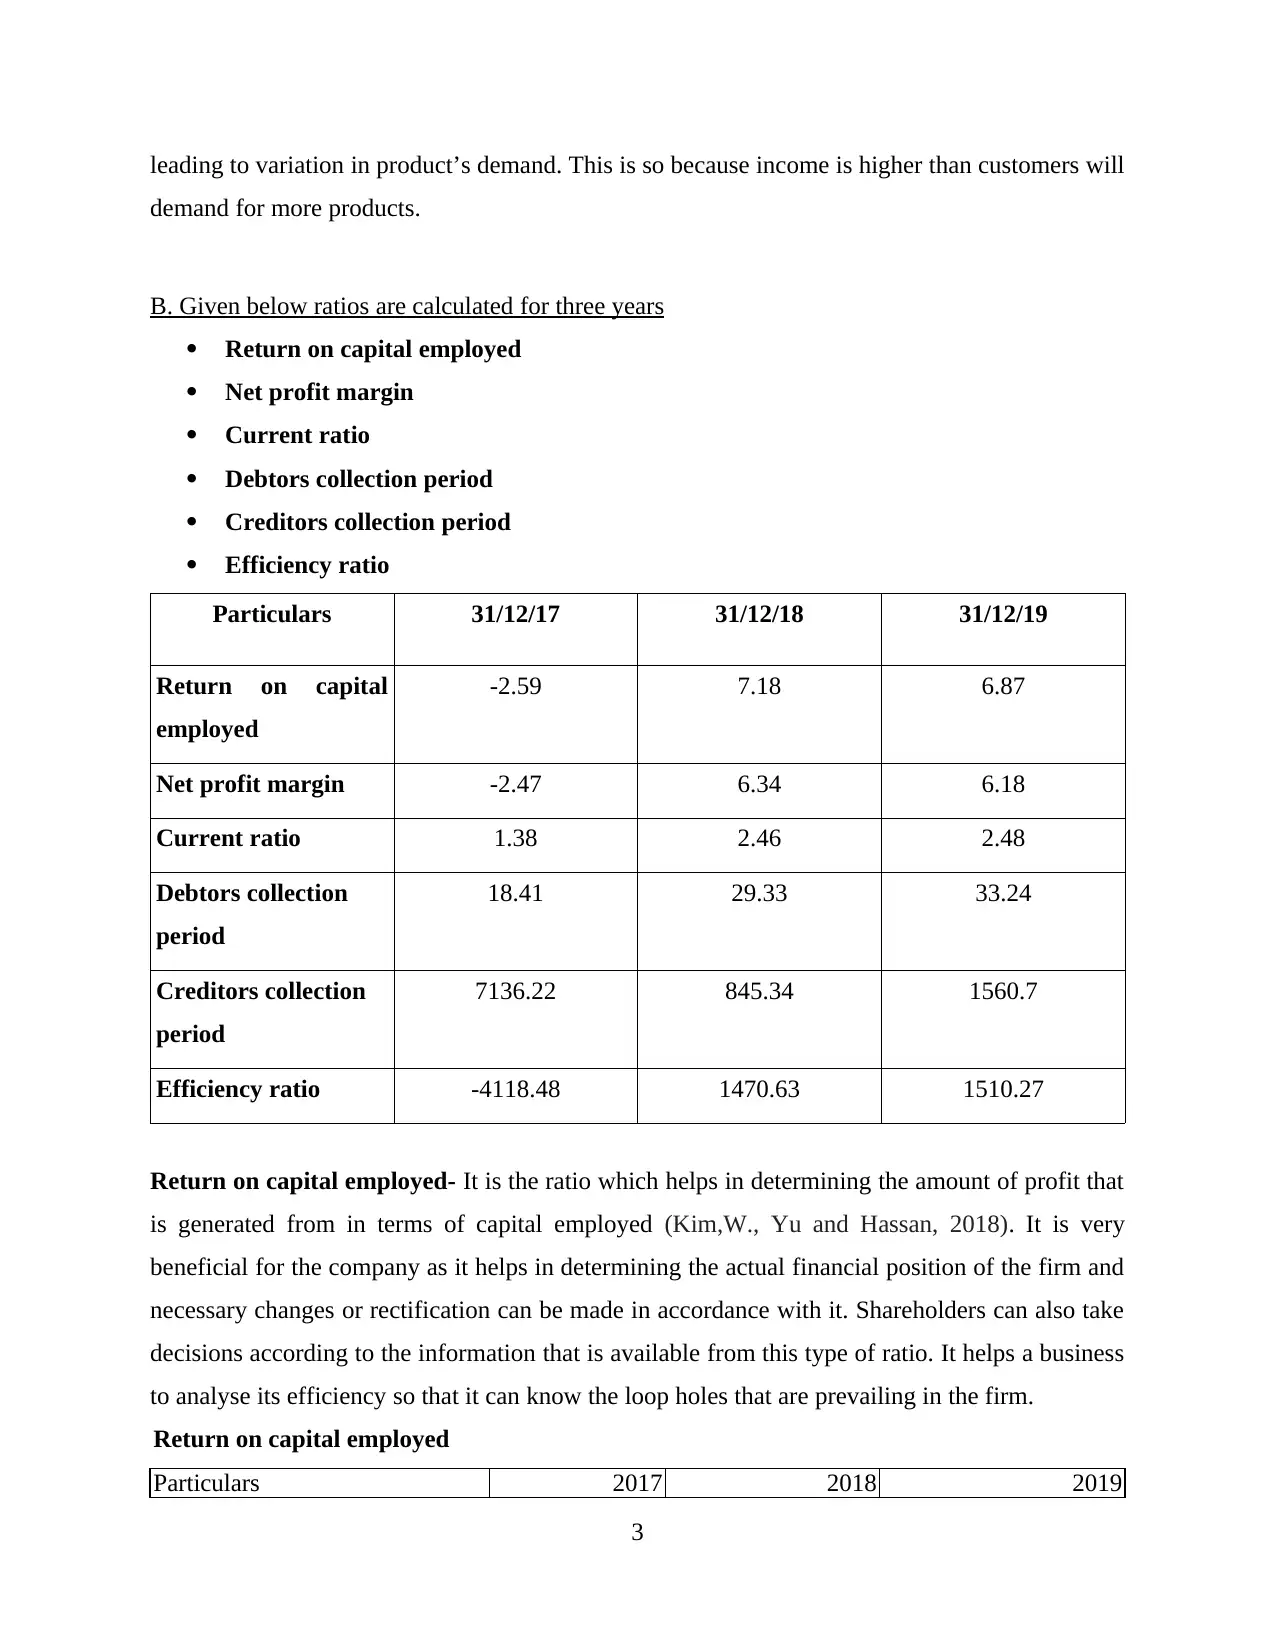
B. Given below ratios are calculated for three years
Return on capital employed
Net profit margin
Current ratio
Debtors collection period
Creditors collection period
Efficiency ratio
Particulars 31/12/17 31/12/18 31/12/19
Return on capital
employed
-2.59 7.18 6.87
Net profit margin -2.47 6.34 6.18
Current ratio 1.38 2.46 2.48
Debtors collection
period
18.41 29.33 33.24
Creditors collection
period
7136.22 845.34 1560.7
Efficiency ratio -4118.48 1470.63 1510.27
Return on capital employed- It is the ratio which helps in determining the amount of profit that
is generated from in terms of capital employed (Kim,W., Yu and Hassan, 2018). It is very
beneficial for the company as it helps in determining the actual financial position of the firm and
necessary changes or rectification can be made in accordance with it. Shareholders can also take
decisions according to the information that is available from this type of ratio. It helps a business
to analyse its efficiency so that it can know the loop holes that are prevailing in the firm.
Return on capital employed
Particulars 2017 2018 2019
3
demand for more products.
B. Given below ratios are calculated for three years
Return on capital employed
Net profit margin
Current ratio
Debtors collection period
Creditors collection period
Efficiency ratio
Particulars 31/12/17 31/12/18 31/12/19
Return on capital
employed
-2.59 7.18 6.87
Net profit margin -2.47 6.34 6.18
Current ratio 1.38 2.46 2.48
Debtors collection
period
18.41 29.33 33.24
Creditors collection
period
7136.22 845.34 1560.7
Efficiency ratio -4118.48 1470.63 1510.27
Return on capital employed- It is the ratio which helps in determining the amount of profit that
is generated from in terms of capital employed (Kim,W., Yu and Hassan, 2018). It is very
beneficial for the company as it helps in determining the actual financial position of the firm and
necessary changes or rectification can be made in accordance with it. Shareholders can also take
decisions according to the information that is available from this type of ratio. It helps a business
to analyse its efficiency so that it can know the loop holes that are prevailing in the firm.
Return on capital employed
Particulars 2017 2018 2019
3
⊘ This is a preview!⊘
Do you want full access?
Subscribe today to unlock all pages.
Trusted by 1+ million students worldwide
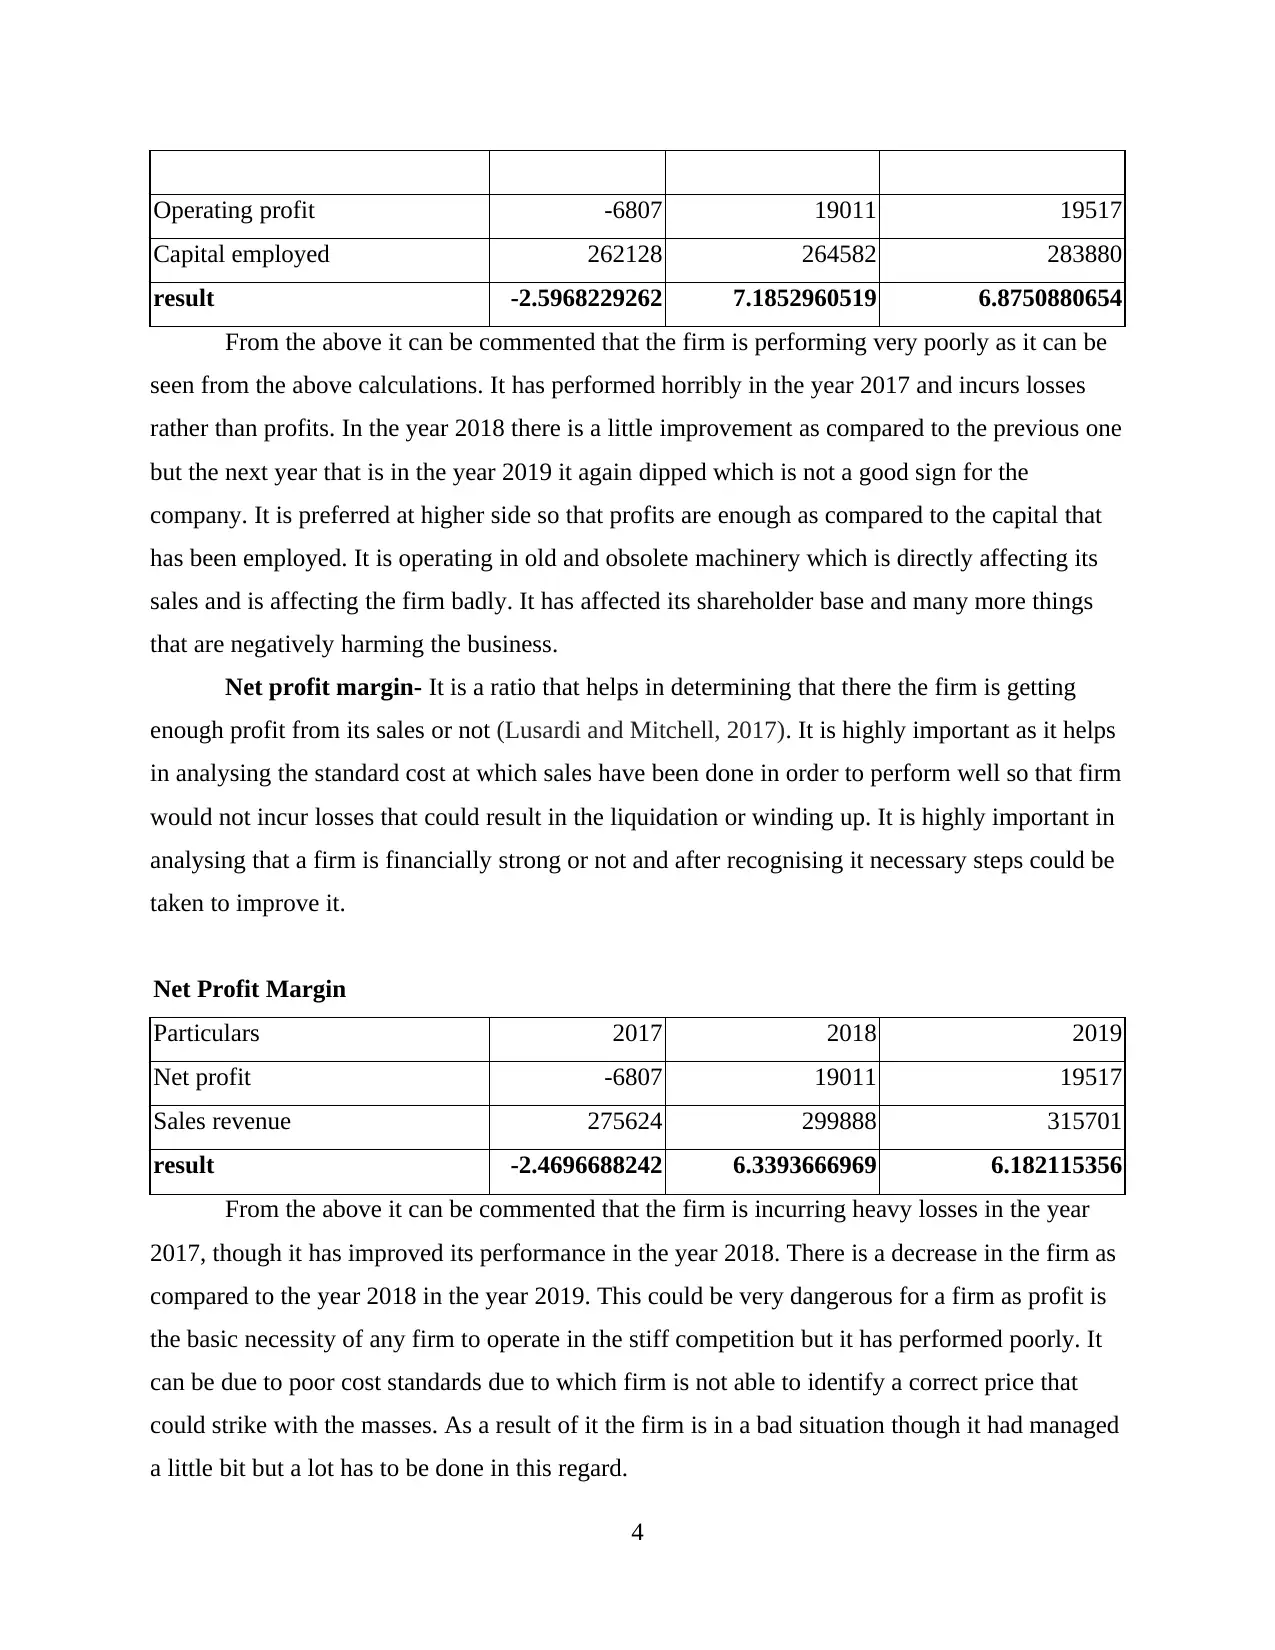
Operating profit -6807 19011 19517
Capital employed 262128 264582 283880
result -2.5968229262 7.1852960519 6.8750880654
From the above it can be commented that the firm is performing very poorly as it can be
seen from the above calculations. It has performed horribly in the year 2017 and incurs losses
rather than profits. In the year 2018 there is a little improvement as compared to the previous one
but the next year that is in the year 2019 it again dipped which is not a good sign for the
company. It is preferred at higher side so that profits are enough as compared to the capital that
has been employed. It is operating in old and obsolete machinery which is directly affecting its
sales and is affecting the firm badly. It has affected its shareholder base and many more things
that are negatively harming the business.
Net profit margin- It is a ratio that helps in determining that there the firm is getting
enough profit from its sales or not (Lusardi and Mitchell, 2017). It is highly important as it helps
in analysing the standard cost at which sales have been done in order to perform well so that firm
would not incur losses that could result in the liquidation or winding up. It is highly important in
analysing that a firm is financially strong or not and after recognising it necessary steps could be
taken to improve it.
Net Profit Margin
Particulars 2017 2018 2019
Net profit -6807 19011 19517
Sales revenue 275624 299888 315701
result -2.4696688242 6.3393666969 6.182115356
From the above it can be commented that the firm is incurring heavy losses in the year
2017, though it has improved its performance in the year 2018. There is a decrease in the firm as
compared to the year 2018 in the year 2019. This could be very dangerous for a firm as profit is
the basic necessity of any firm to operate in the stiff competition but it has performed poorly. It
can be due to poor cost standards due to which firm is not able to identify a correct price that
could strike with the masses. As a result of it the firm is in a bad situation though it had managed
a little bit but a lot has to be done in this regard.
4
Paraphrase This Document
Need a fresh take? Get an instant paraphrase of this document with our AI Paraphraser
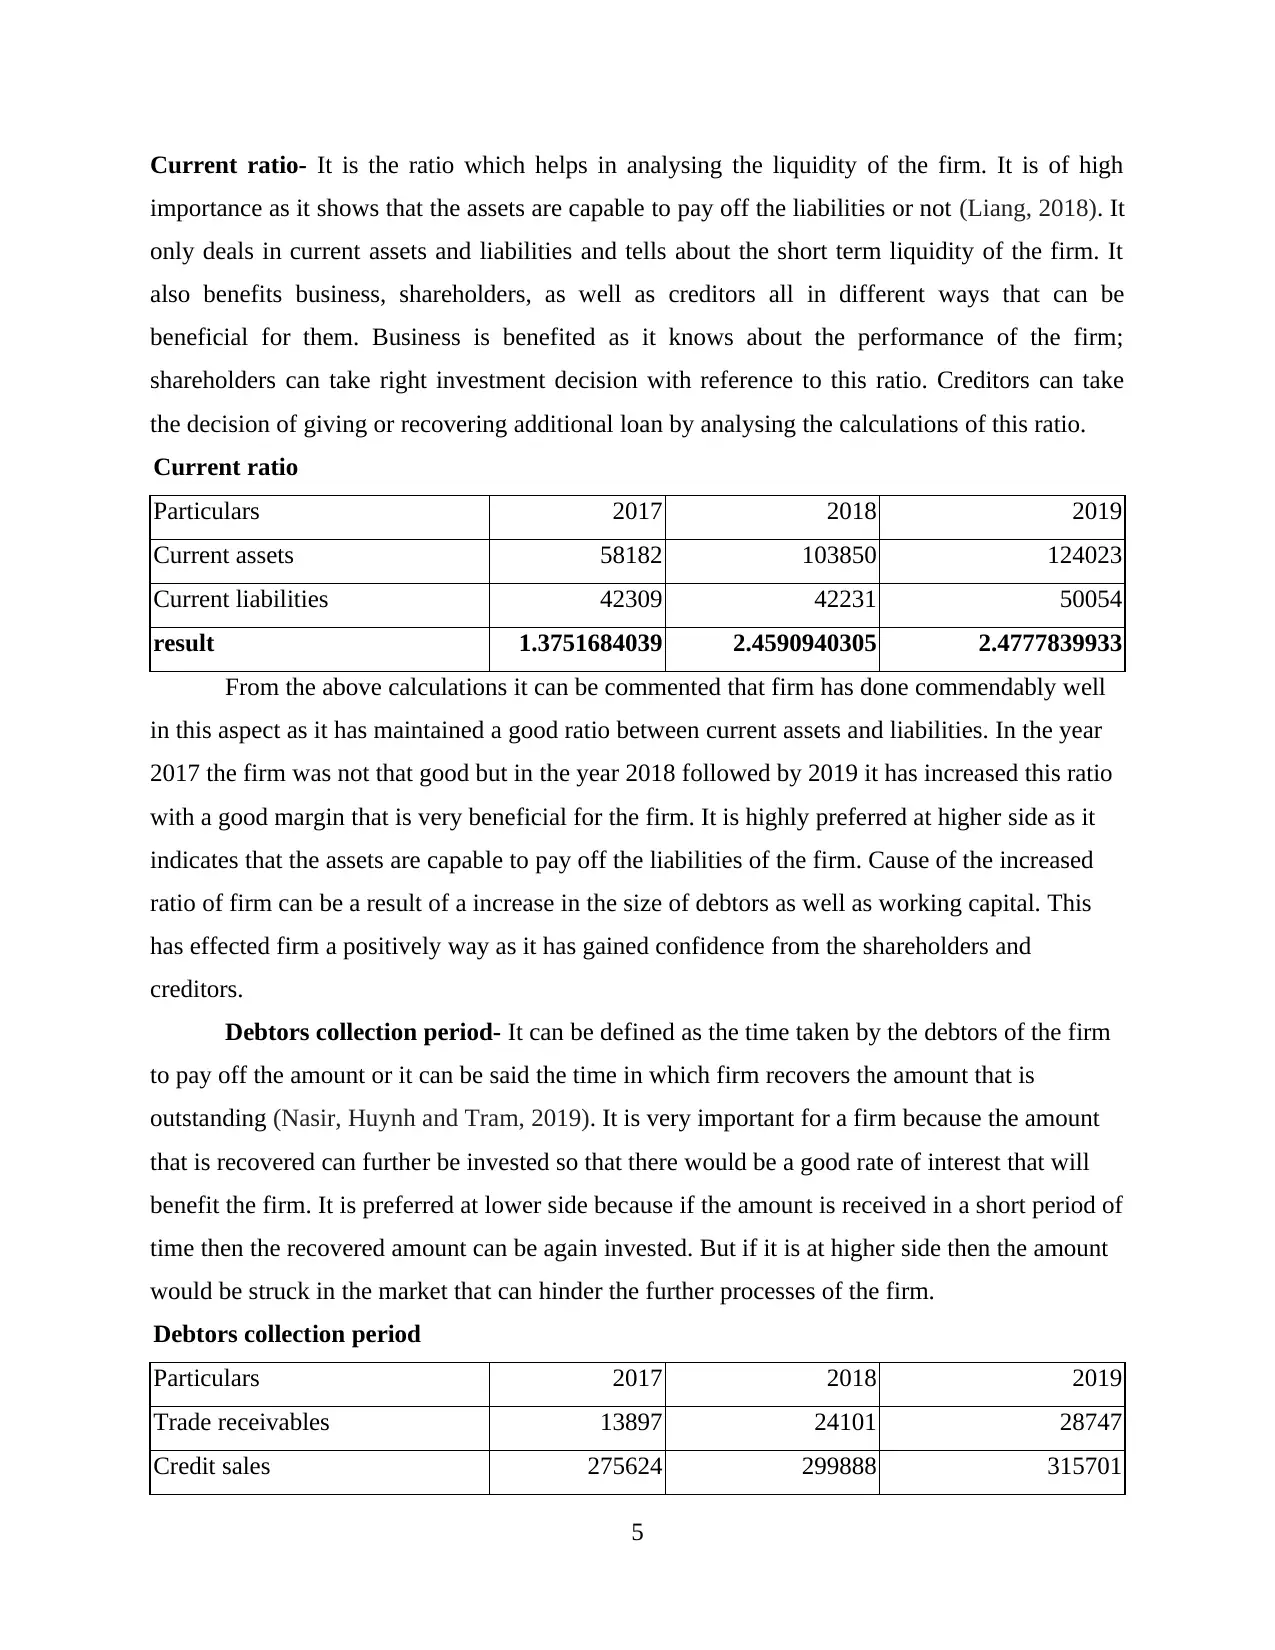
Current ratio- It is the ratio which helps in analysing the liquidity of the firm. It is of high
importance as it shows that the assets are capable to pay off the liabilities or not (Liang, 2018). It
only deals in current assets and liabilities and tells about the short term liquidity of the firm. It
also benefits business, shareholders, as well as creditors all in different ways that can be
beneficial for them. Business is benefited as it knows about the performance of the firm;
shareholders can take right investment decision with reference to this ratio. Creditors can take
the decision of giving or recovering additional loan by analysing the calculations of this ratio.
Current ratio
Particulars 2017 2018 2019
Current assets 58182 103850 124023
Current liabilities 42309 42231 50054
result 1.3751684039 2.4590940305 2.4777839933
From the above calculations it can be commented that firm has done commendably well
in this aspect as it has maintained a good ratio between current assets and liabilities. In the year
2017 the firm was not that good but in the year 2018 followed by 2019 it has increased this ratio
with a good margin that is very beneficial for the firm. It is highly preferred at higher side as it
indicates that the assets are capable to pay off the liabilities of the firm. Cause of the increased
ratio of firm can be a result of a increase in the size of debtors as well as working capital. This
has effected firm a positively way as it has gained confidence from the shareholders and
creditors.
Debtors collection period- It can be defined as the time taken by the debtors of the firm
to pay off the amount or it can be said the time in which firm recovers the amount that is
outstanding (Nasir, Huynh and Tram, 2019). It is very important for a firm because the amount
that is recovered can further be invested so that there would be a good rate of interest that will
benefit the firm. It is preferred at lower side because if the amount is received in a short period of
time then the recovered amount can be again invested. But if it is at higher side then the amount
would be struck in the market that can hinder the further processes of the firm.
Debtors collection period
Particulars 2017 2018 2019
Trade receivables 13897 24101 28747
Credit sales 275624 299888 315701
5
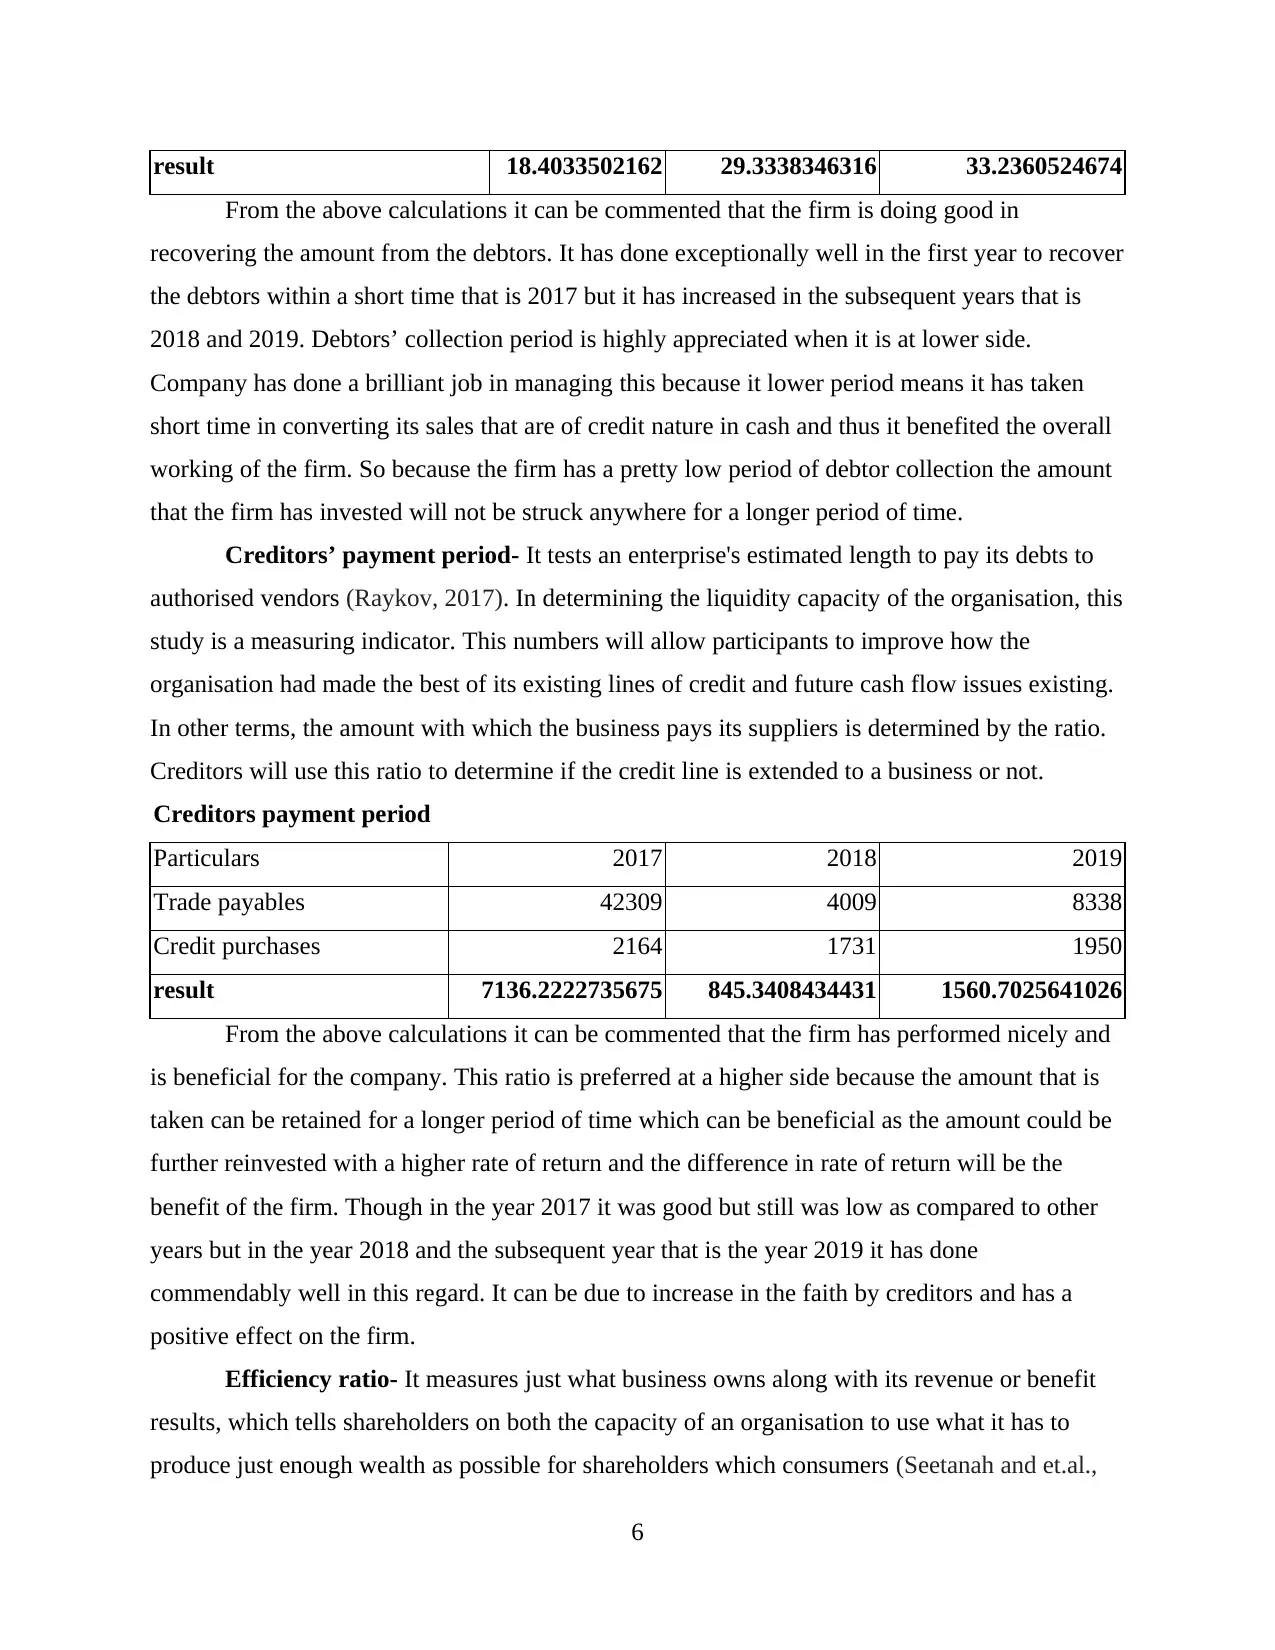
result 18.4033502162 29.3338346316 33.2360524674
From the above calculations it can be commented that the firm is doing good in
recovering the amount from the debtors. It has done exceptionally well in the first year to recover
the debtors within a short time that is 2017 but it has increased in the subsequent years that is
2018 and 2019. Debtors’ collection period is highly appreciated when it is at lower side.
Company has done a brilliant job in managing this because it lower period means it has taken
short time in converting its sales that are of credit nature in cash and thus it benefited the overall
working of the firm. So because the firm has a pretty low period of debtor collection the amount
that the firm has invested will not be struck anywhere for a longer period of time.
Creditors’ payment period- It tests an enterprise's estimated length to pay its debts to
authorised vendors (Raykov, 2017). In determining the liquidity capacity of the organisation, this
study is a measuring indicator. This numbers will allow participants to improve how the
organisation had made the best of its existing lines of credit and future cash flow issues existing.
In other terms, the amount with which the business pays its suppliers is determined by the ratio.
Creditors will use this ratio to determine if the credit line is extended to a business or not.
Creditors payment period
Particulars 2017 2018 2019
Trade payables 42309 4009 8338
Credit purchases 2164 1731 1950
result 7136.2222735675 845.3408434431 1560.7025641026
From the above calculations it can be commented that the firm has performed nicely and
is beneficial for the company. This ratio is preferred at a higher side because the amount that is
taken can be retained for a longer period of time which can be beneficial as the amount could be
further reinvested with a higher rate of return and the difference in rate of return will be the
benefit of the firm. Though in the year 2017 it was good but still was low as compared to other
years but in the year 2018 and the subsequent year that is the year 2019 it has done
commendably well in this regard. It can be due to increase in the faith by creditors and has a
positive effect on the firm.
Efficiency ratio- It measures just what business owns along with its revenue or benefit
results, which tells shareholders on both the capacity of an organisation to use what it has to
produce just enough wealth as possible for shareholders which consumers (Seetanah and et.al.,
6
⊘ This is a preview!⊘
Do you want full access?
Subscribe today to unlock all pages.
Trusted by 1+ million students worldwide
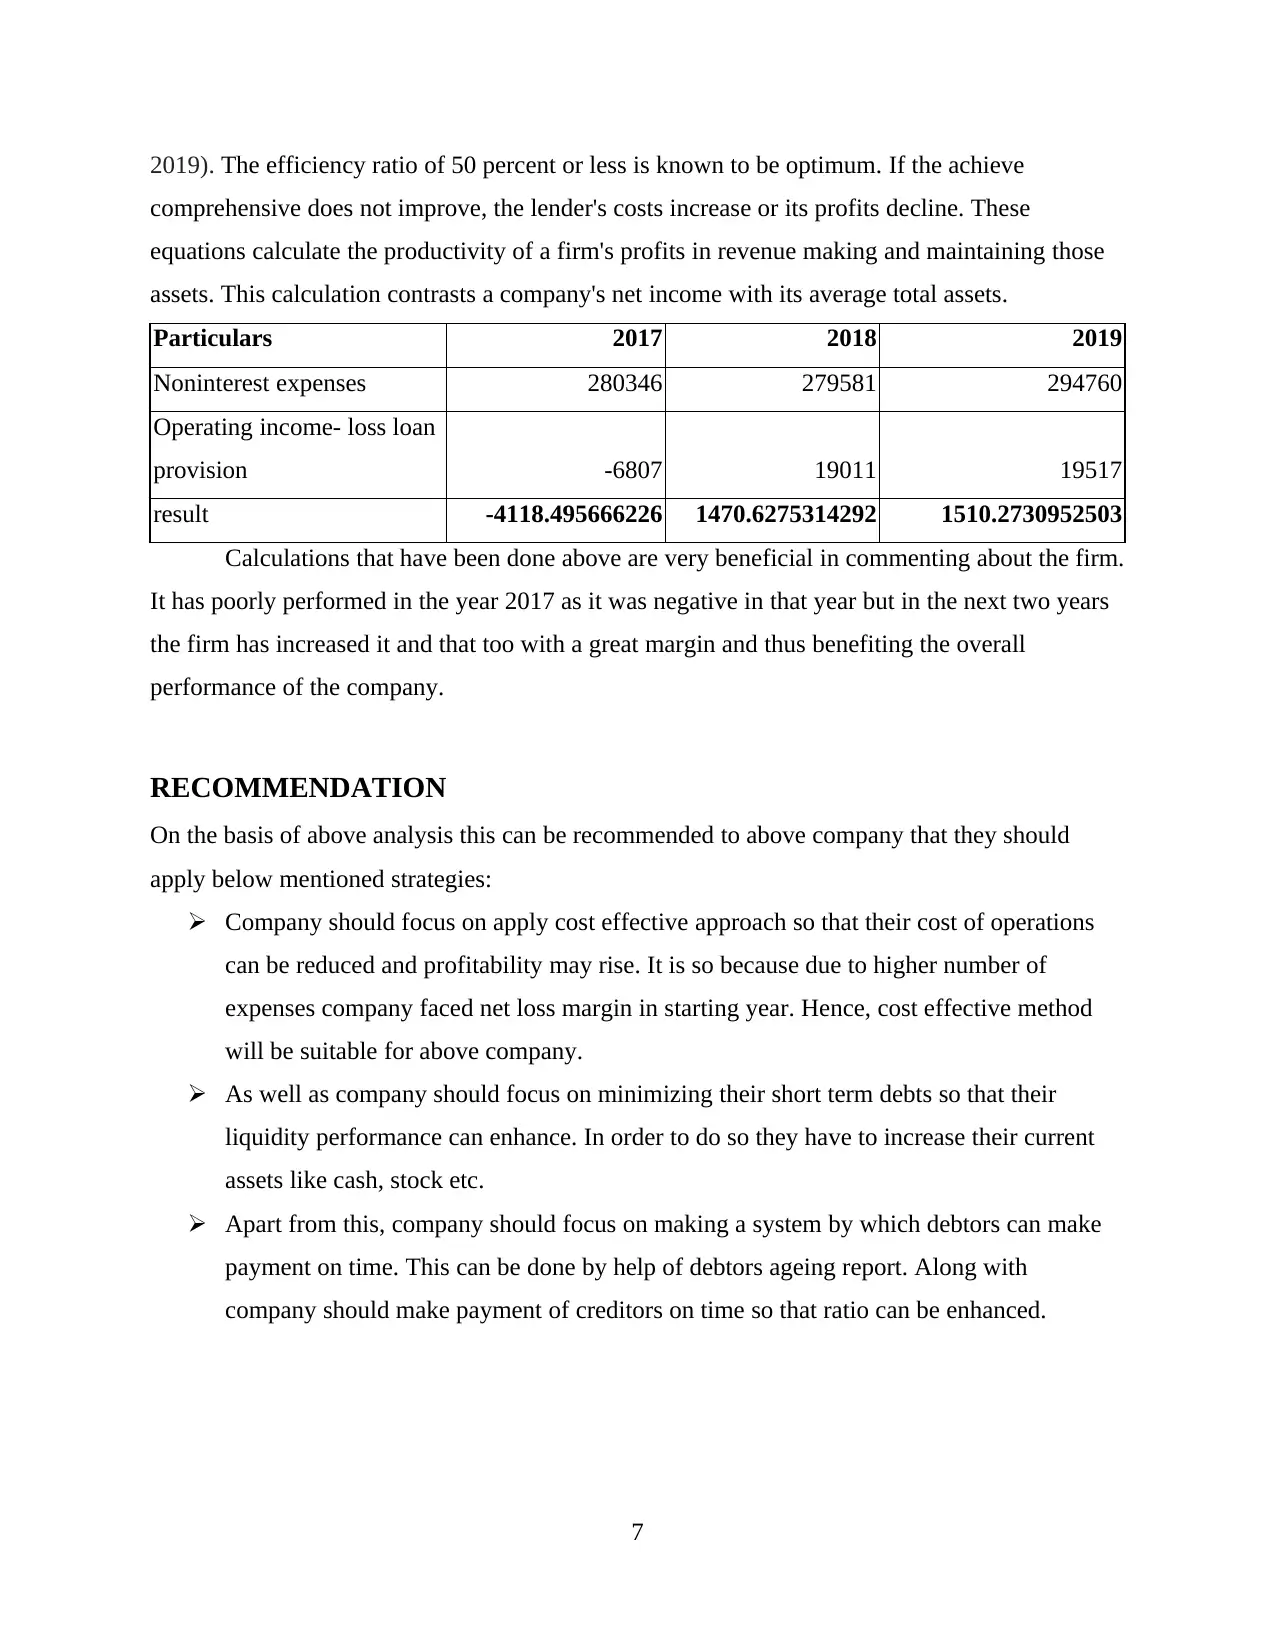
2019). The efficiency ratio of 50 percent or less is known to be optimum. If the achieve
comprehensive does not improve, the lender's costs increase or its profits decline. These
equations calculate the productivity of a firm's profits in revenue making and maintaining those
assets. This calculation contrasts a company's net income with its average total assets.
Particulars 2017 2018 2019
Noninterest expenses 280346 279581 294760
Operating income- loss loan
provision -6807 19011 19517
result -4118.495666226 1470.6275314292 1510.2730952503
Calculations that have been done above are very beneficial in commenting about the firm.
It has poorly performed in the year 2017 as it was negative in that year but in the next two years
the firm has increased it and that too with a great margin and thus benefiting the overall
performance of the company.
RECOMMENDATION
On the basis of above analysis this can be recommended to above company that they should
apply below mentioned strategies:
Company should focus on apply cost effective approach so that their cost of operations
can be reduced and profitability may rise. It is so because due to higher number of
expenses company faced net loss margin in starting year. Hence, cost effective method
will be suitable for above company.
As well as company should focus on minimizing their short term debts so that their
liquidity performance can enhance. In order to do so they have to increase their current
assets like cash, stock etc.
Apart from this, company should focus on making a system by which debtors can make
payment on time. This can be done by help of debtors ageing report. Along with
company should make payment of creditors on time so that ratio can be enhanced.
7
Paraphrase This Document
Need a fresh take? Get an instant paraphrase of this document with our AI Paraphraser

CONCLUSION
From the topic above, monetary and fiscal management was concluded that its operating
operations are very relevant. Several financial ratios are used to measure the three years of the
above company’s results and to determine that it does well and which actions it needs to take to
boost its quality and performance.
8
REFRENCES
Books and journal ;
Bahloul, W. and et.al., 2018. The role of economic and financial uncertainties in predicting
commodity futures returns and volatility: Evidence from a nonparametric causality-in-
quantiles test.Journal of Multinational Financial Management. 45. pp.52-71.
Cai, Y., 2016. A general quantile function model for economic and financial time
series.Econometric Reviews. 35(7). pp. 1173-1193.
Cui, J., 2016, April. Study on the Dynamic Financial Management Mode under E-commerce
Era. In International Conference on Education, Management and Computing
Technology (ICEMCT-16). Atlantis Press.
Danoshana, S. and Ravivathani, T., 2019. The impact of the corporate governance on firm
performance: A study on financial institutions in Sri Lanka.SAARJ Journal on Banking
& Insurance Research. 8(1). pp.62-67.
Kim, D. W., Yu, J. S. and Hassan, M. K., 2018. Financial inclusion and economic growth in OIC
countries.Research in International Business and Finance. 43. pp.1-14.
Liang, X., 2018. Integrated economic and financial analysis of China’s Sponge city program for
water-resilient urban development.Sustainability. 10(3). p.669.
Lusardi, A. and Mitchell, O. S., 2017. How ordinary consumers make complex economic
decisions: Financial literacy and retirement readiness.Quarterly Journal of Finance.
7(03). p.1750008.
Nasir, M. A., Huynh, T. L. D. and Tram, H .T. X., 2019. Role of financial development,
economic growth & foreign direct investment in driving climate change: A case of
emerging ASEAN.Journal of environmental management. 242. pp.131-141.
Raykov, E., 2017. The liquidity-profitability trade-off in Bulgaria in terms of the changed
financial management functions during crisis.Management: journal of contemporary
management issues. 22(1). pp.135-156.
Seetanah, B. and et.al., 2019. Impact of economic and financial development on environmental
degradation: evidence from small island developing states (SIDS).Emerging Markets
Finance and Trade. 55(2). pp.308-322.
Tkachev, S .I. and et.al., 2018. Economic and Mathematical Modeling of Quantitative
Assessment of Financial Risks of Agricultural Enterprises.Journal of Applied Economic
Sciences. 13(3).
Yap, R. J .C., Komalasari, F. and Hadiansah, I., 2018. The Effect of Financial Literacy and
Attitude on Financial Management Behavior and Satisfaction.Bisnis & Birokrasi
Journal. 23(3).
⊘ This is a preview!⊘
Do you want full access?
Subscribe today to unlock all pages.
Trusted by 1+ million students worldwide
1 out of 12
Related Documents


Your All-in-One AI-Powered Toolkit for Academic Success.
+13062052269
info@desklib.com
Available 24*7 on WhatsApp / Email
![[object Object]](/_next/static/media/star-bottom.7253800d.svg)
Unlock your academic potential
Copyright © 2020–2026 A2Z Services. All Rights Reserved. Developed and managed by ZUCOL.