Economics Report: Impact of Economic Factors on Toys R Us
VerifiedAdded on 2023/01/13
|16
|3601
|39
Report
AI Summary
This economics report delves into the business environment of Toys "R" Us, examining factors influencing its production, profitability, and decision-making processes. It begins by identifying factors impacting the economy, specifically supply and demand dynamics, and micro and macro factors contributing to the company's failure. The report then evaluates Toys "R" Us' financial information, analyzing profitability, liquidity, leverage, and efficiency ratios. Finally, it explores investment appraisal techniques such as payback period, net present value, internal rate of return, and accounting rate of return. The report concludes with recommendations based on the analysis of the company's performance.
Report Economics
Paraphrase This Document
Need a fresh take? Get an instant paraphrase of this document with our AI Paraphraser
Table of Contents
INTRODUCTION...........................................................................................................................3
MAIN BODY...................................................................................................................................3
1. Identify factors which impact economy.......................................................................................3
1.1 Supply & Demand of Goods..................................................................................................3
1.2 Analysis of micro factors.......................................................................................................4
1.3 Macro factors which affect the business towards failure.......................................................5
2. Evaluate financial information of business organizations...........................................................6
2.1 Profitability Ratios.................................................................................................................6
2.2 Liquidity Ratios.....................................................................................................................7
2.3 Leverage Ratios.....................................................................................................................8
2.4 Efficiency Ratios....................................................................................................................9
3. Investment Appraisal Techniques..............................................................................................10
3.1 Payback Period.....................................................................................................................10
3.2 Net Present Value................................................................................................................10
3.3 Internal Rate of Return.........................................................................................................11
3.4 Accounting Rate of Return..................................................................................................11
CONCLUSION..............................................................................................................................14
RECOMMENDATIONS...............................................................................................................14
REFERENCES .............................................................................................................................16
INTRODUCTION
Economics is the study of business environment by using various quantitative method
and other factors which influence the production, profitability and decisions making process
(Acquisti, Taylor and Wagman, 2016). Basically business economics define the relationship of
entity with capital, material or labour. For the better understanding of this concept Toys “R” Us
is selected. Company founded by Charles Lazarus in 1948 and its headquarter is situated in
Wayne, New Jersey, United States. In 2018, company announced to close their U.S & British
stores because of macro or micro impacts. This assessment covers various topics such as factors
which influence entire economy, evaluate financial information, investment appraisal techniques
etc.
MAIN BODY
1. Identify factors which impact economy
1.1 Supply & Demand of Goods
Principle of Supply & Demand:
Principle of Supply is the fundamental theory of economics which is used by the
organizations in order to identify the supply of goods & services in comparison to price of
products when other factors are constant and that is the reason for the upward slope of supply
curve:
If price of products & services increases then supply of goods also increases.
If price of commodity reduces then supply of products & services also reduces.
In this principle price & supply has positive relationship, in context of Toys “R” Us
when price of toys increases then production automatically increases due to high demand in the
market and vice versa.
Principle of Demand is the another economic theory where price & demand of goods
and services has inverse relationship (Camerer and et.al., 2016). It is also based on two principles
such as:
If price of commodities increases then demanded quantity reduces.
On the other hand, if price of products & services decline then damned of goods
increases.
⊘ This is a preview!⊘
Do you want full access?
Subscribe today to unlock all pages.
Trusted by 1+ million students worldwide
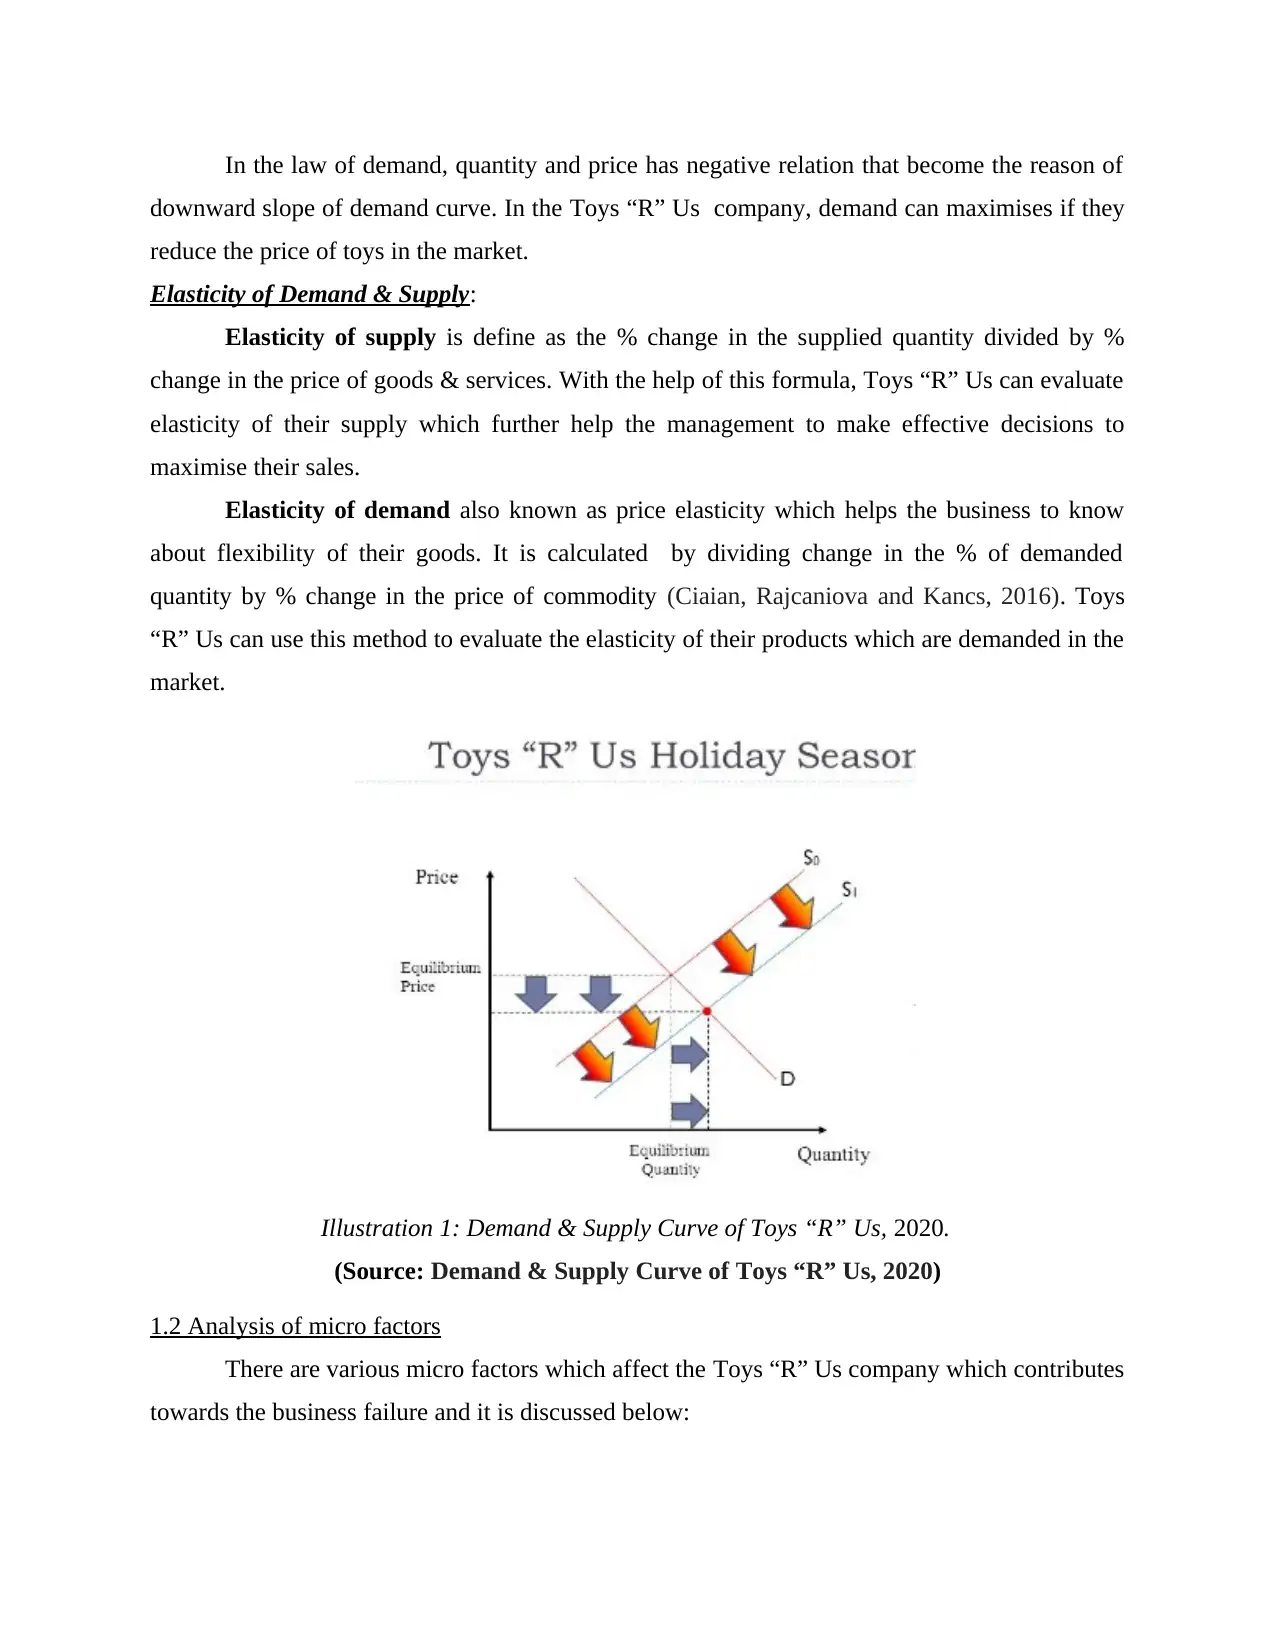
In the law of demand, quantity and price has negative relation that become the reason of
downward slope of demand curve. In the Toys “R” Us company, demand can maximises if they
reduce the price of toys in the market.
Elasticity of Demand & Supply:
Elasticity of supply is define as the % change in the supplied quantity divided by %
change in the price of goods & services. With the help of this formula, Toys “R” Us can evaluate
elasticity of their supply which further help the management to make effective decisions to
maximise their sales.
Elasticity of demand also known as price elasticity which helps the business to know
about flexibility of their goods. It is calculated by dividing change in the % of demanded
quantity by % change in the price of commodity (Ciaian, Rajcaniova and Kancs, 2016). Toys
“R” Us can use this method to evaluate the elasticity of their products which are demanded in the
market.
Illustration 1: Demand & Supply Curve of Toys “R” Us, 2020.
(Source: Demand & Supply Curve of Toys “R” Us, 2020)
1.2 Analysis of micro factors
There are various micro factors which affect the Toys “R” Us company which contributes
towards the business failure and it is discussed below:
Paraphrase This Document
Need a fresh take? Get an instant paraphrase of this document with our AI Paraphraser
Immigration Lowers Wages: Immigration will increase the supply of labours but
reduces its wage rate. Such as for non immigrated staff, labour rate is £ 10 per hour and the
another side for immigrated workers, wage rate is £ 8 per hour. It will affect the business
operations because due to low wages people are not willing to work.
Takes Jobs: Increase in the number of jobs attract people and because of the need of
employment they work on lower wage as well (Gilman, 2018). But in this case, local people are
willing to work on £ 8 per hour further it will increase the dissatisfaction or further affect the
retention of employees.
Above mention both factors contribute towards the failure of Toys “R” Us business
because retention ratio decreases because of low wages and there are only local people who are
willing to work on that wage.
1.3 Macro factors which affect the business towards failure
In the business environment, there are various external factors which affect the
organizations and its operational activities or contribute towards business failure. There are some
macro environment factors which affect the Toys “R” Us company which is discussed below:
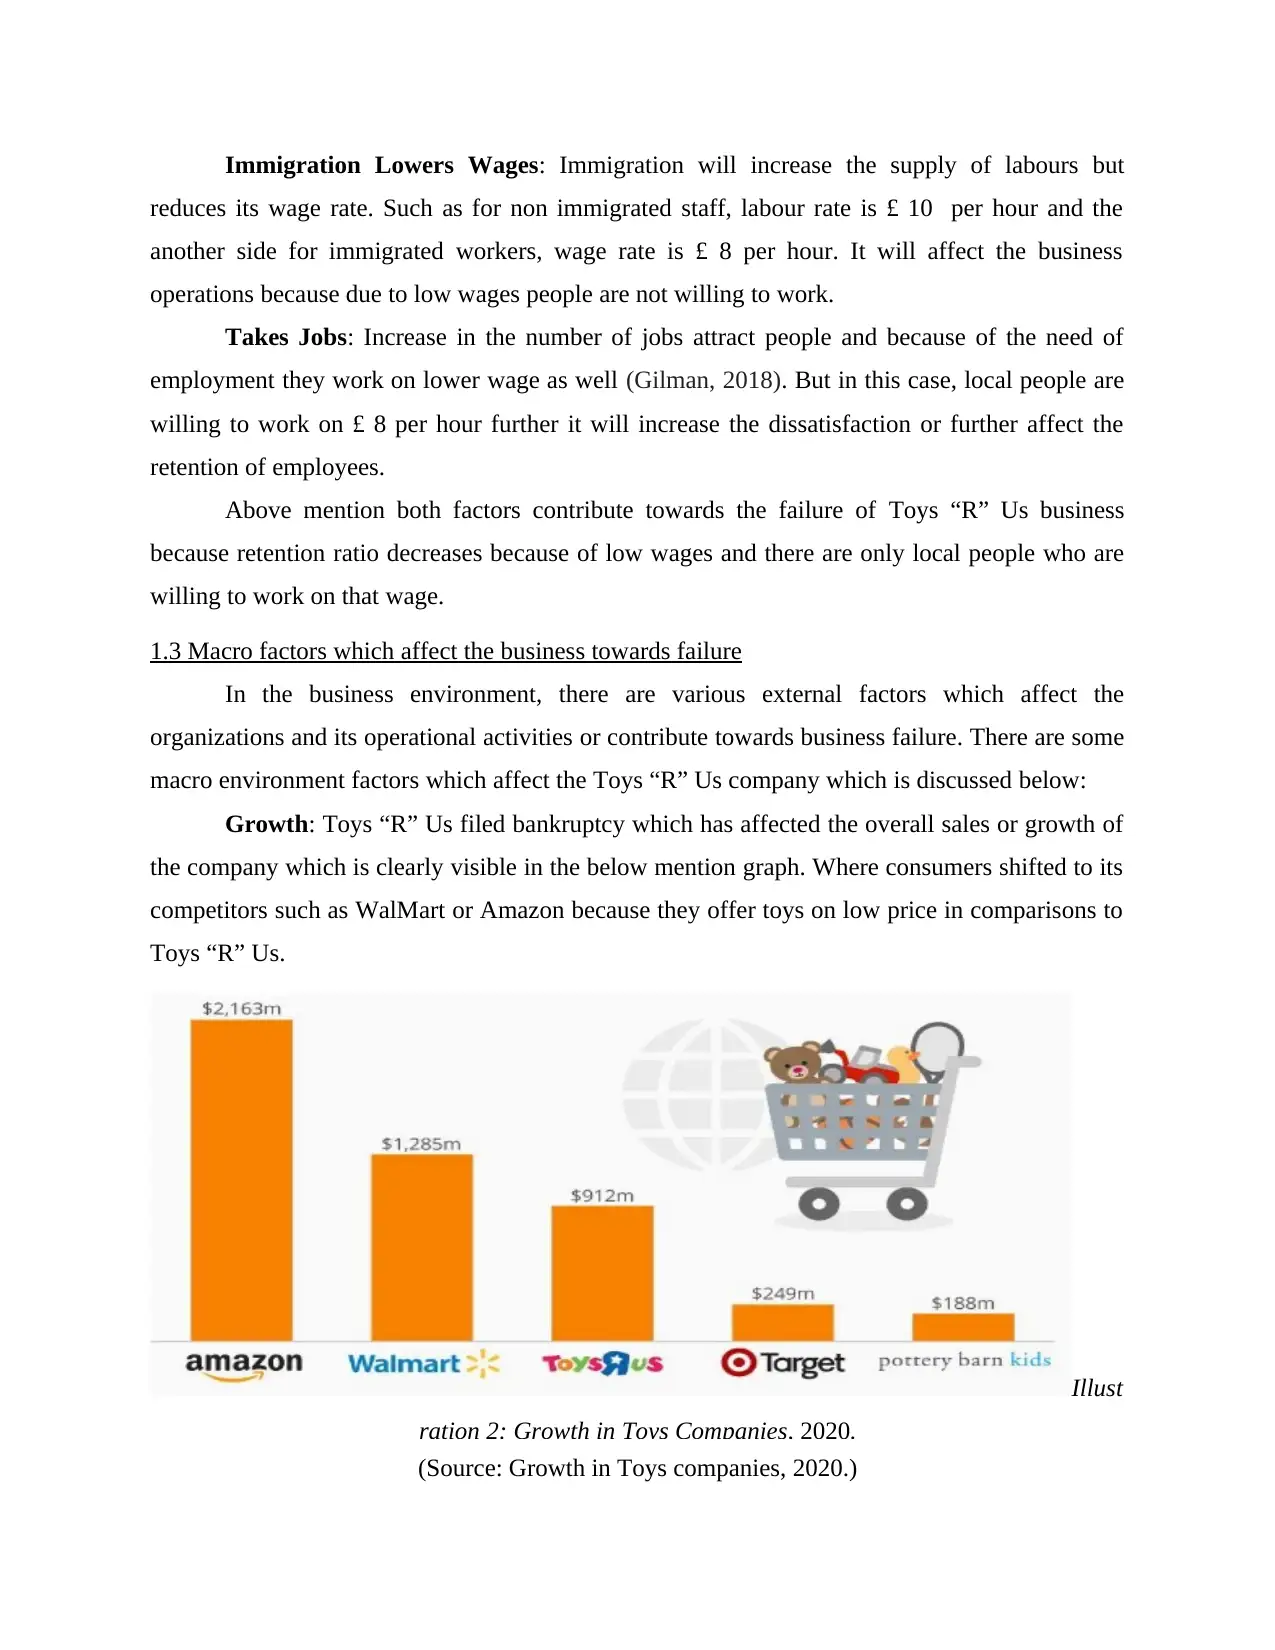
Growth: Toys “R” Us filed bankruptcy which has affected the overall sales or growth of
the company which is clearly visible in the below mention graph. Where consumers shifted to its
competitors such as WalMart or Amazon because they offer toys on low price in comparisons to
Toys “R” Us.
Illust
ration 2: Growth in Toys Companies, 2020.
(Source: Growth in Toys companies, 2020.)
reduces its wage rate. Such as for non immigrated staff, labour rate is £ 10 per hour and the
another side for immigrated workers, wage rate is £ 8 per hour. It will affect the business
operations because due to low wages people are not willing to work.
Takes Jobs: Increase in the number of jobs attract people and because of the need of
employment they work on lower wage as well (Gilman, 2018). But in this case, local people are
willing to work on £ 8 per hour further it will increase the dissatisfaction or further affect the
retention of employees.
Above mention both factors contribute towards the failure of Toys “R” Us business
because retention ratio decreases because of low wages and there are only local people who are
willing to work on that wage.
1.3 Macro factors which affect the business towards failure
In the business environment, there are various external factors which affect the
organizations and its operational activities or contribute towards business failure. There are some
macro environment factors which affect the Toys “R” Us company which is discussed below:
Growth: Toys “R” Us filed bankruptcy which has affected the overall sales or growth of
the company which is clearly visible in the below mention graph. Where consumers shifted to its
competitors such as WalMart or Amazon because they offer toys on low price in comparisons to
Toys “R” Us.
Illust
ration 2: Growth in Toys Companies, 2020.
(Source: Growth in Toys companies, 2020.)
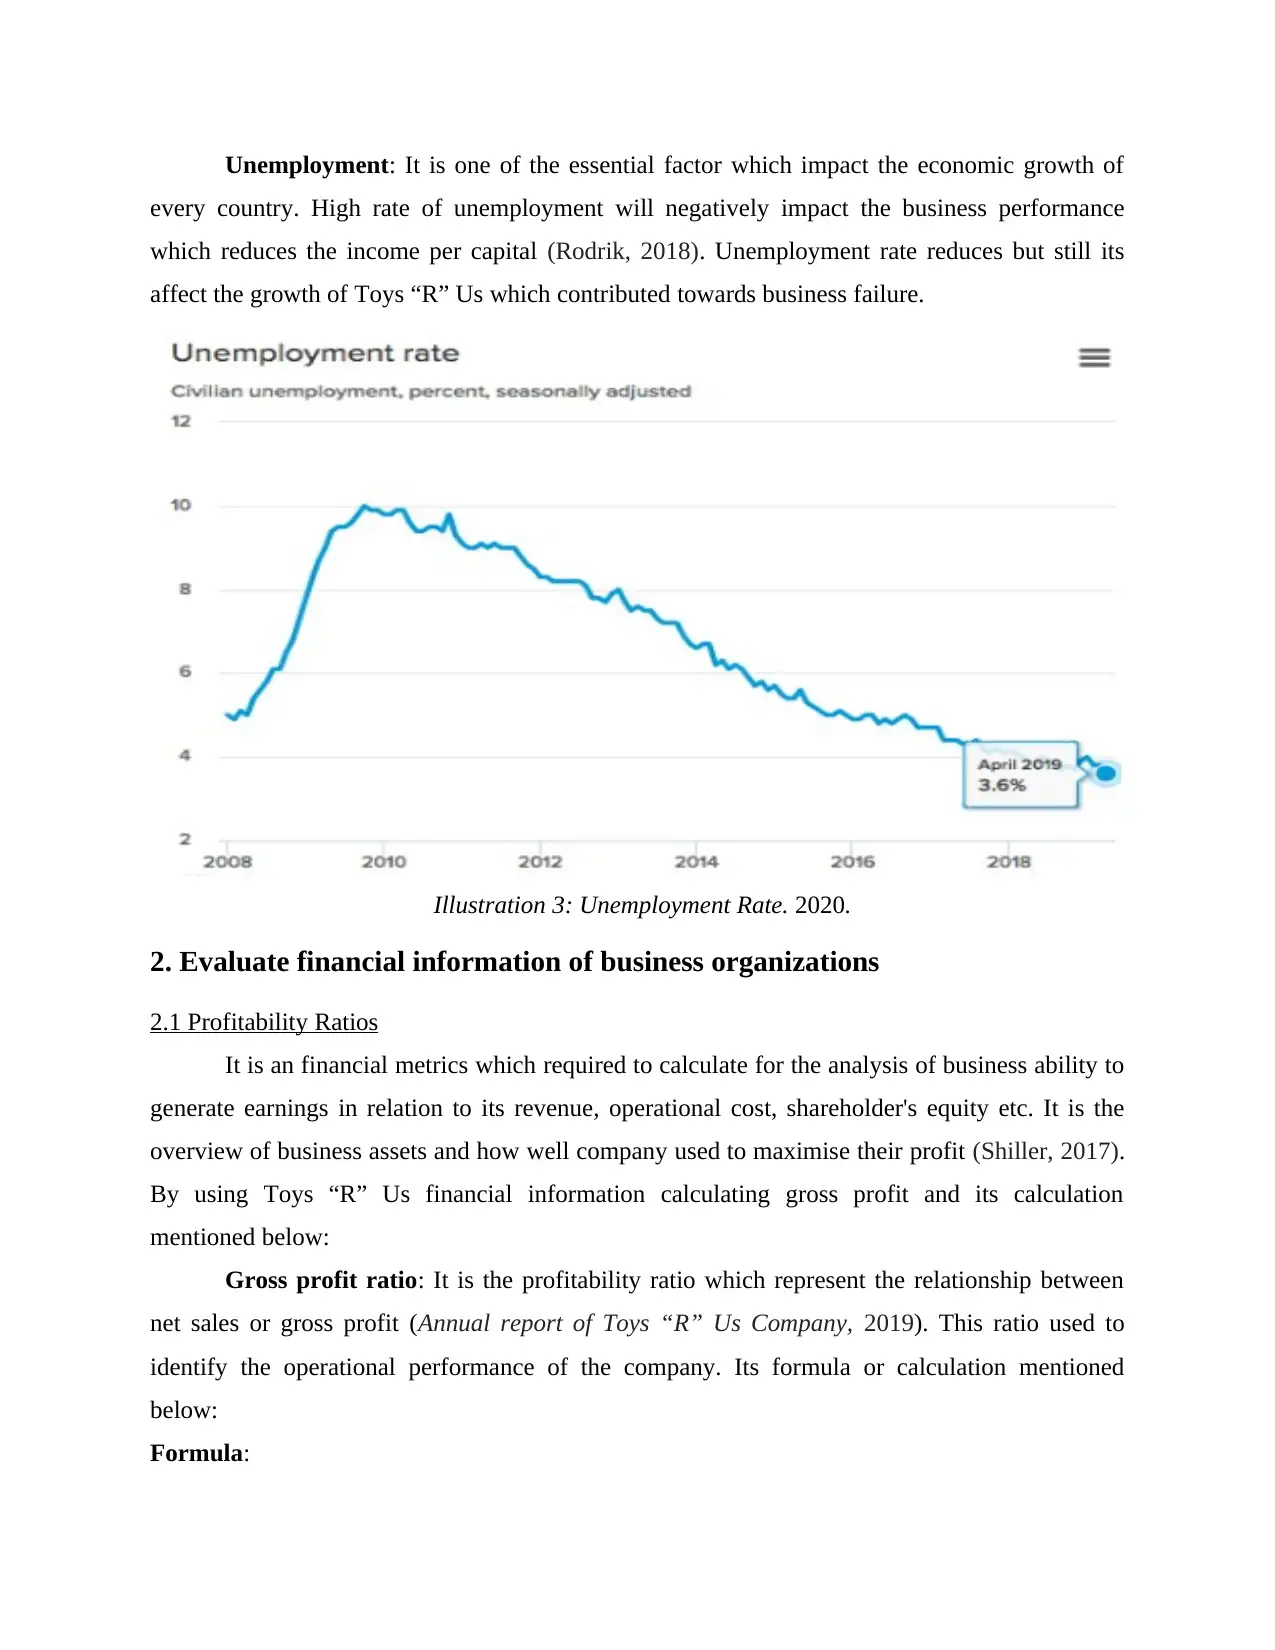
Unemployment: It is one of the essential factor which impact the economic growth of
every country. High rate of unemployment will negatively impact the business performance
which reduces the income per capital (Rodrik, 2018). Unemployment rate reduces but still its
affect the growth of Toys “R” Us which contributed towards business failure.
Illustration 3: Unemployment Rate. 2020.
2. Evaluate financial information of business organizations
2.1 Profitability Ratios
It is an financial metrics which required to calculate for the analysis of business ability to
generate earnings in relation to its revenue, operational cost, shareholder's equity etc. It is the
overview of business assets and how well company used to maximise their profit (Shiller, 2017).
By using Toys “R” Us financial information calculating gross profit and its calculation
mentioned below:
Gross profit ratio: It is the profitability ratio which represent the relationship between
net sales or gross profit (Annual report of Toys “R” Us Company, 2019). This ratio used to
identify the operational performance of the company. Its formula or calculation mentioned
below:
Formula:
⊘ This is a preview!⊘
Do you want full access?
Subscribe today to unlock all pages.
Trusted by 1+ million students worldwide
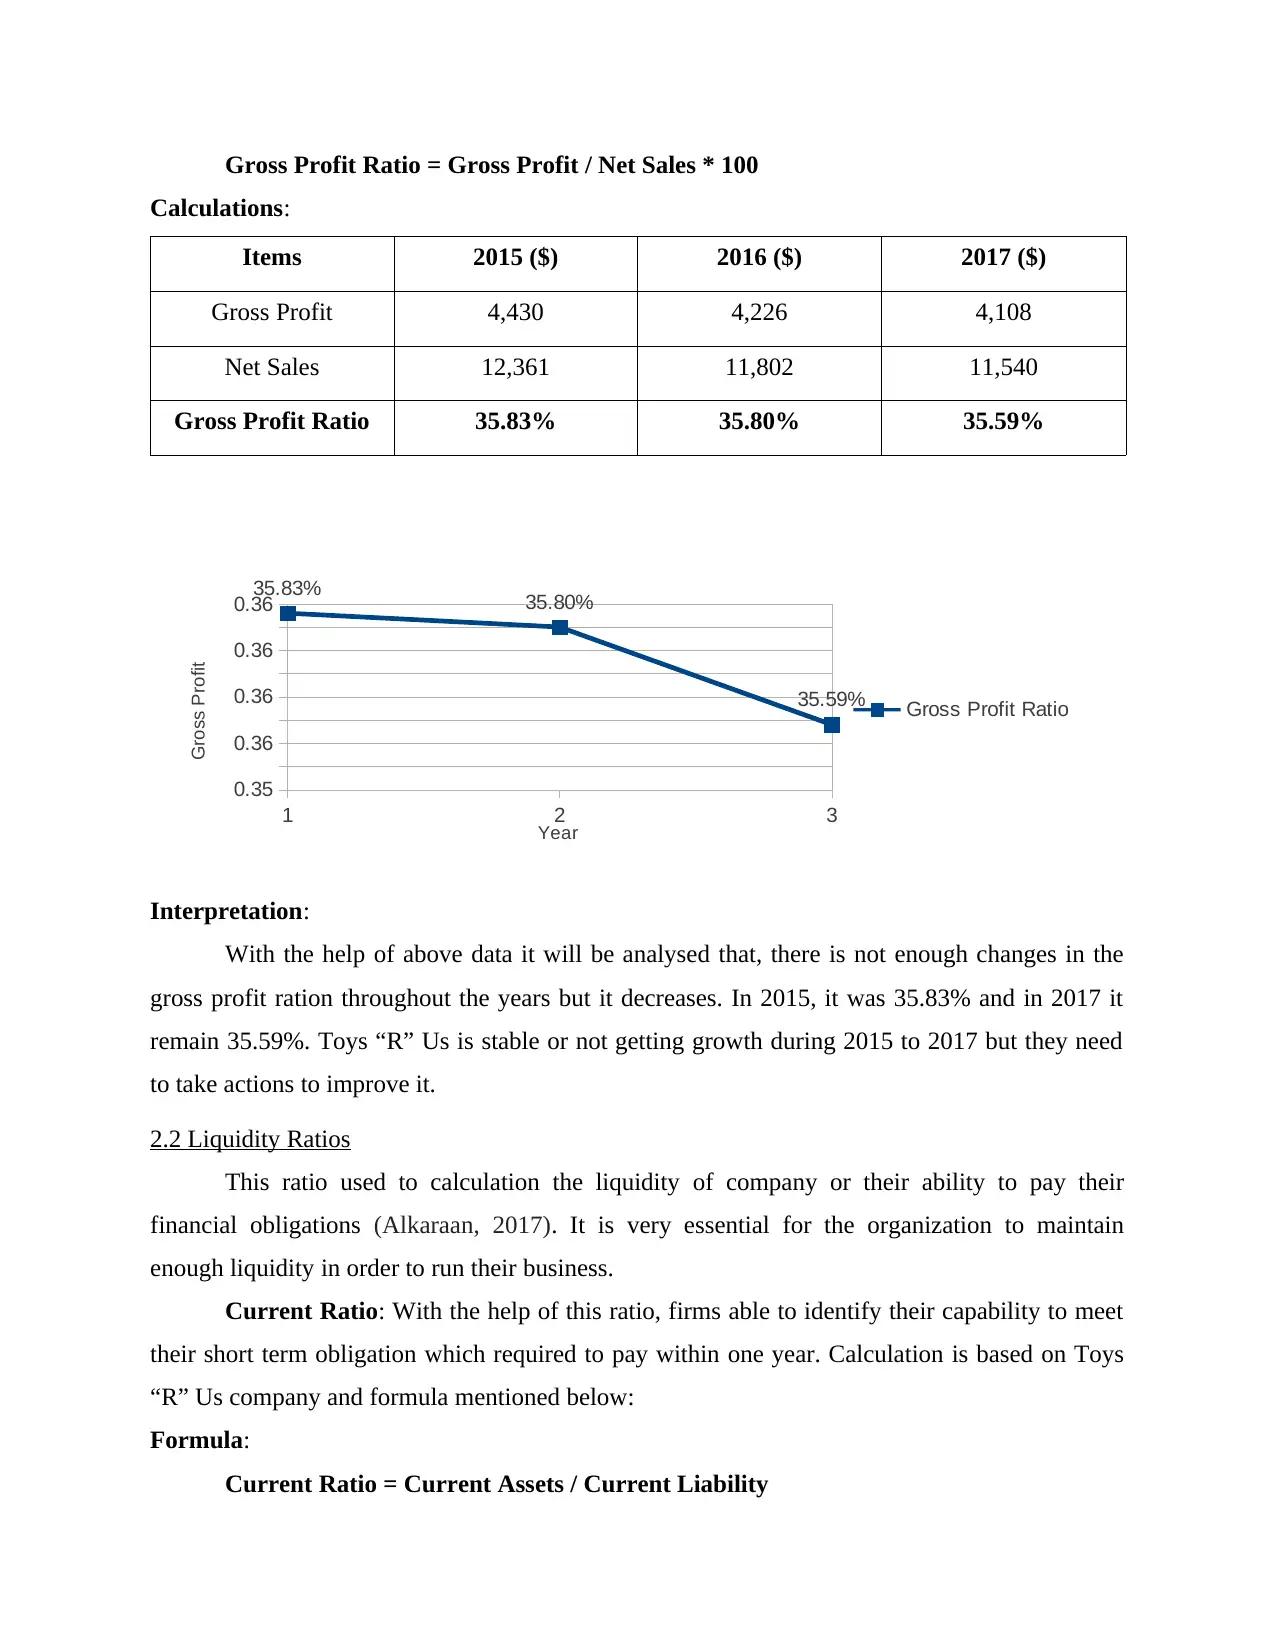
Gross Profit Ratio = Gross Profit / Net Sales * 100
Calculations:
Items 2015 ($) 2016 ($) 2017 ($)
Gross Profit 4,430 4,226 4,108
Net Sales 12,361 11,802 11,540
Gross Profit Ratio 35.83% 35.80% 35.59%
1 2 3
0.35
0.36
0.36
0.36
0.36
35.83% 35.80%
35.59% Gross Profit Ratio
Year
Gross Profit
Interpretation:
With the help of above data it will be analysed that, there is not enough changes in the
gross profit ration throughout the years but it decreases. In 2015, it was 35.83% and in 2017 it
remain 35.59%. Toys “R” Us is stable or not getting growth during 2015 to 2017 but they need
to take actions to improve it.
2.2 Liquidity Ratios
This ratio used to calculation the liquidity of company or their ability to pay their
financial obligations (Alkaraan, 2017). It is very essential for the organization to maintain
enough liquidity in order to run their business.
Current Ratio: With the help of this ratio, firms able to identify their capability to meet
their short term obligation which required to pay within one year. Calculation is based on Toys
“R” Us company and formula mentioned below:
Formula:
Current Ratio = Current Assets / Current Liability
Paraphrase This Document
Need a fresh take? Get an instant paraphrase of this document with our AI Paraphraser
Calculations:
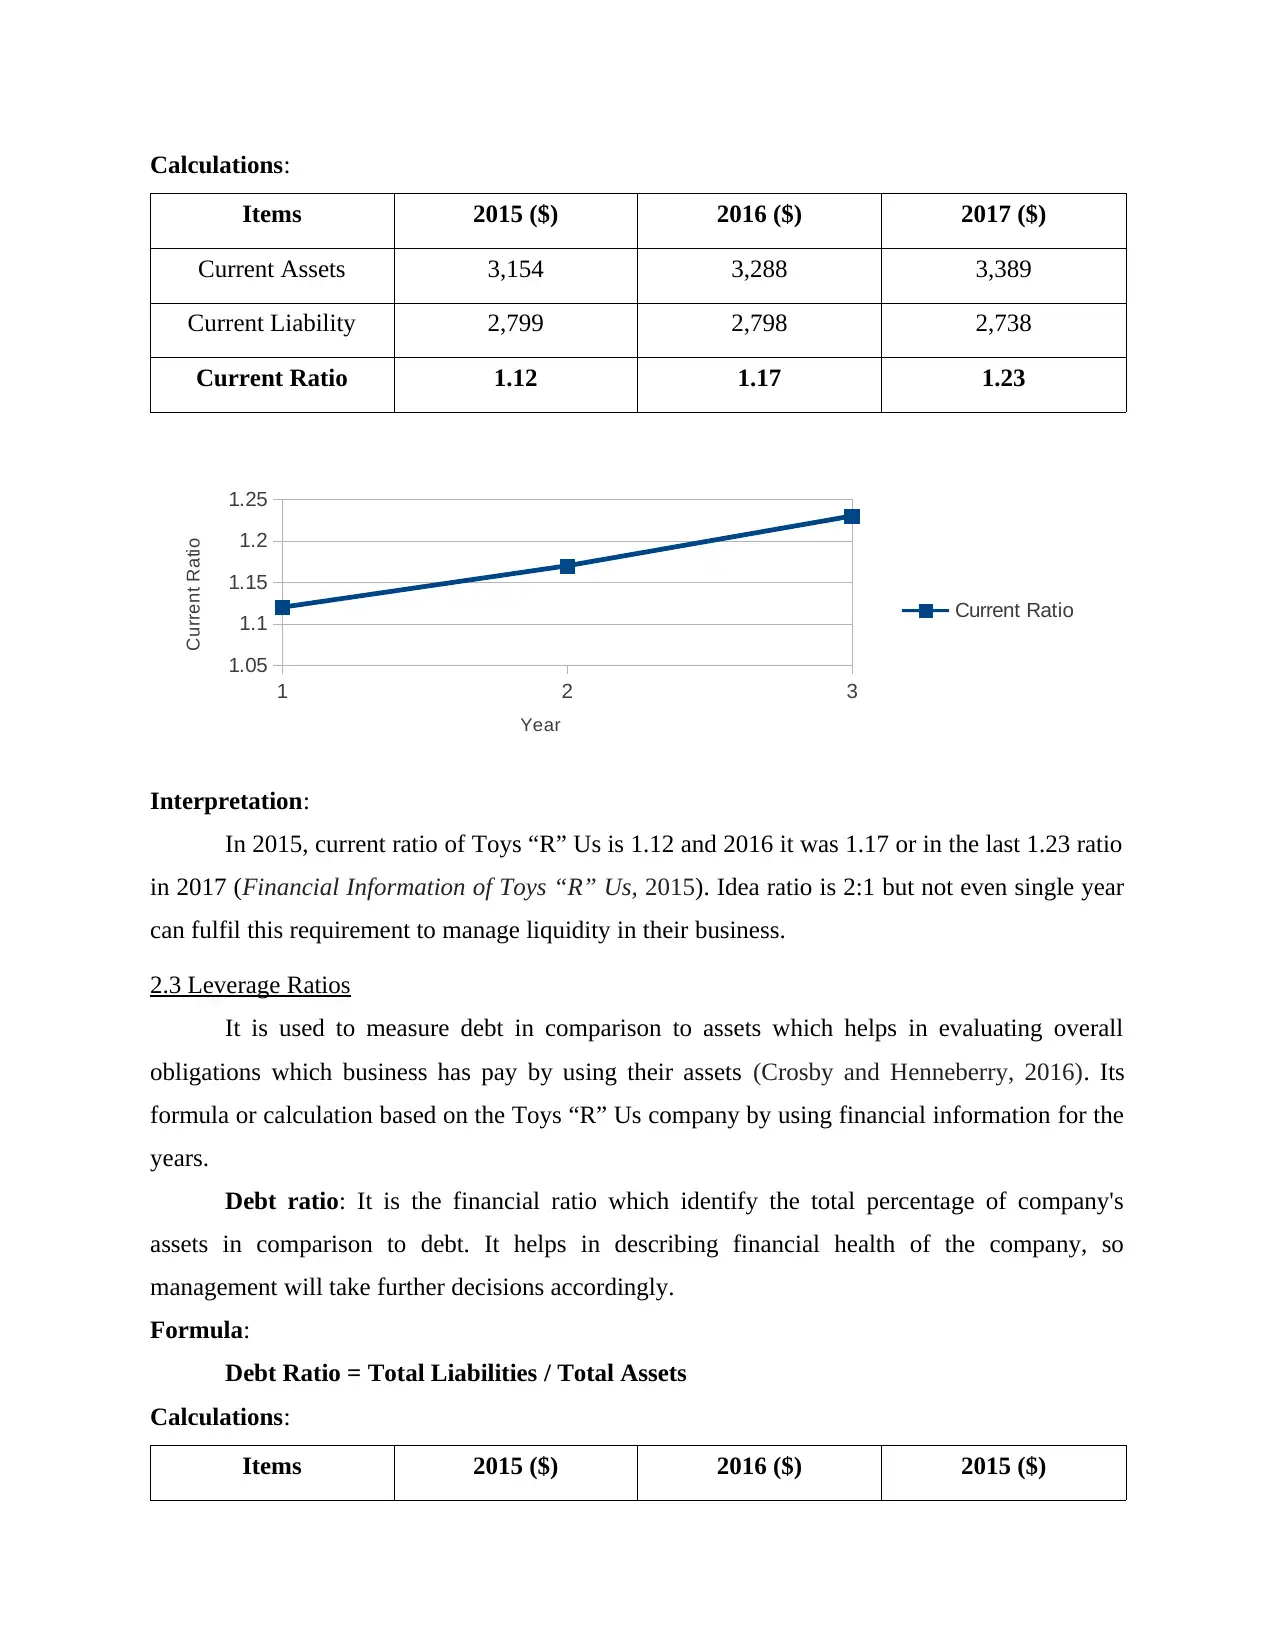
Items 2015 ($) 2016 ($) 2017 ($)
Current Assets 3,154 3,288 3,389
Current Liability 2,799 2,798 2,738
Current Ratio 1.12 1.17 1.23
1 2 3
1.05
1.1
1.15
1.2
1.25
Current Ratio
Year
Current Ratio
Interpretation:
In 2015, current ratio of Toys “R” Us is 1.12 and 2016 it was 1.17 or in the last 1.23 ratio
in 2017 (Financial Information of Toys “R” Us, 2015). Idea ratio is 2:1 but not even single year
can fulfil this requirement to manage liquidity in their business.
2.3 Leverage Ratios
It is used to measure debt in comparison to assets which helps in evaluating overall
obligations which business has pay by using their assets (Crosby and Henneberry, 2016). Its
formula or calculation based on the Toys “R” Us company by using financial information for the
years.
Debt ratio: It is the financial ratio which identify the total percentage of company's
assets in comparison to debt. It helps in describing financial health of the company, so
management will take further decisions accordingly.
Formula:
Debt Ratio = Total Liabilities / Total Assets
Calculations:
Items 2015 ($) 2016 ($) 2015 ($)
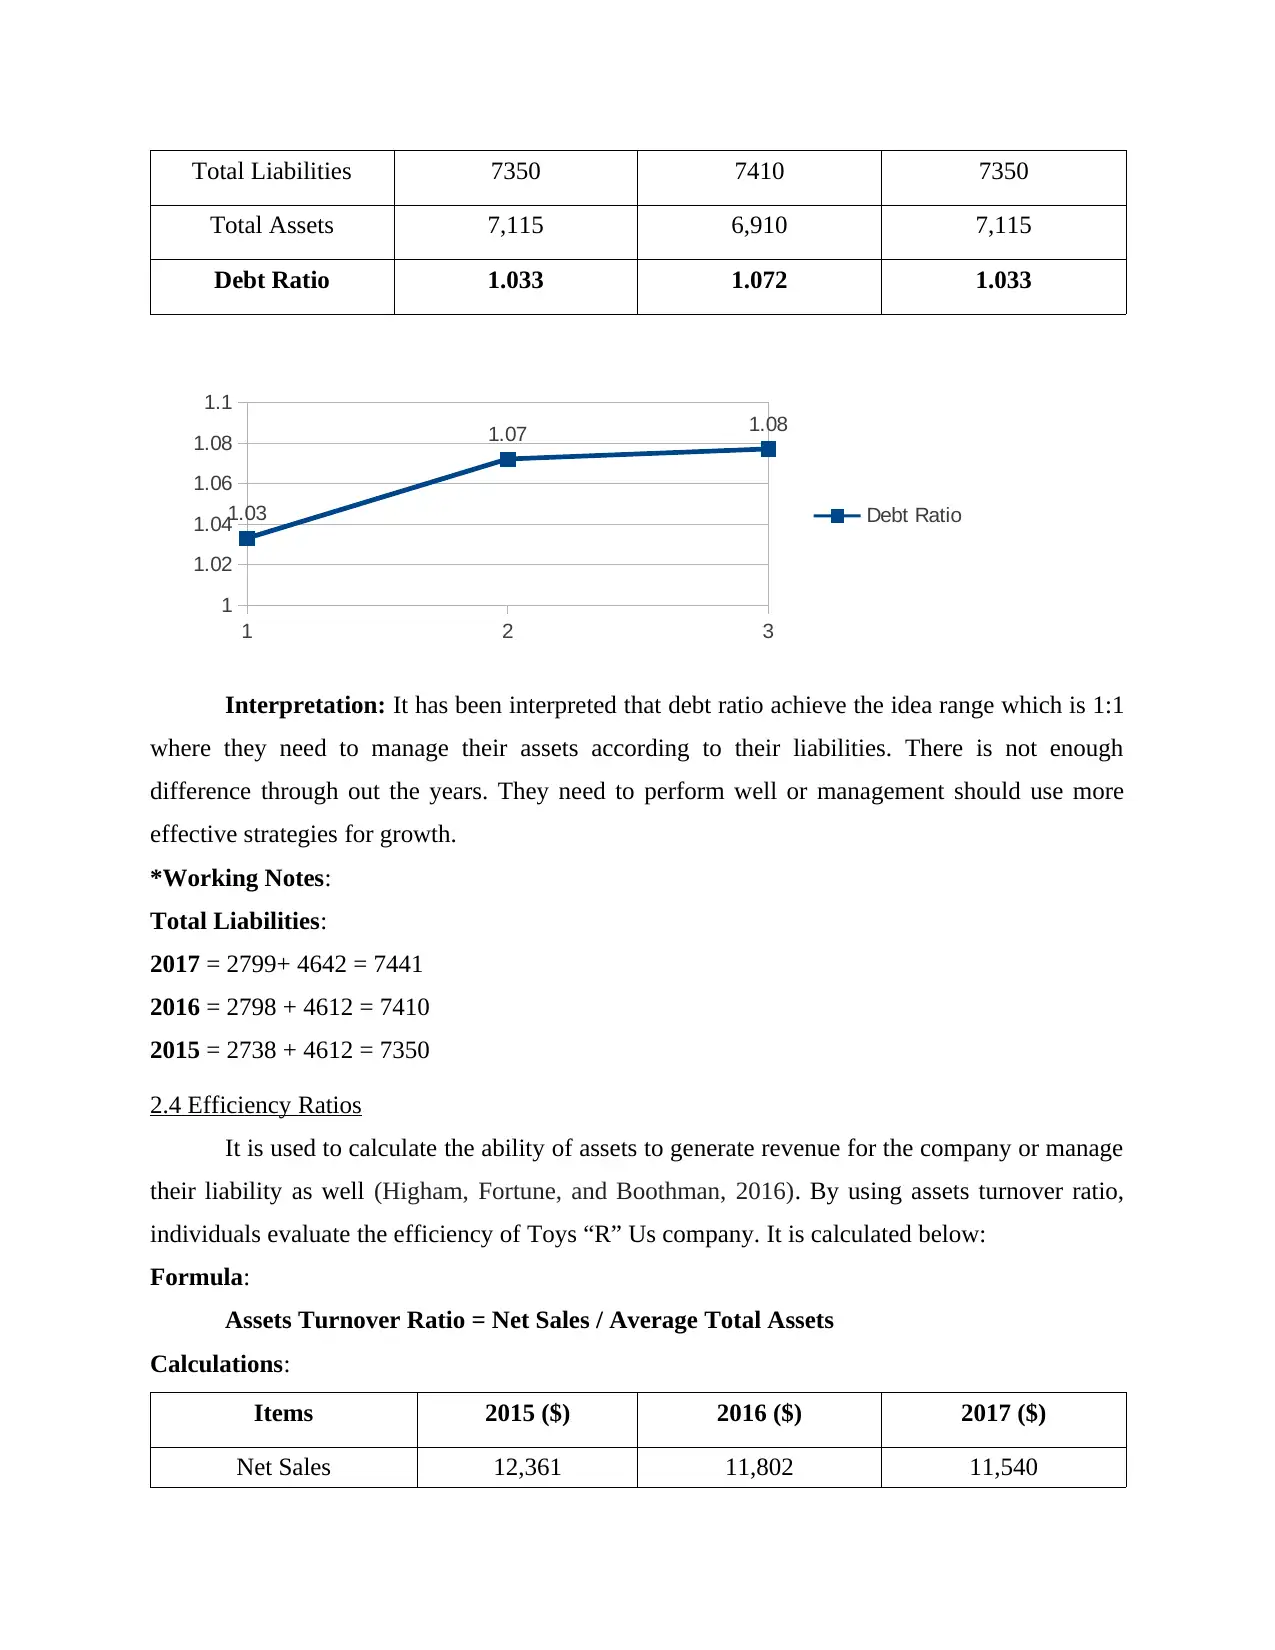
Total Liabilities 7350 7410 7350
Total Assets 7,115 6,910 7,115
Debt Ratio 1.033 1.072 1.033
1 2 3
1
1.02
1.04
1.06
1.08
1.1
1.03
1.07 1.08
Debt Ratio
Interpretation: It has been interpreted that debt ratio achieve the idea range which is 1:1
where they need to manage their assets according to their liabilities. There is not enough
difference through out the years. They need to perform well or management should use more
effective strategies for growth.
*Working Notes:
Total Liabilities:
2017 = 2799+ 4642 = 7441
2016 = 2798 + 4612 = 7410
2015 = 2738 + 4612 = 7350
2.4 Efficiency Ratios
It is used to calculate the ability of assets to generate revenue for the company or manage
their liability as well (Higham, Fortune, and Boothman, 2016). By using assets turnover ratio,
individuals evaluate the efficiency of Toys “R” Us company. It is calculated below:
Formula:
Assets Turnover Ratio = Net Sales / Average Total Assets
Calculations:
Items 2015 ($) 2016 ($) 2017 ($)
Net Sales 12,361 11,802 11,540
⊘ This is a preview!⊘
Do you want full access?
Subscribe today to unlock all pages.
Trusted by 1+ million students worldwide
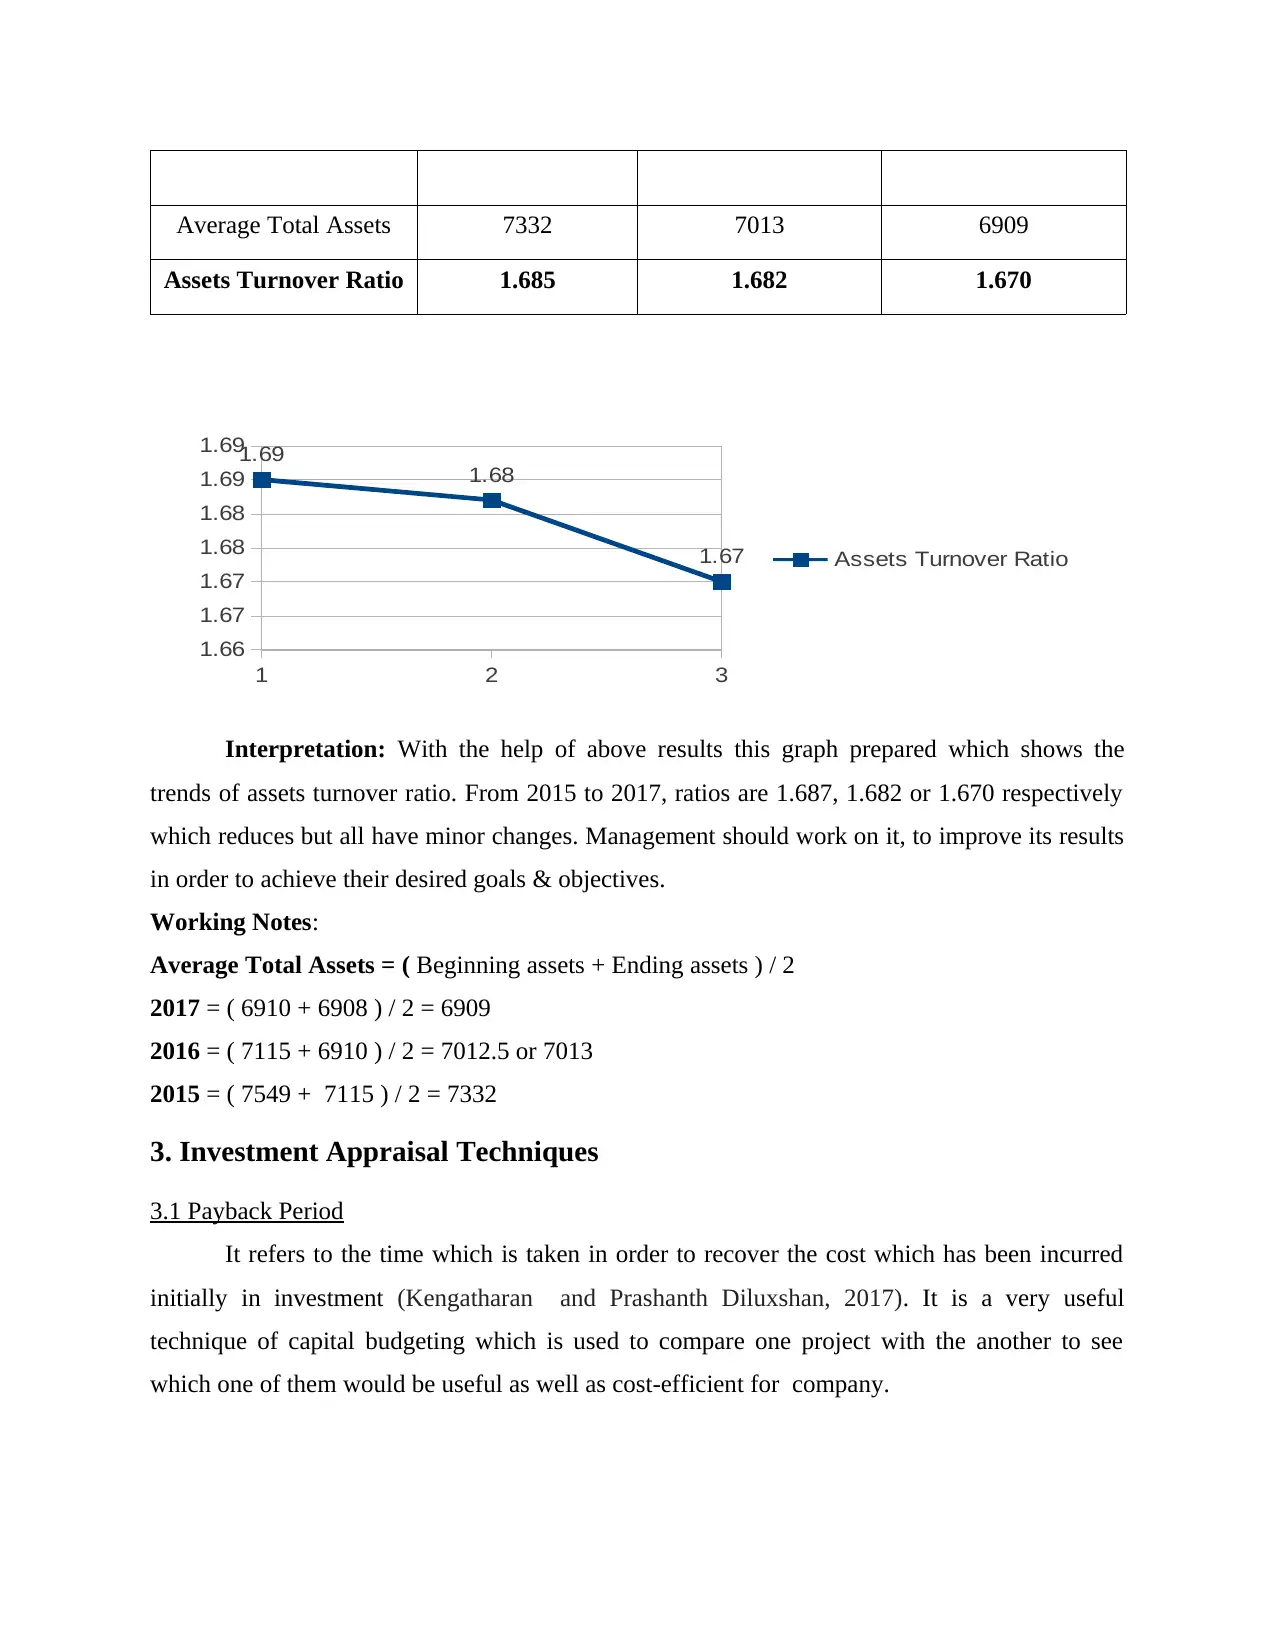
Average Total Assets 7332 7013 6909
Assets Turnover Ratio 1.685 1.682 1.670
1 2 3
1.66
1.67
1.67
1.68
1.68
1.69
1.691.69 1.68
1.67 Assets Turnover Ratio
Interpretation: With the help of above results this graph prepared which shows the
trends of assets turnover ratio. From 2015 to 2017, ratios are 1.687, 1.682 or 1.670 respectively
which reduces but all have minor changes. Management should work on it, to improve its results
in order to achieve their desired goals & objectives.
Working Notes:
Average Total Assets = ( Beginning assets + Ending assets ) / 2
2017 = ( 6910 + 6908 ) / 2 = 6909
2016 = ( 7115 + 6910 ) / 2 = 7012.5 or 7013
2015 = ( 7549 + 7115 ) / 2 = 7332
3. Investment Appraisal Techniques
3.1 Payback Period
It refers to the time which is taken in order to recover the cost which has been incurred
initially in investment (Kengatharan and Prashanth Diluxshan, 2017). It is a very useful
technique of capital budgeting which is used to compare one project with the another to see
which one of them would be useful as well as cost-efficient for company.
Paraphrase This Document
Need a fresh take? Get an instant paraphrase of this document with our AI Paraphraser
3.2 Net Present Value
It is the value of all positive and negative cash flows over the entire life of an investment.
Analysis of NPV is important for an enterprise because it essentially determines how much value
a project has in front of the organisation in comparison to other projects.
3.3 Internal Rate of Return
It is a guideline which is used to see whether the project would be profitable or not for the
firm in future. The rule says that the IRR should be greater than the minimum required rate of
return. However, if the IRR is lower than the cost of capital then the project must be foregone.
3.4 Accounting Rate of Return
It is the rate of return on a project or an investment compared to its initial cost which was
incurred. It is mainly used to decide on investing and acquiring purposes. It is an important tool
of Capital Budgeting (Milenković and et.al., 2016). It can be used for comparison of multiple
projects to see which one of them is most profitable.
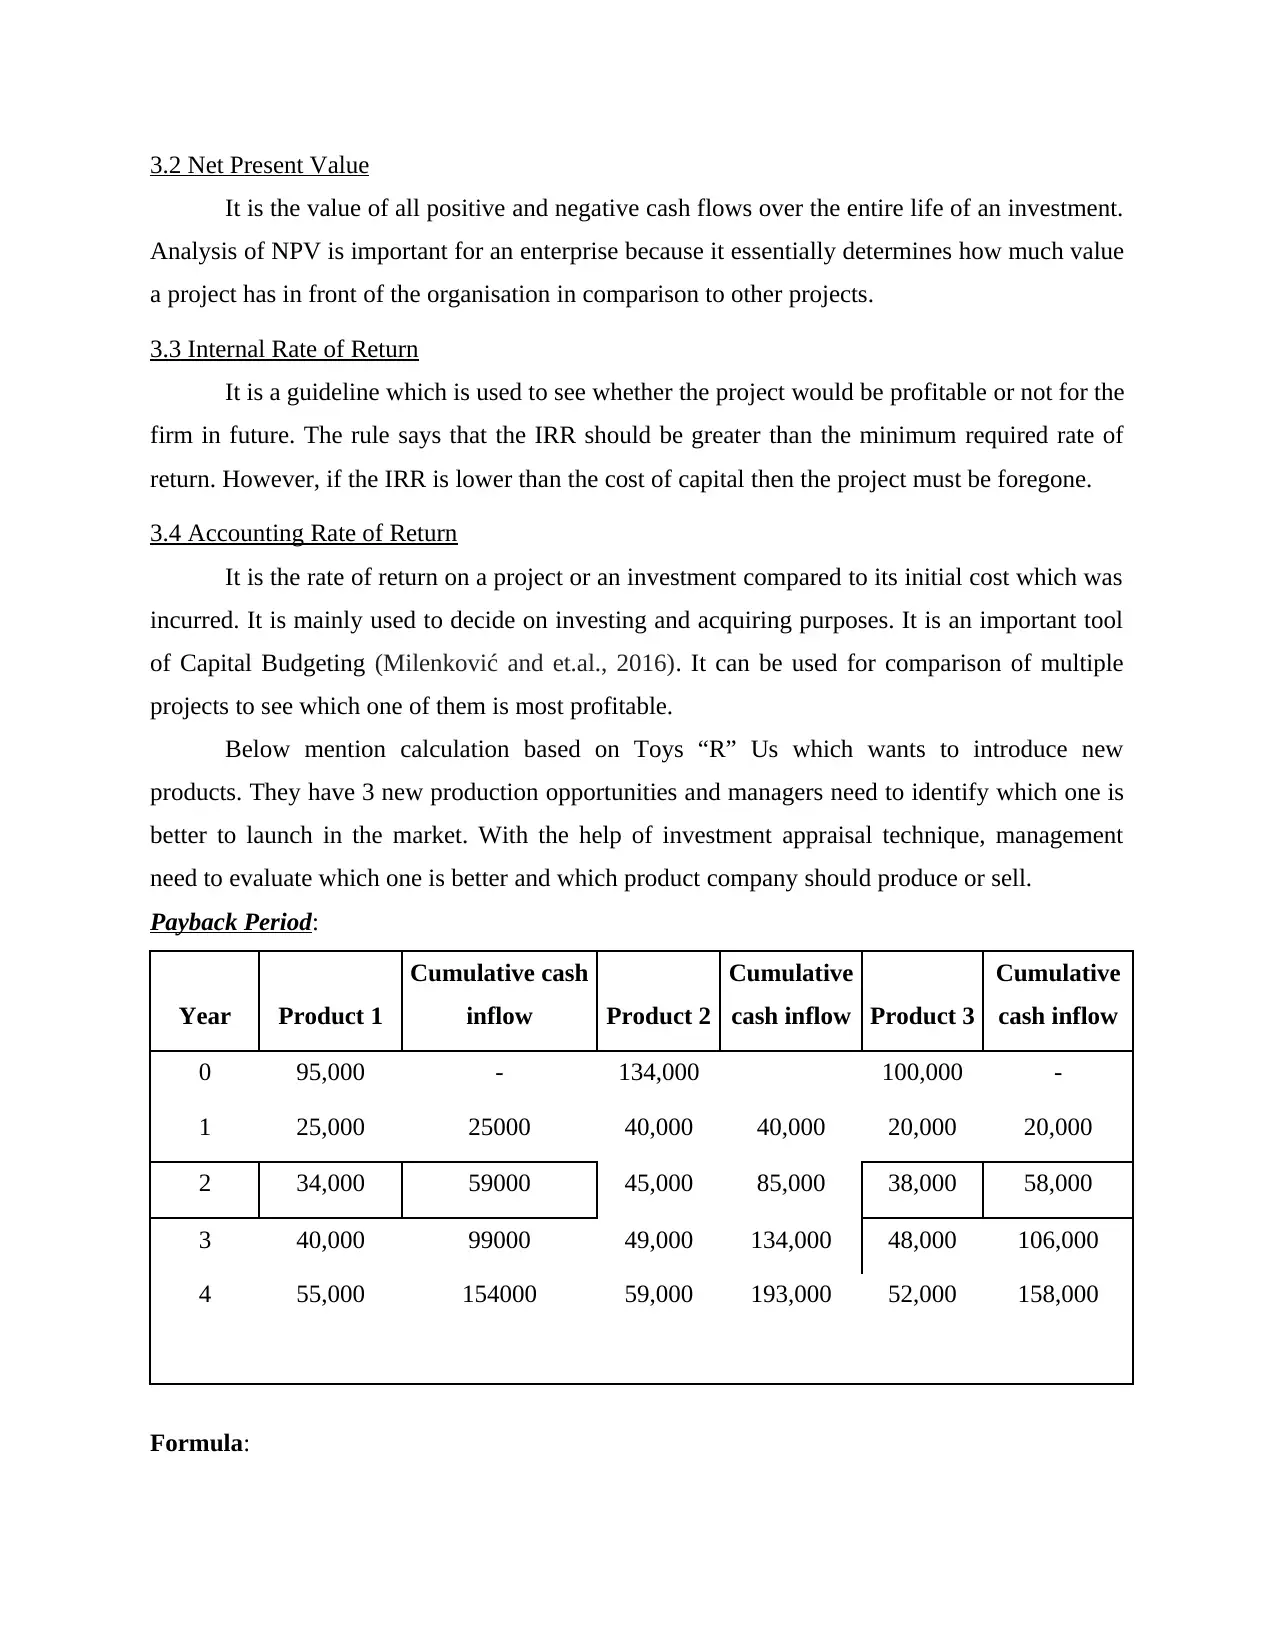
Below mention calculation based on Toys “R” Us which wants to introduce new
products. They have 3 new production opportunities and managers need to identify which one is
better to launch in the market. With the help of investment appraisal technique, management
need to evaluate which one is better and which product company should produce or sell.
Payback Period:
Year Product 1
Cumulative cash
inflow Product 2
Cumulative
cash inflow Product 3
Cumulative
cash inflow
0 95,000 - 134,000 100,000 -
1 25,000 25000 40,000 40,000 20,000 20,000
2 34,000 59000 45,000 85,000 38,000 58,000
3 40,000 99000 49,000 134,000 48,000 106,000
4 55,000 154000 59,000 193,000 52,000 158,000
Formula:
It is the value of all positive and negative cash flows over the entire life of an investment.
Analysis of NPV is important for an enterprise because it essentially determines how much value
a project has in front of the organisation in comparison to other projects.
3.3 Internal Rate of Return
It is a guideline which is used to see whether the project would be profitable or not for the
firm in future. The rule says that the IRR should be greater than the minimum required rate of
return. However, if the IRR is lower than the cost of capital then the project must be foregone.
3.4 Accounting Rate of Return
It is the rate of return on a project or an investment compared to its initial cost which was
incurred. It is mainly used to decide on investing and acquiring purposes. It is an important tool
of Capital Budgeting (Milenković and et.al., 2016). It can be used for comparison of multiple
projects to see which one of them is most profitable.
Below mention calculation based on Toys “R” Us which wants to introduce new
products. They have 3 new production opportunities and managers need to identify which one is
better to launch in the market. With the help of investment appraisal technique, management
need to evaluate which one is better and which product company should produce or sell.
Payback Period:
Year Product 1
Cumulative cash
inflow Product 2
Cumulative
cash inflow Product 3
Cumulative
cash inflow
0 95,000 - 134,000 100,000 -
1 25,000 25000 40,000 40,000 20,000 20,000
2 34,000 59000 45,000 85,000 38,000 58,000
3 40,000 99000 49,000 134,000 48,000 106,000
4 55,000 154000 59,000 193,000 52,000 158,000
Formula:
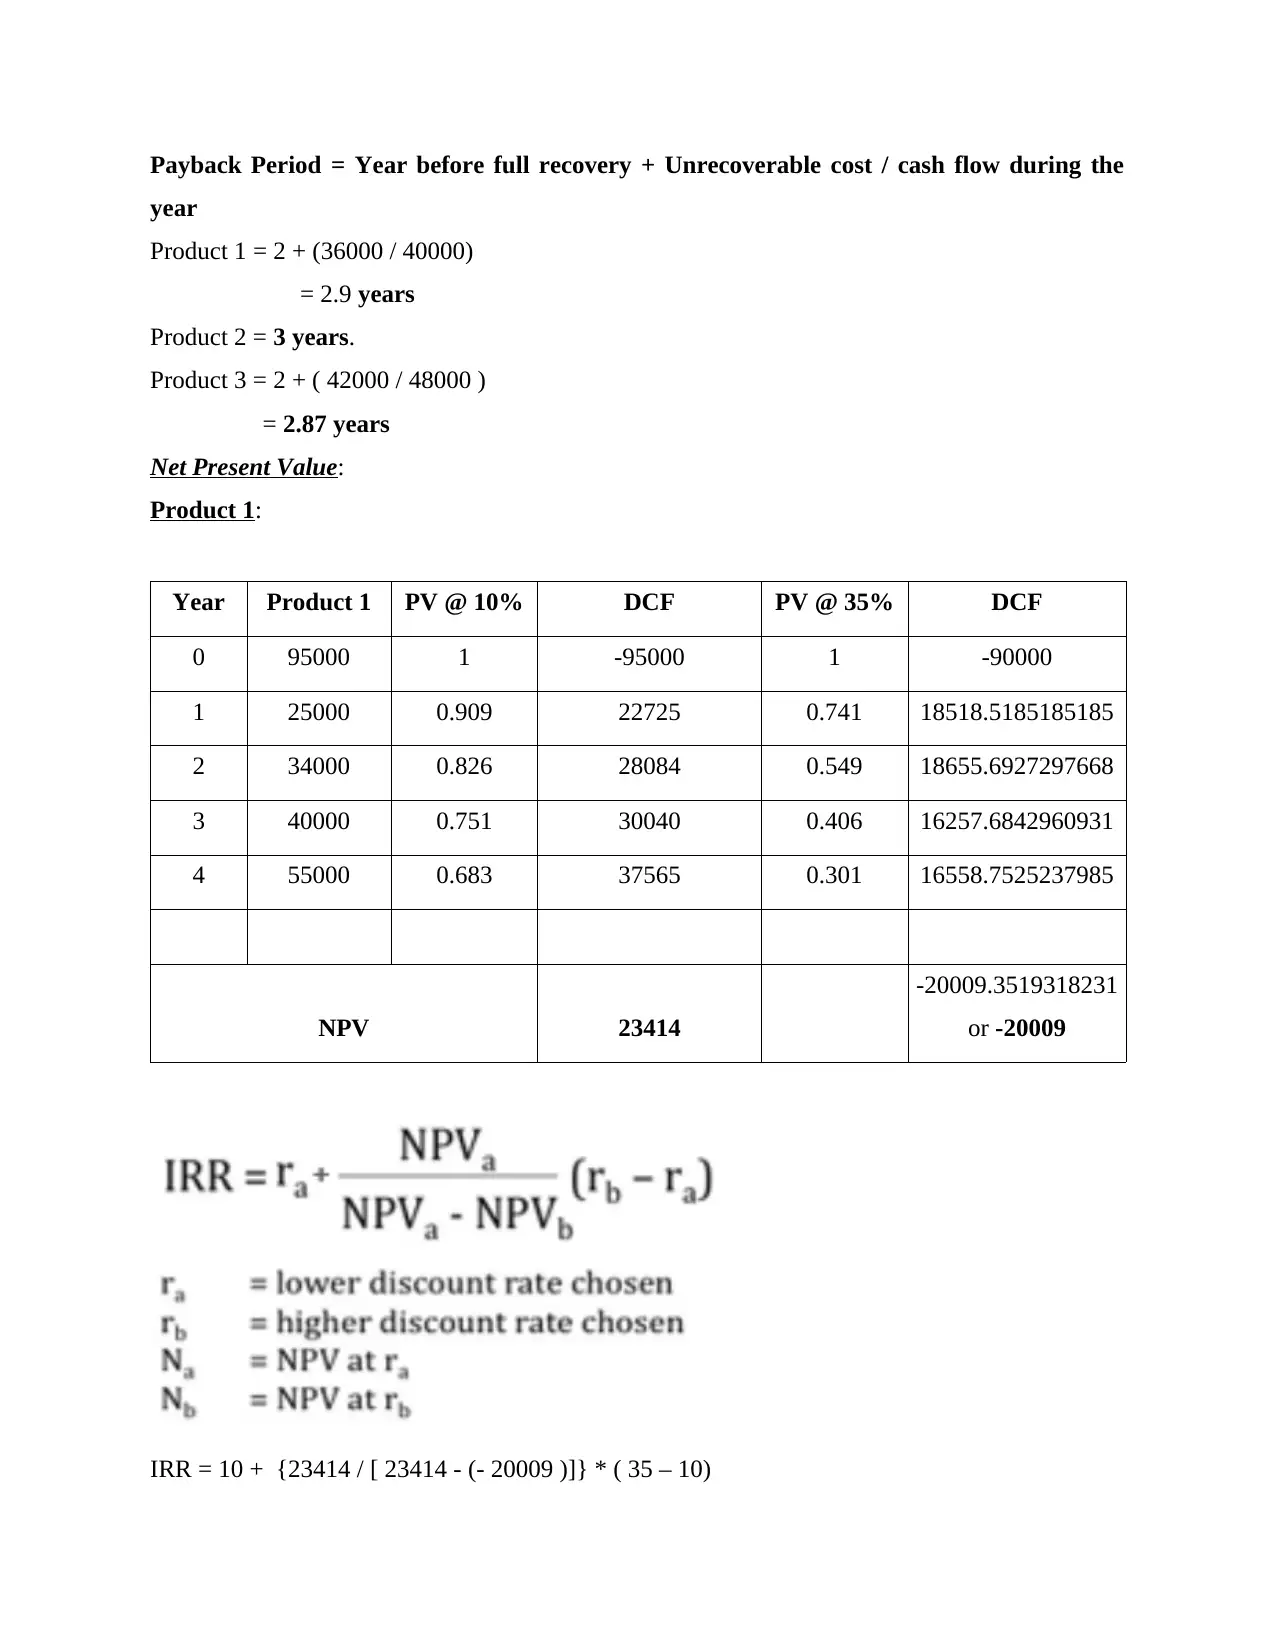
Payback Period = Year before full recovery + Unrecoverable cost / cash flow during the
year
Product 1 = 2 + (36000 / 40000)
= 2.9 years
Product 2 = 3 years.
Product 3 = 2 + ( 42000 / 48000 )
= 2.87 years
Net Present Value:
Product 1:
Year Product 1 PV @ 10% DCF PV @ 35% DCF
0 95000 1 -95000 1 -90000
1 25000 0.909 22725 0.741 18518.5185185185
2 34000 0.826 28084 0.549 18655.6927297668
3 40000 0.751 30040 0.406 16257.6842960931
4 55000 0.683 37565 0.301 16558.7525237985
NPV 23414
-20009.3519318231
or -20009
IRR = 10 + {23414 / [ 23414 - (- 20009 )]} * ( 35 – 10)
⊘ This is a preview!⊘
Do you want full access?
Subscribe today to unlock all pages.
Trusted by 1+ million students worldwide
1 out of 16
Related Documents


Your All-in-One AI-Powered Toolkit for Academic Success.
+13062052269
info@desklib.com
Available 24*7 on WhatsApp / Email
![[object Object]](/_next/static/media/star-bottom.7253800d.svg)
Unlock your academic potential
Copyright © 2020–2026 A2Z Services. All Rights Reserved. Developed and managed by ZUCOL.