An Evaluation of Australia's Economic Growth Between 2012 and 2017
VerifiedAdded on 2020/03/28
|20
|3835
|46
Report
AI Summary
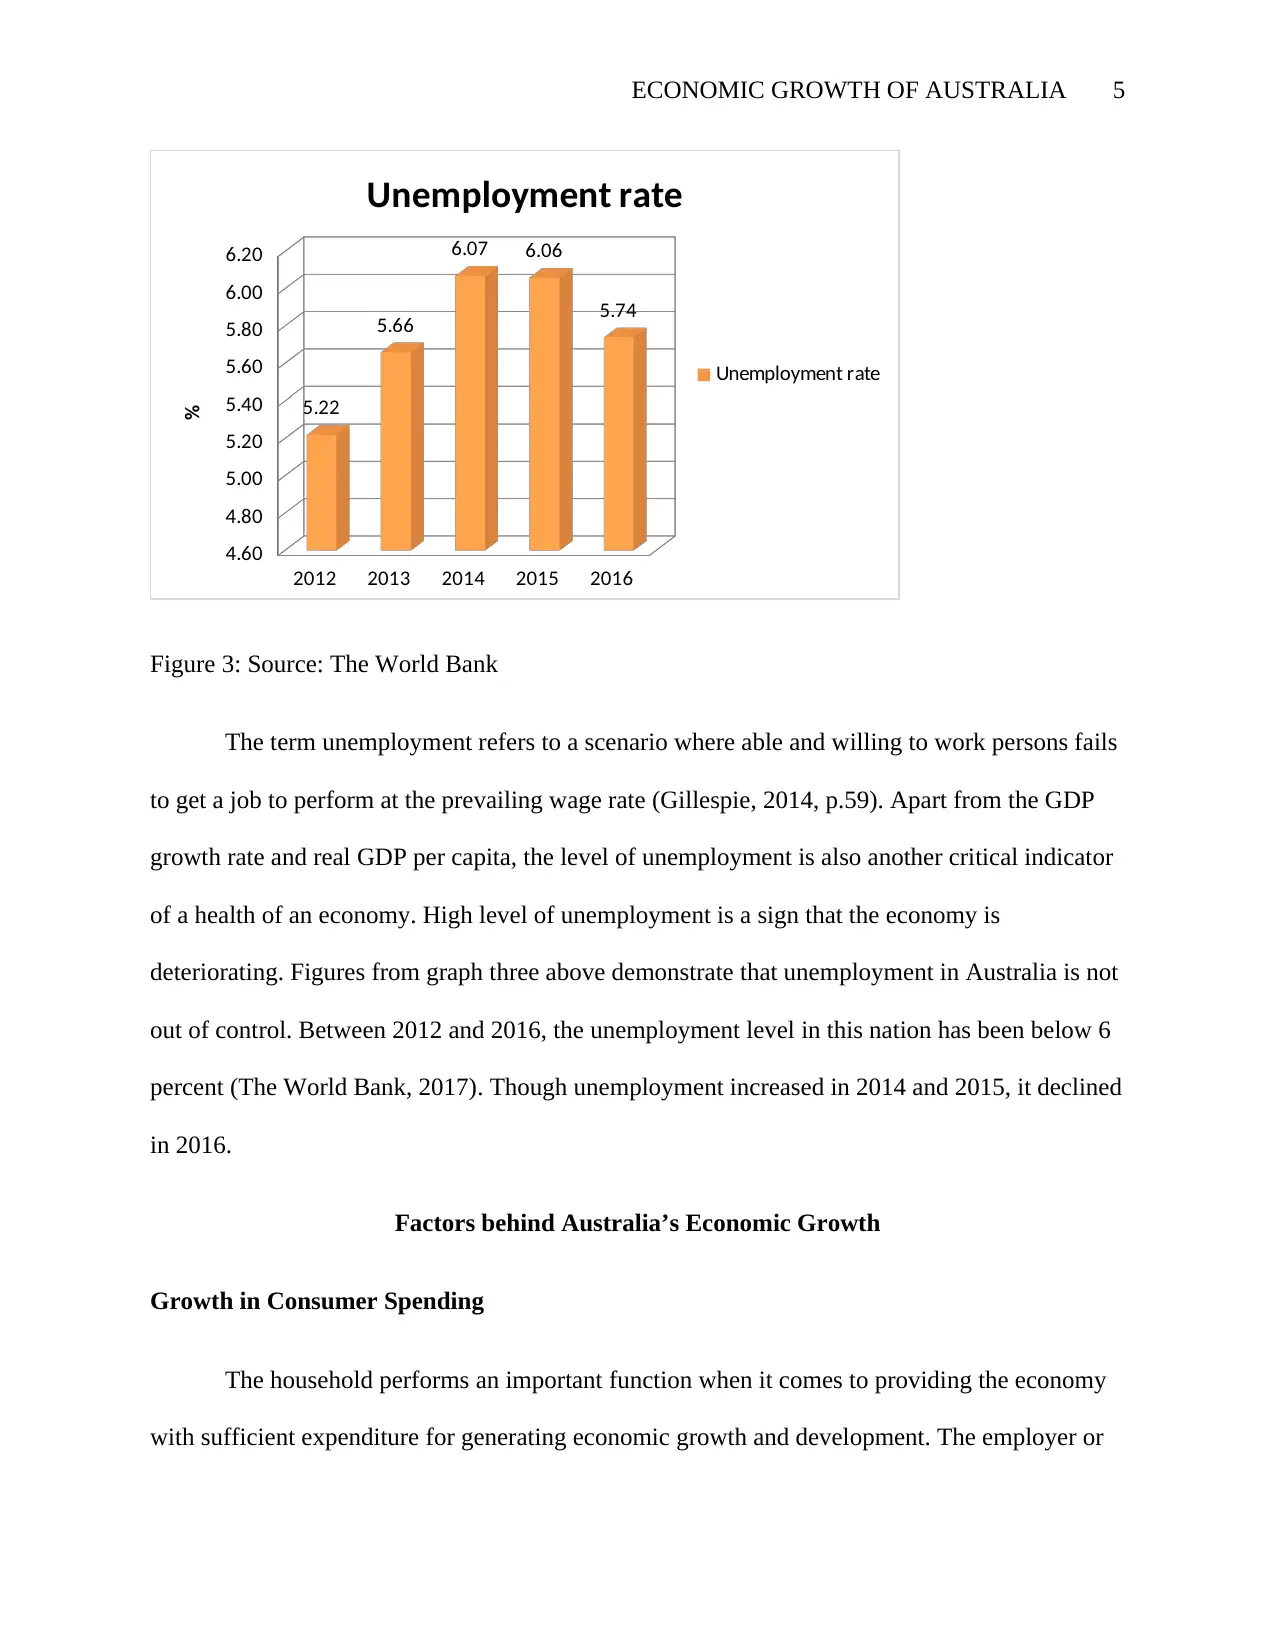
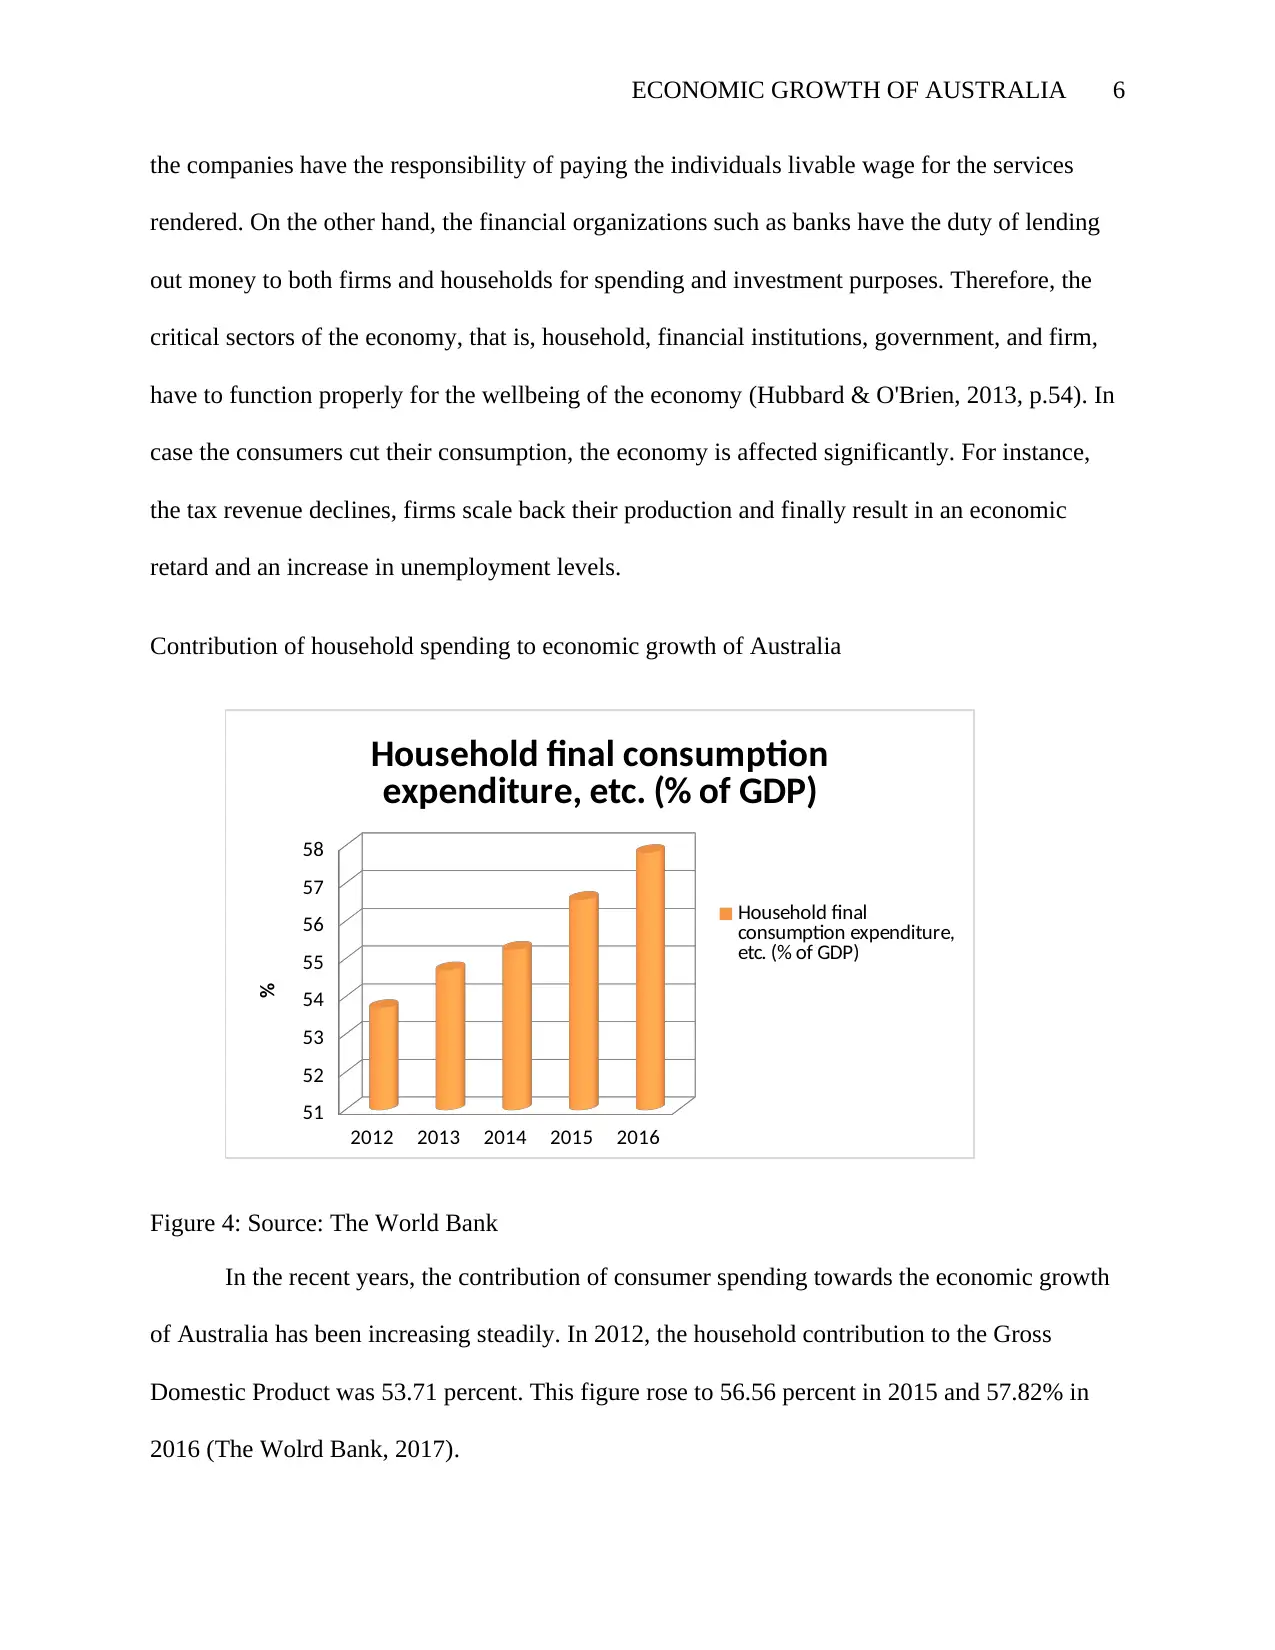
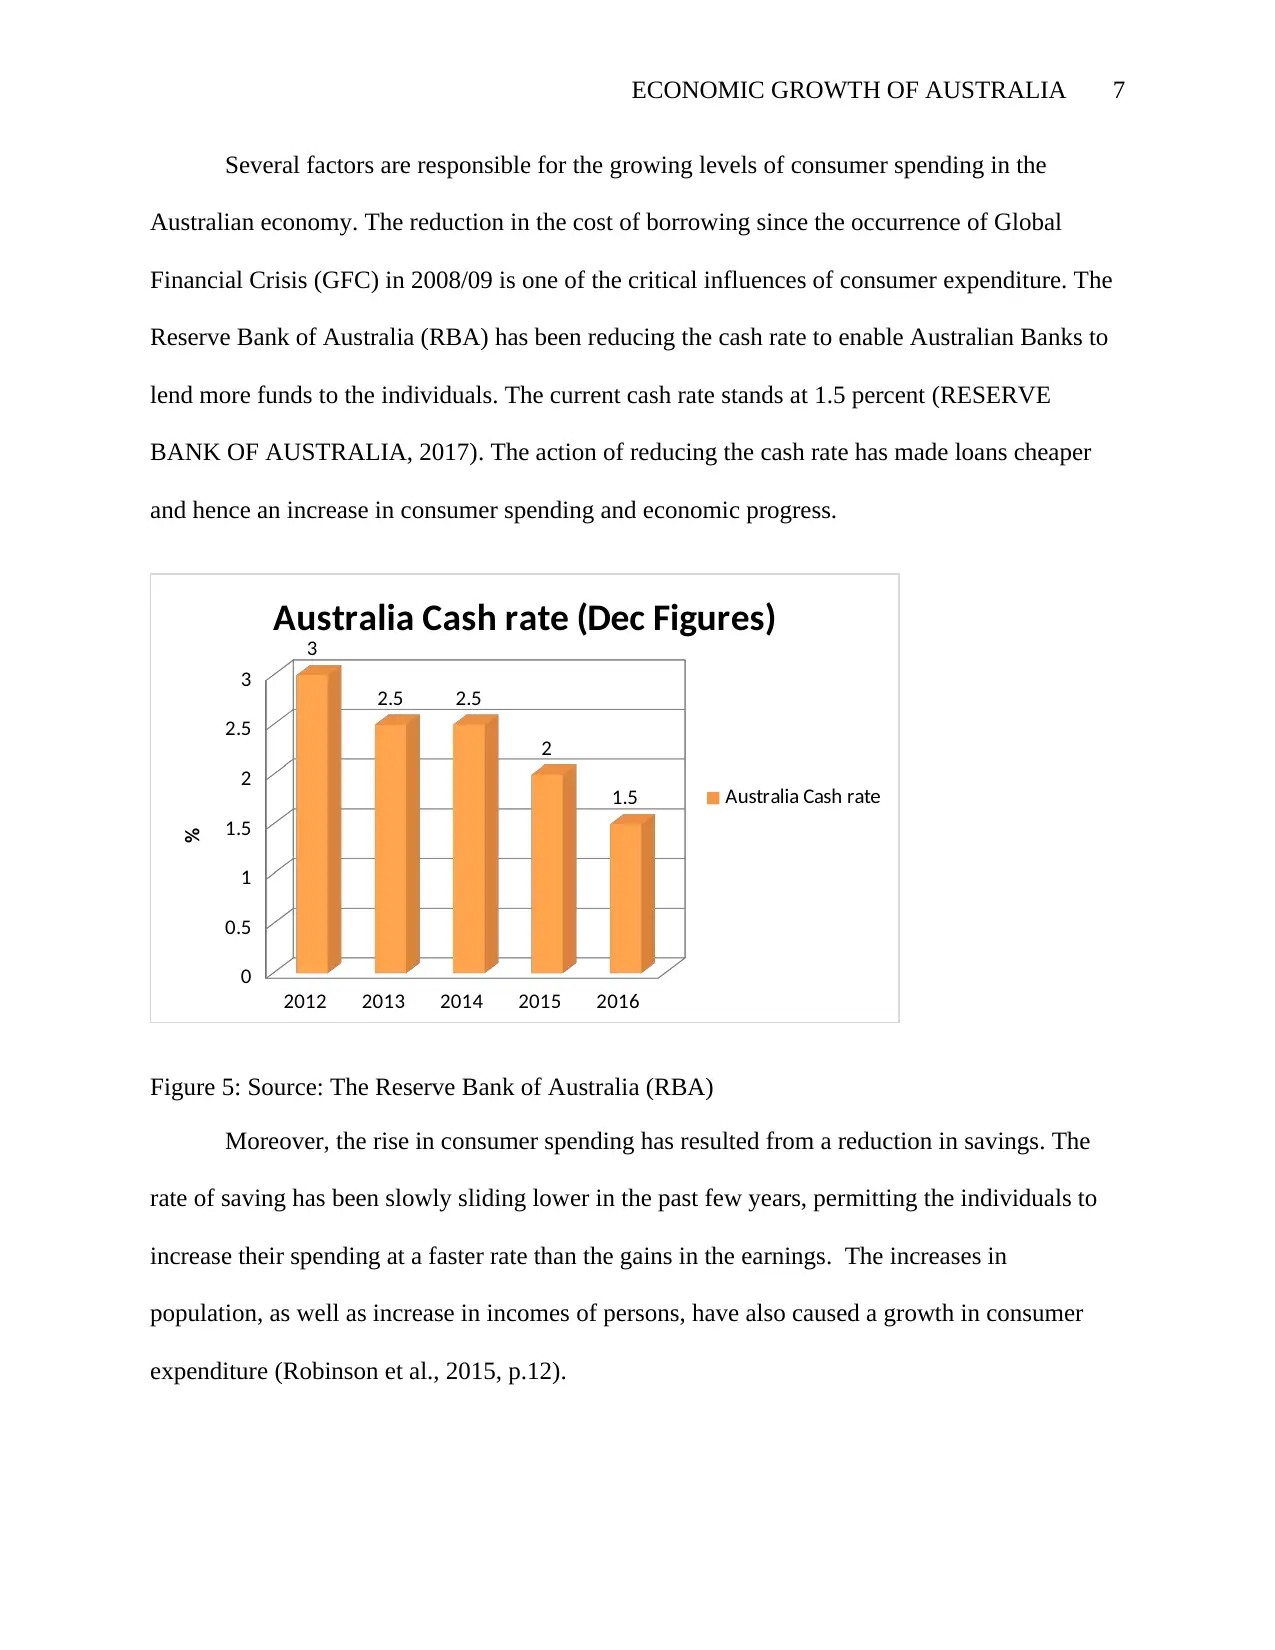
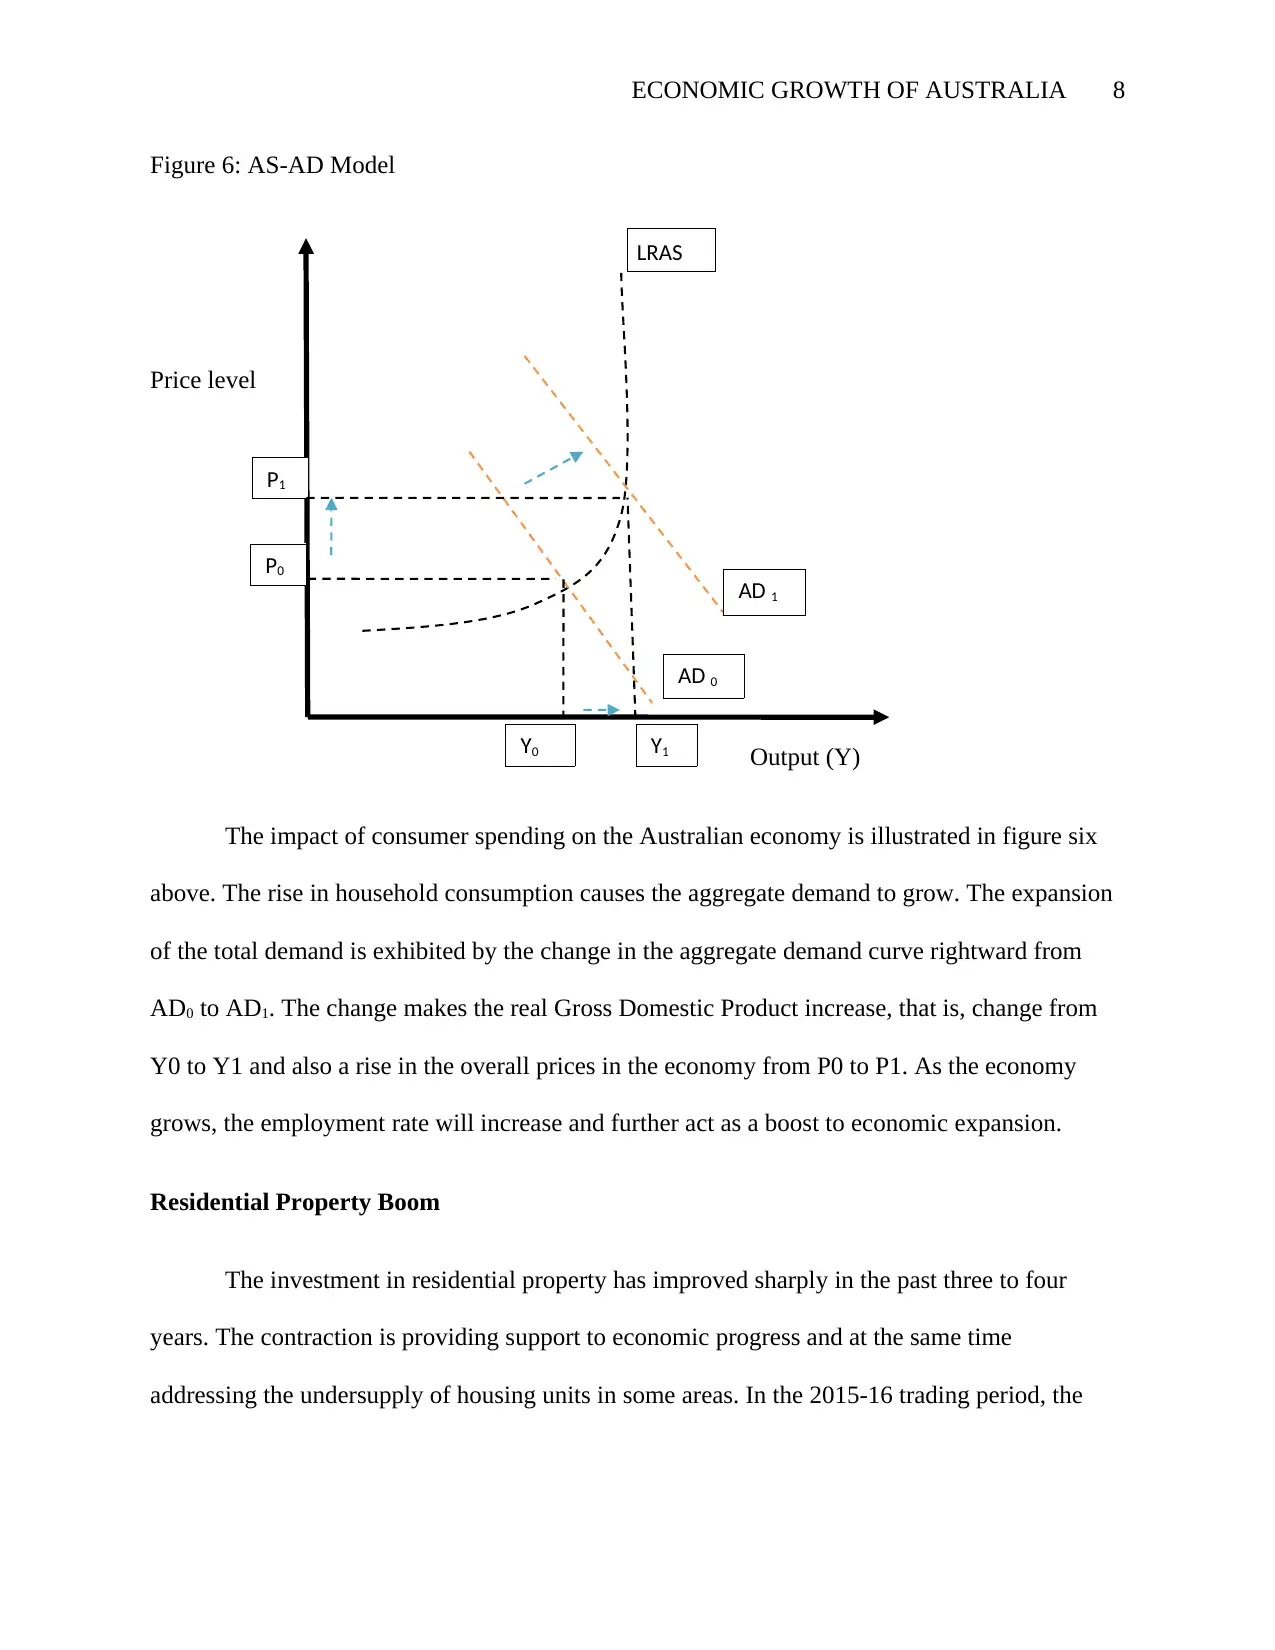
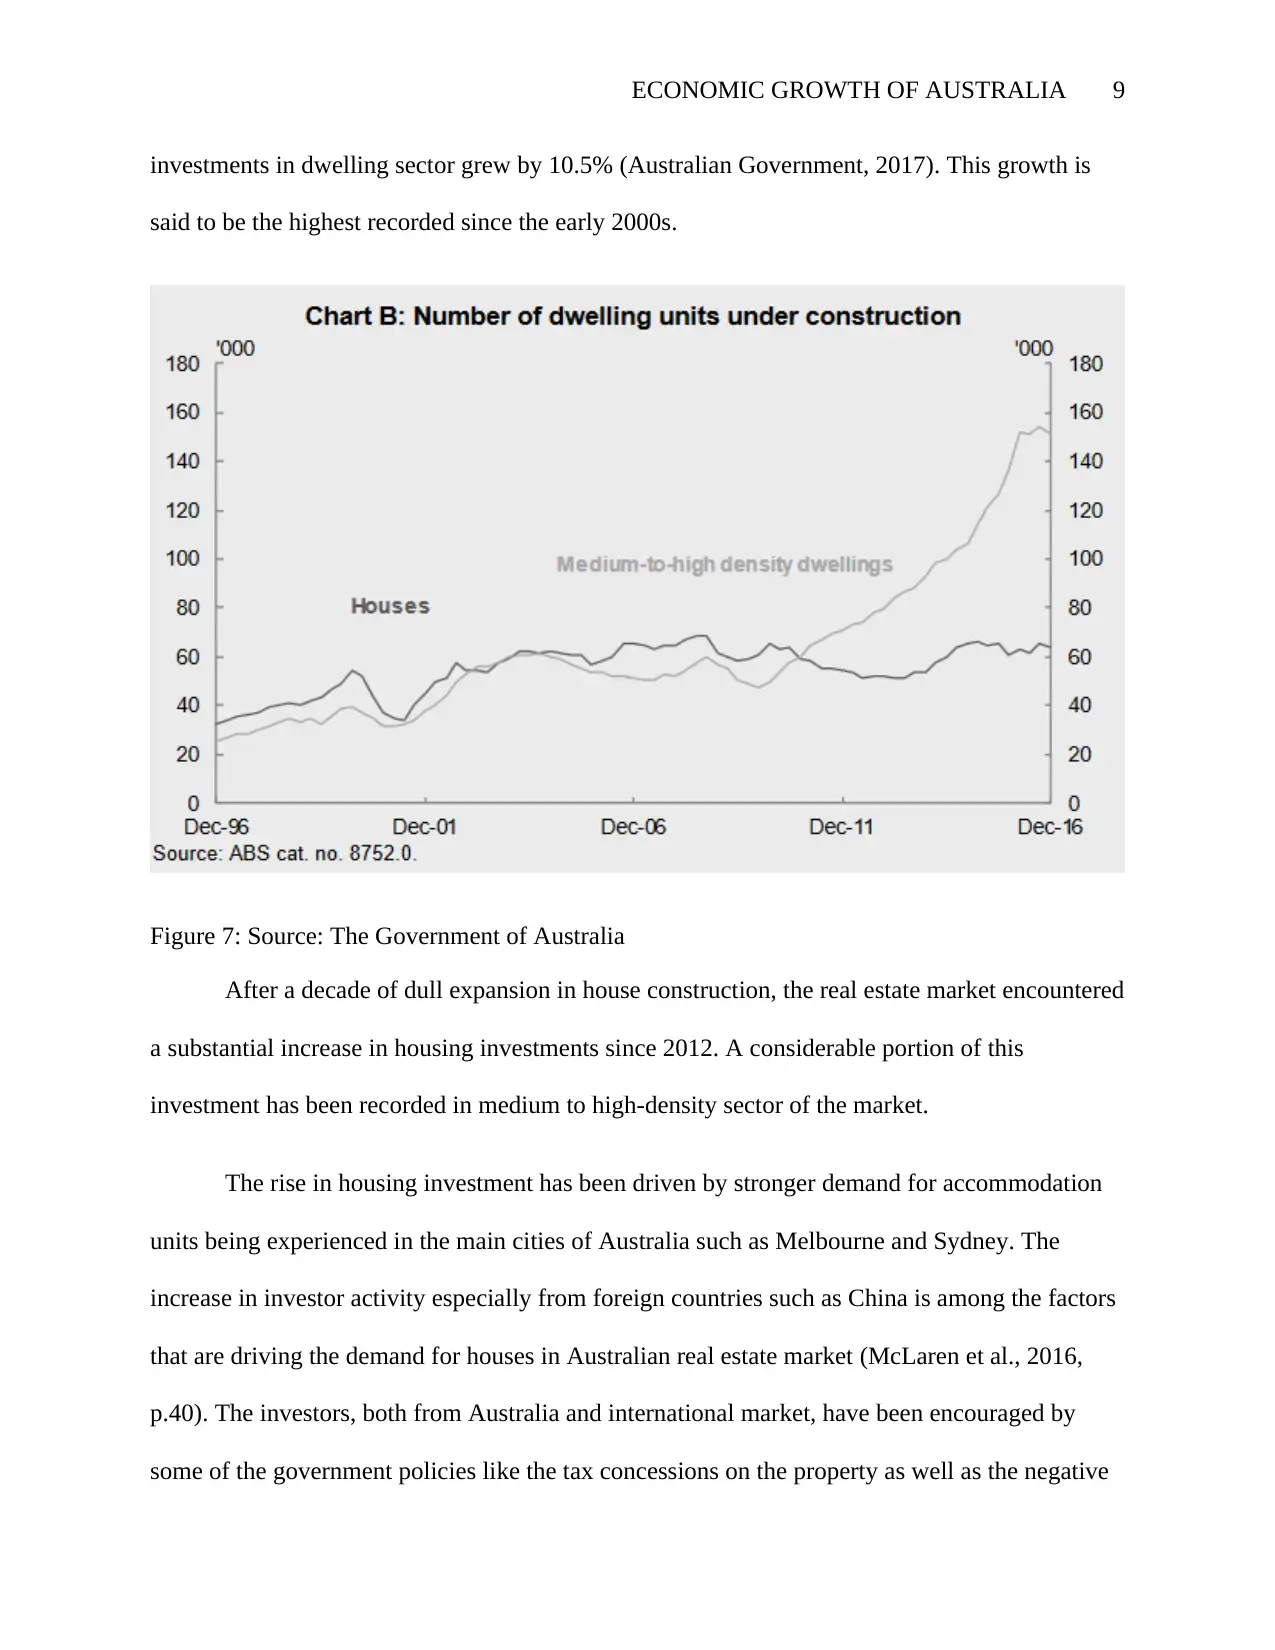
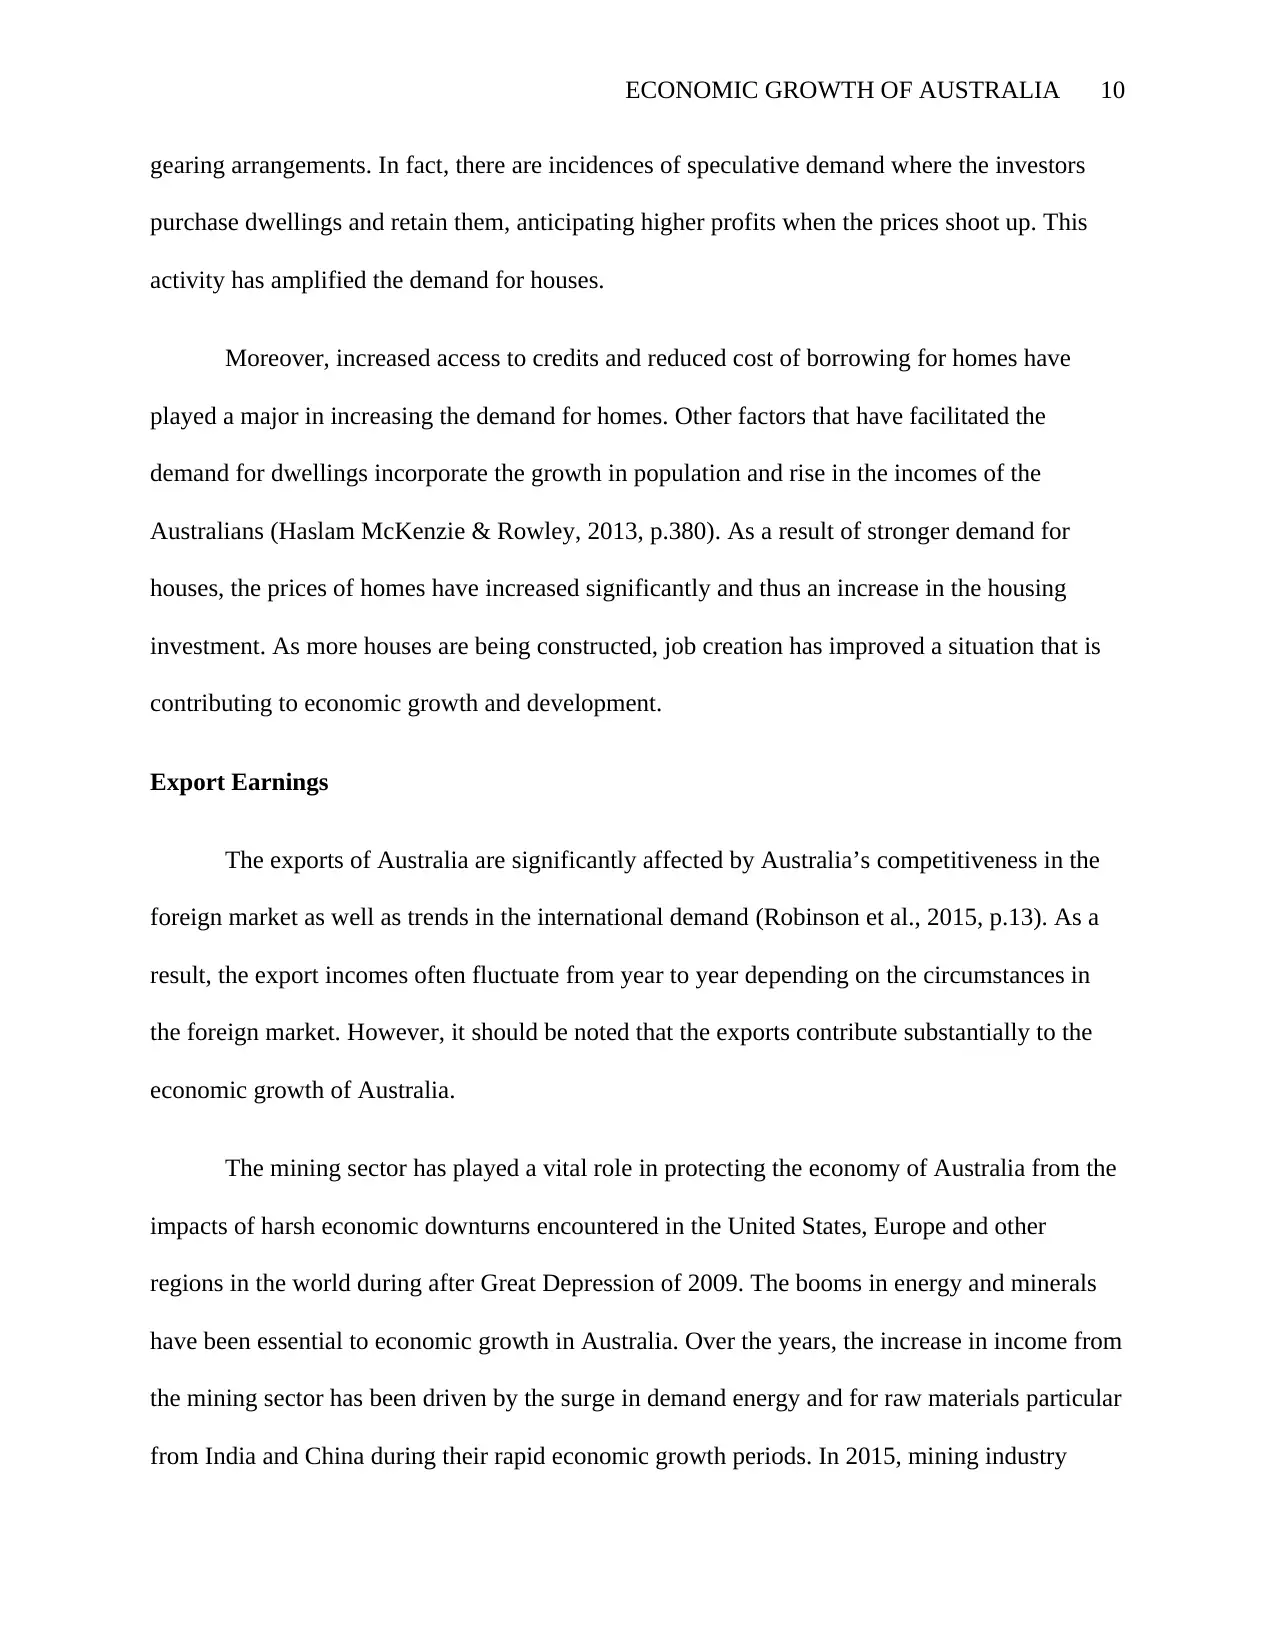
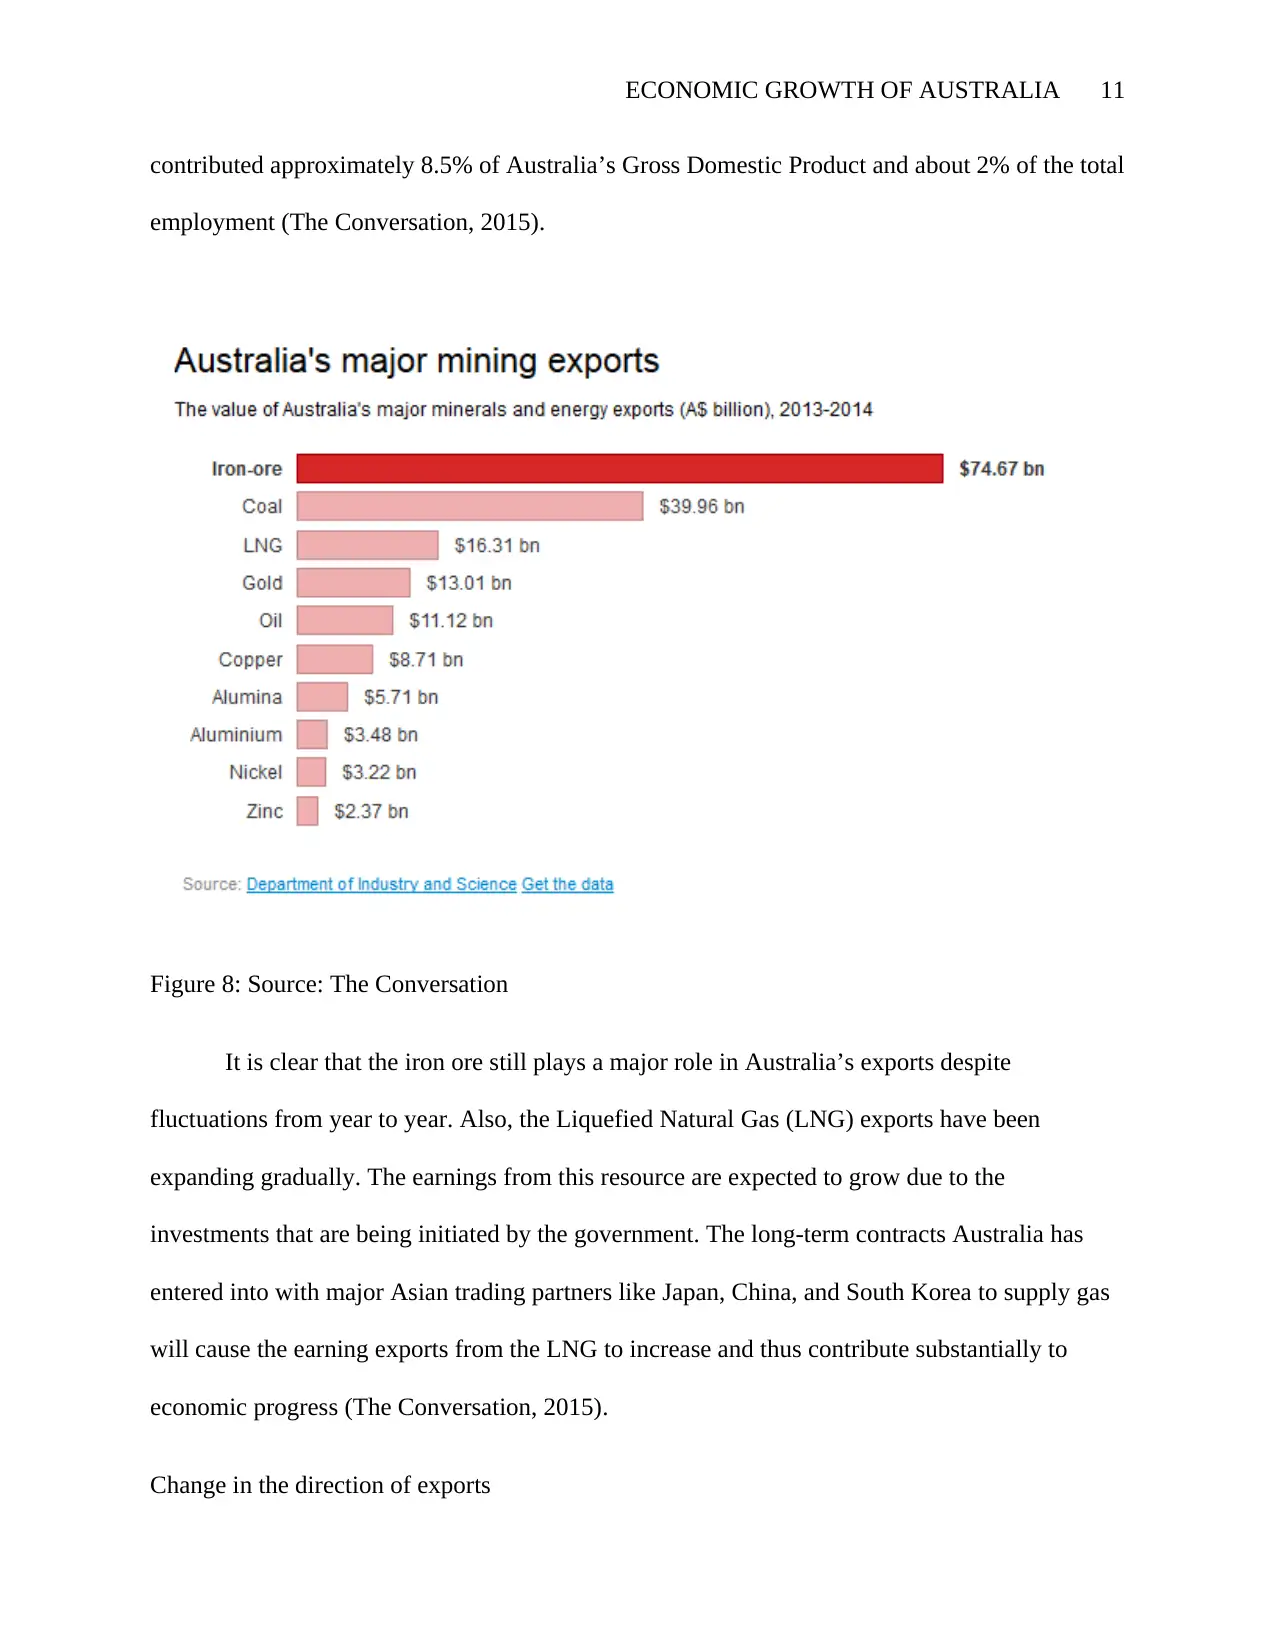
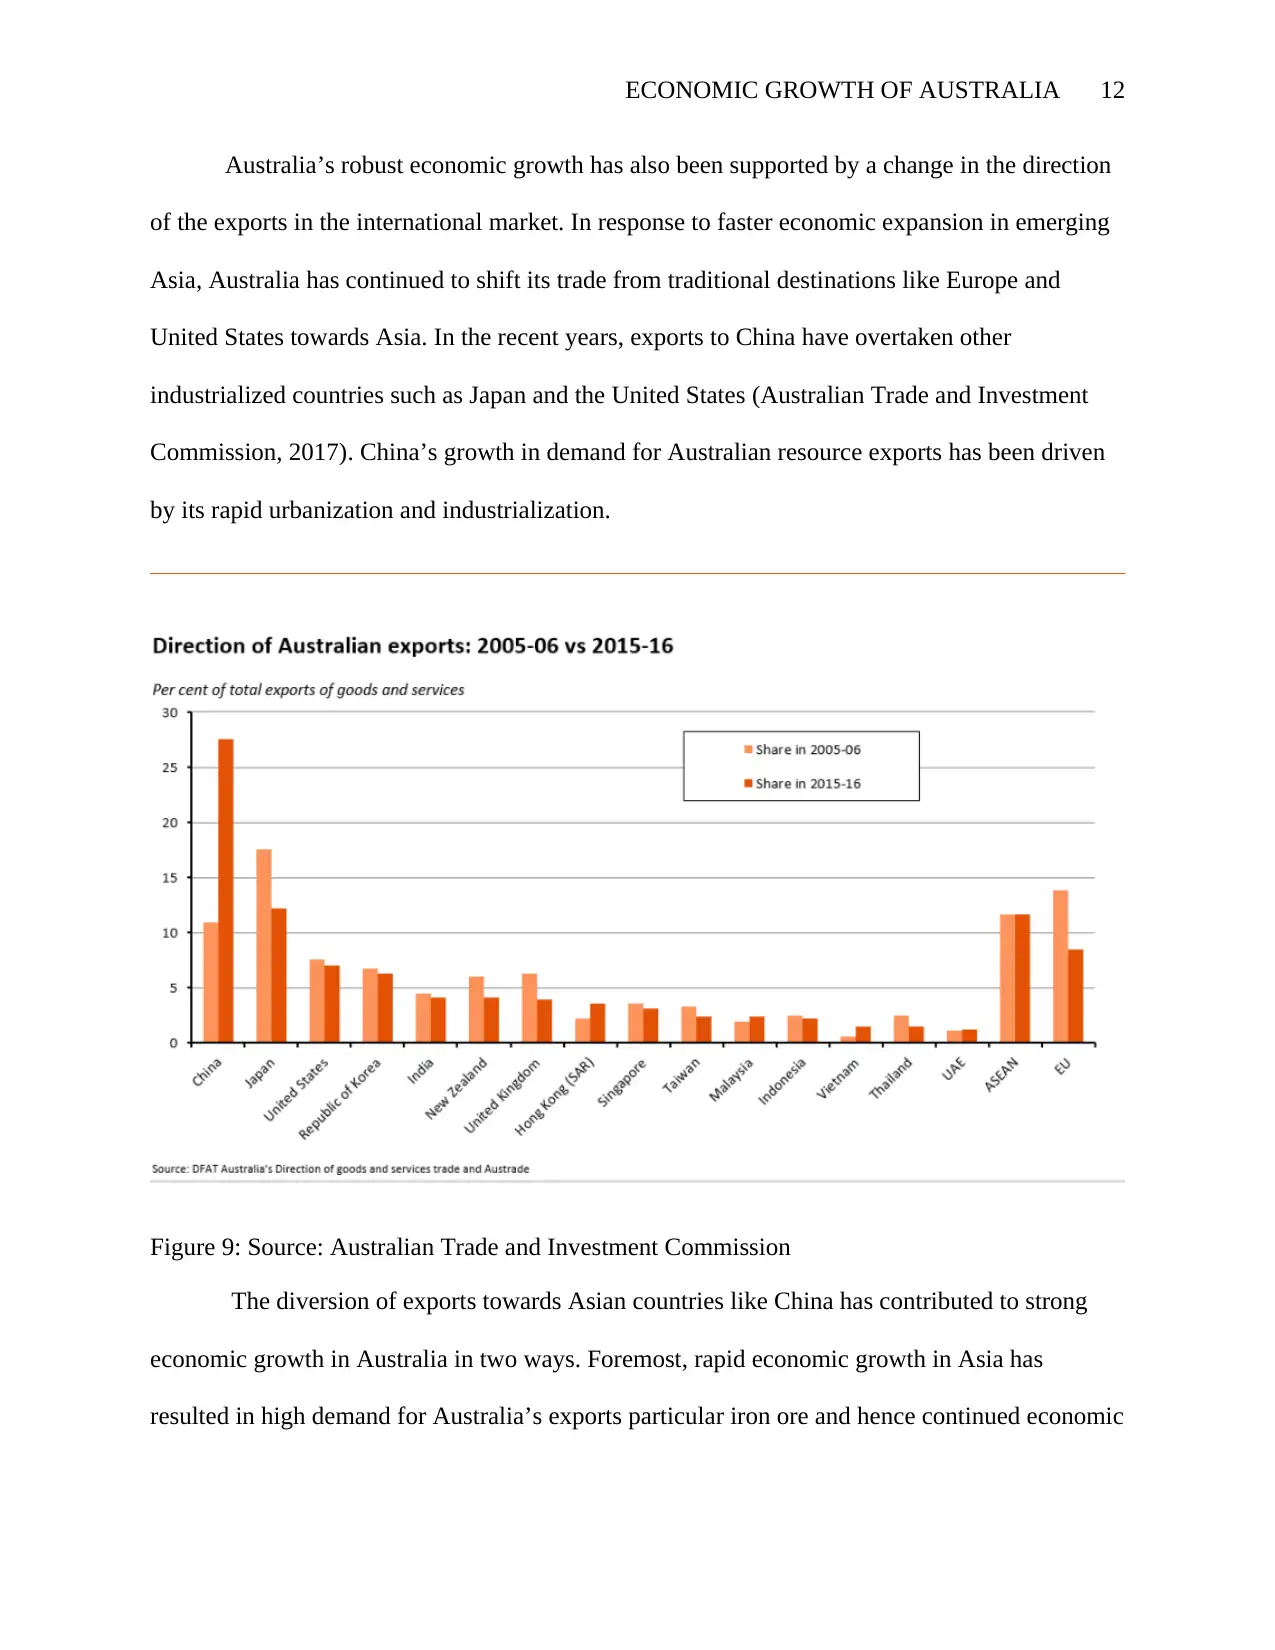
This report provides an in-depth analysis of Australia's economic growth between 2012 and 2017, examining key economic indicators such as GDP growth rate, real GDP per capita, and unemployment levels. The analysis reveals a robust economic expansion driven by factors including increased consumer spending, residential property investments, and export earnings. The report highlights the contribution of household spending, influenced by reduced borrowing costs and increased incomes, to the overall GDP. Furthermore, it discusses the impact of the residential property boom, driven by strong demand and government policies, and the role of export earnings, particularly from the mining sector and LNG, in supporting economic growth. The shift in export direction towards Asia and a favorable business environment, characterized by political stability and economic freedom, are also identified as crucial factors. The report uses various figures, including graphs and models, to illustrate these economic trends and their implications for the Australian economy, concluding that the nation experienced sustained growth during this period.

ECONOMIC GROWTH OF AUSTRALIA 1
ECONOMIC GROWTH OF AUSTRALIA
By (Name)
Name of the class (course)
The Course instructor (Professor)
The Institution
The City and State location
The Date
ECONOMIC GROWTH OF AUSTRALIA
By (Name)
Name of the class (course)
The Course instructor (Professor)
The Institution
The City and State location
The Date
Paraphrase This Document
Need a fresh take? Get an instant paraphrase of this document with our AI Paraphraser

ECONOMIC GROWTH OF AUSTRALIA 2
Introduction
Australia is a self-governing, established and culturally diverse country with a vastly
experienced labor force as well as one of the best-performing economies globally. It is the
globe’s twelfth biggest economy and a top performing country on nearly each measure of merit
in areas like health, wealth, educational attainment, and ease of doing business (Department of
Foreign Affairs and Trade, 2017). For the past twenty-five years, Australia had recorded a robust
economic progress unmarred by the recession. The sound economic policies before and during
the Global Financial Crisis (GFC) in 2008-09 played a central role in ensuring that this economy
remained unhurt by the economic downturn. Although Australia is a far-away from chief world
markets, it is well incorporated into international markets. The country’s top trading partners
include China, United States, and Japan with iron ore, precious stones and metals, minerals fuels
and oil being its top exports. The leading industries include mining, food processing, chemicals
as well as transportation and industrial equipment (Globaledge, 2017). Furthermore, Australia
has a mixed economic coordination in which the economy has an array of private freedom,
combined with government regulation and centralized planning. The country’s trade and foreign
policy uphold its security and long-term affluence. This paper evaluates the economic growth of
Australia between 2012 and 2017. Key economic indicators such as GDP growth rate and
inflation, as well as factors influencing economic growth are discussed.
Economic Growth Indicators in Australia
Annual Real GDP Growth Rate

ECONOMIC GROWTH OF AUSTRALIA 3
2012 2013 2014 2015 2016
0
0.5
1
1.5
2
2.5
3
3.5
4 3.63
2.57 2.61 2.42
2.77
Real GDP growth rate
%
Figure 1: Source: The World Bank
The data from graph one above shows that for the past five years, Australia has recorded
a robust economic growth. The economic expansion has been above 2 percent, and thus this
economy can be categorized under the expansion phase of the business cycle. Such a remarkable
economic growth is an indication that the government of Australia has put in place sound
economic policies and structures that are favorable for the thriving of the economy.
Real GDP Per Capita
⊘ This is a preview!⊘
Do you want full access?
Subscribe today to unlock all pages.

Trusted by 1+ million students worldwide

ECONOMIC GROWTH OF AUSTRALIA 4
2012 2013 2014 2015 2016
52000.000
52500.000
53000.000
53500.000
54000.000
54500.000
55000.000
55500.000
56000.000
Australia's GDP per capita (constant 2010 US$)
Australia's GDP per capita
(constant 2010 US$)
GDP per capita (US. Dollars)
Figure 2: Source: The World Bank
Health economic growth of Australia is also supported by the rising levels of the real
GDP per capita. From 2012 to 2016, the real GDP per capita of Australia has been increasing
significantly. In 2012, the country’s real GDP per capita was 53,348.389 U.S Dollars. In 2016,
this variable rose to 55670.924 U.S Dollars (The World bank, 2017). The rising levels of real
GDP per capita denote that the living standards of Australians are increasing.
The Level of Unemployment
Paraphrase This Document
Need a fresh take? Get an instant paraphrase of this document with our AI Paraphraser

ECONOMIC GROWTH OF AUSTRALIA 5
2012 2013 2014 2015 2016
4.60
4.80
5.00
5.20
5.40
5.60
5.80
6.00
6.20
5.22
5.66
6.07 6.06
5.74
Unemployment rate
Unemployment rate
%
Figure 3: Source: The World Bank
The term unemployment refers to a scenario where able and willing to work persons fails
to get a job to perform at the prevailing wage rate (Gillespie, 2014, p.59). Apart from the GDP
growth rate and real GDP per capita, the level of unemployment is also another critical indicator
of a health of an economy. High level of unemployment is a sign that the economy is
deteriorating. Figures from graph three above demonstrate that unemployment in Australia is not
out of control. Between 2012 and 2016, the unemployment level in this nation has been below 6
percent (The World Bank, 2017). Though unemployment increased in 2014 and 2015, it declined
in 2016.
Factors behind Australia’s Economic Growth
Growth in Consumer Spending
The household performs an important function when it comes to providing the economy
with sufficient expenditure for generating economic growth and development. The employer or

ECONOMIC GROWTH OF AUSTRALIA 6
the companies have the responsibility of paying the individuals livable wage for the services
rendered. On the other hand, the financial organizations such as banks have the duty of lending
out money to both firms and households for spending and investment purposes. Therefore, the
critical sectors of the economy, that is, household, financial institutions, government, and firm,
have to function properly for the wellbeing of the economy (Hubbard & O'Brien, 2013, p.54). In
case the consumers cut their consumption, the economy is affected significantly. For instance,
the tax revenue declines, firms scale back their production and finally result in an economic
retard and an increase in unemployment levels.
Contribution of household spending to economic growth of Australia
2012 2013 2014 2015 2016
51
52
53
54
55
56
57
58
Household final consumption
expenditure, etc. (% of GDP)
Household final
consumption expenditure,
etc. (% of GDP)
%
Figure 4: Source: The World Bank
In the recent years, the contribution of consumer spending towards the economic growth
of Australia has been increasing steadily. In 2012, the household contribution to the Gross
Domestic Product was 53.71 percent. This figure rose to 56.56 percent in 2015 and 57.82% in
2016 (The Wolrd Bank, 2017).
⊘ This is a preview!⊘
Do you want full access?
Subscribe today to unlock all pages.

Trusted by 1+ million students worldwide

ECONOMIC GROWTH OF AUSTRALIA 7
Several factors are responsible for the growing levels of consumer spending in the
Australian economy. The reduction in the cost of borrowing since the occurrence of Global
Financial Crisis (GFC) in 2008/09 is one of the critical influences of consumer expenditure. The
Reserve Bank of Australia (RBA) has been reducing the cash rate to enable Australian Banks to
lend more funds to the individuals. The current cash rate stands at 1.5 percent (RESERVE
BANK OF AUSTRALIA, 2017). The action of reducing the cash rate has made loans cheaper
and hence an increase in consumer spending and economic progress.
2012 2013 2014 2015 2016
0
0.5
1
1.5
2
2.5
3
3
2.5 2.5
2
1.5
Australia Cash rate (Dec Figures)
Australia Cash rate
%
Figure 5: Source: The Reserve Bank of Australia (RBA)
Moreover, the rise in consumer spending has resulted from a reduction in savings. The
rate of saving has been slowly sliding lower in the past few years, permitting the individuals to
increase their spending at a faster rate than the gains in the earnings. The increases in
population, as well as increase in incomes of persons, have also caused a growth in consumer
expenditure (Robinson et al., 2015, p.12).
Paraphrase This Document
Need a fresh take? Get an instant paraphrase of this document with our AI Paraphraser

ECONOMIC GROWTH OF AUSTRALIA 8
Figure 6: AS-AD Model
Price level
Output (Y)
The impact of consumer spending on the Australian economy is illustrated in figure six
above. The rise in household consumption causes the aggregate demand to grow. The expansion
of the total demand is exhibited by the change in the aggregate demand curve rightward from
AD0 to AD1. The change makes the real Gross Domestic Product increase, that is, change from
Y0 to Y1 and also a rise in the overall prices in the economy from P0 to P1. As the economy
grows, the employment rate will increase and further act as a boost to economic expansion.
Residential Property Boom
The investment in residential property has improved sharply in the past three to four
years. The contraction is providing support to economic progress and at the same time
addressing the undersupply of housing units in some areas. In the 2015-16 trading period, the
LRAS
P1
P0
AD 1
AD 0
Y1Y0

ECONOMIC GROWTH OF AUSTRALIA 9
investments in dwelling sector grew by 10.5% (Australian Government, 2017). This growth is
said to be the highest recorded since the early 2000s.
Figure 7: Source: The Government of Australia
After a decade of dull expansion in house construction, the real estate market encountered
a substantial increase in housing investments since 2012. A considerable portion of this
investment has been recorded in medium to high-density sector of the market.
The rise in housing investment has been driven by stronger demand for accommodation
units being experienced in the main cities of Australia such as Melbourne and Sydney. The
increase in investor activity especially from foreign countries such as China is among the factors
that are driving the demand for houses in Australian real estate market (McLaren et al., 2016,
p.40). The investors, both from Australia and international market, have been encouraged by
some of the government policies like the tax concessions on the property as well as the negative
⊘ This is a preview!⊘
Do you want full access?
Subscribe today to unlock all pages.

Trusted by 1+ million students worldwide

ECONOMIC GROWTH OF AUSTRALIA 10
gearing arrangements. In fact, there are incidences of speculative demand where the investors
purchase dwellings and retain them, anticipating higher profits when the prices shoot up. This
activity has amplified the demand for houses.
Moreover, increased access to credits and reduced cost of borrowing for homes have
played a major in increasing the demand for homes. Other factors that have facilitated the
demand for dwellings incorporate the growth in population and rise in the incomes of the
Australians (Haslam McKenzie & Rowley, 2013, p.380). As a result of stronger demand for
houses, the prices of homes have increased significantly and thus an increase in the housing
investment. As more houses are being constructed, job creation has improved a situation that is
contributing to economic growth and development.
Export Earnings
The exports of Australia are significantly affected by Australia’s competitiveness in the
foreign market as well as trends in the international demand (Robinson et al., 2015, p.13). As a
result, the export incomes often fluctuate from year to year depending on the circumstances in
the foreign market. However, it should be noted that the exports contribute substantially to the
economic growth of Australia.
The mining sector has played a vital role in protecting the economy of Australia from the
impacts of harsh economic downturns encountered in the United States, Europe and other
regions in the world during after Great Depression of 2009. The booms in energy and minerals
have been essential to economic growth in Australia. Over the years, the increase in income from
the mining sector has been driven by the surge in demand energy and for raw materials particular
from India and China during their rapid economic growth periods. In 2015, mining industry
Paraphrase This Document
Need a fresh take? Get an instant paraphrase of this document with our AI Paraphraser

ECONOMIC GROWTH OF AUSTRALIA 11
contributed approximately 8.5% of Australia’s Gross Domestic Product and about 2% of the total
employment (The Conversation, 2015).
Figure 8: Source: The Conversation
It is clear that the iron ore still plays a major role in Australia’s exports despite
fluctuations from year to year. Also, the Liquefied Natural Gas (LNG) exports have been
expanding gradually. The earnings from this resource are expected to grow due to the
investments that are being initiated by the government. The long-term contracts Australia has
entered into with major Asian trading partners like Japan, China, and South Korea to supply gas
will cause the earning exports from the LNG to increase and thus contribute substantially to
economic progress (The Conversation, 2015).
Change in the direction of exports

ECONOMIC GROWTH OF AUSTRALIA 12
Australia’s robust economic growth has also been supported by a change in the direction
of the exports in the international market. In response to faster economic expansion in emerging
Asia, Australia has continued to shift its trade from traditional destinations like Europe and
United States towards Asia. In the recent years, exports to China have overtaken other
industrialized countries such as Japan and the United States (Australian Trade and Investment
Commission, 2017). China’s growth in demand for Australian resource exports has been driven
by its rapid urbanization and industrialization.
Figure 9: Source: Australian Trade and Investment Commission
The diversion of exports towards Asian countries like China has contributed to strong
economic growth in Australia in two ways. Foremost, rapid economic growth in Asia has
resulted in high demand for Australia’s exports particular iron ore and hence continued economic
⊘ This is a preview!⊘
Do you want full access?
Subscribe today to unlock all pages.

Trusted by 1+ million students worldwide
1 out of 20
Related Documents

Your All-in-One AI-Powered Toolkit for Academic Success.
+13062052269
info@desklib.com
Available 24*7 on WhatsApp / Email
Unlock your academic potential
Copyright © 2020–2025 A2Z Services. All Rights Reserved. Developed and managed by ZUCOL.