MBAF 504: Economic Growth and Convergence: Empirical Analysis
VerifiedAdded on 2023/04/06
|18
|3374
|443
Report
AI Summary
This report examines long-run economic growth and convergence, focusing on GDP per capita data from 1970, 1985, and 2007. It investigates whether poor countries are catching up to richer ones, distinguishing between conditional and unconditional convergence. The analysis includes selecting sample countries, calculating GDP per capita growth, and using box plots and histograms to visualize trends. The report finds limited evidence of convergence, with distributions worsening over time. Factors such as liberal policies, corruption, and lack of sustained capital infusion are discussed as potential reasons for the failure of poor countries to catch up. The study concludes that despite theoretical expectations, an unconditional convergence sets in, where economic growth reaches a saturation point and distributions worsen over time.

1
MBAF 504:
ECONOMICS FROM A BUSINESS PERSPECTIVE
MBAF 504:
ECONOMICS FROM A BUSINESS PERSPECTIVE
Paraphrase This Document
Need a fresh take? Get an instant paraphrase of this document with our AI Paraphraser
2
Contents
1.0 Introduction..........................................................................................................................3
2.0 Background..........................................................................................................................3
3.0 Data analysis........................................................................................................................5
Calculations of growth of GDP per capita.................................................................................6
Box Plot for the year 1970.........................................................................................................6
Box Plot for the year 1985.........................................................................................................7
Box Plot for the year 2007.........................................................................................................7
4.0 Explanation of economic growth and convergence.............................................................9
5.0 Conclusion..........................................................................................................................10
Reference..................................................................................................................................11
Appendix..................................................................................................................................12
3
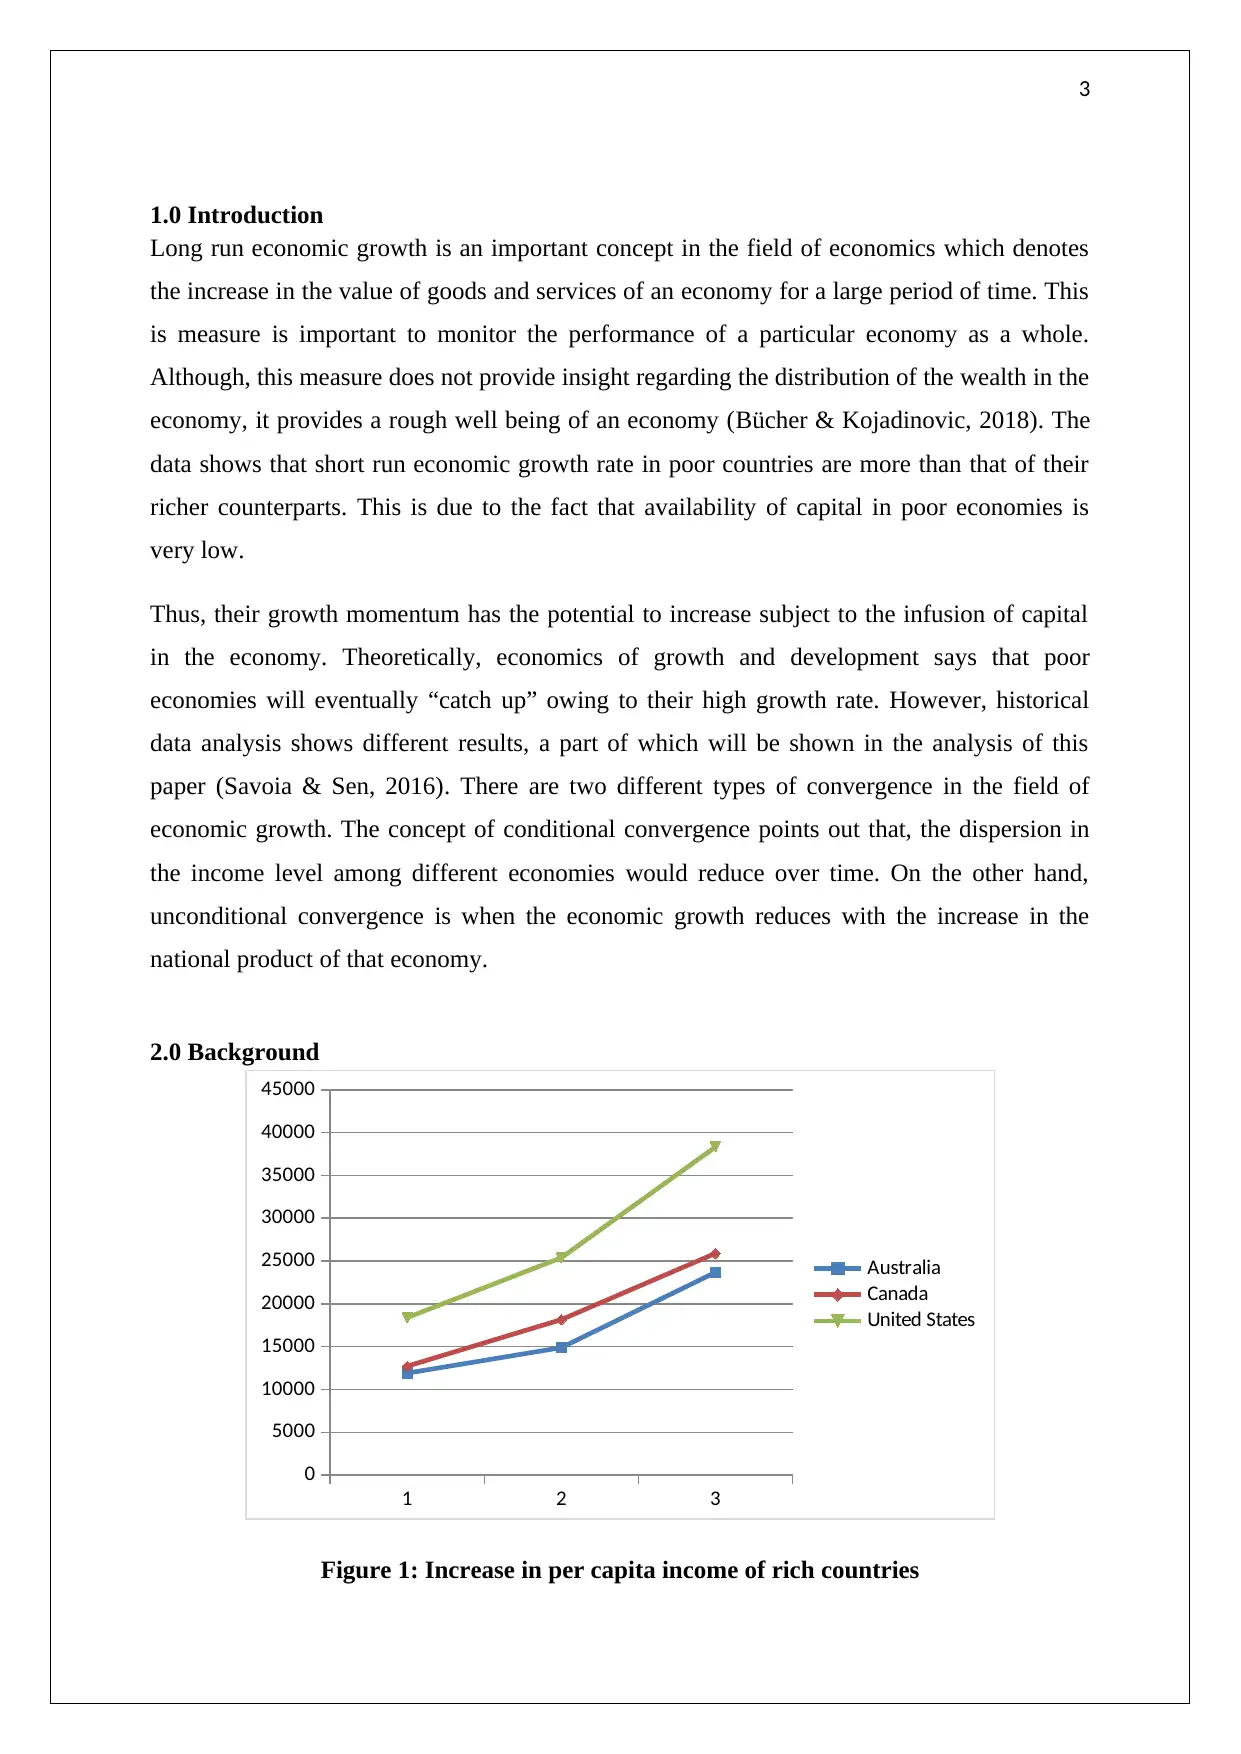
1.0 Introduction
Long run economic growth is an important concept in the field of economics which denotes
the increase in the value of goods and services of an economy for a large period of time. This
is measure is important to monitor the performance of a particular economy as a whole.
Although, this measure does not provide insight regarding the distribution of the wealth in the
economy, it provides a rough well being of an economy (Bücher & Kojadinovic, 2018). The
data shows that short run economic growth rate in poor countries are more than that of their
richer counterparts. This is due to the fact that availability of capital in poor economies is
very low.
Thus, their growth momentum has the potential to increase subject to the infusion of capital
in the economy. Theoretically, economics of growth and development says that poor
economies will eventually “catch up” owing to their high growth rate. However, historical
data analysis shows different results, a part of which will be shown in the analysis of this
paper (Savoia & Sen, 2016). There are two different types of convergence in the field of
economic growth. The concept of conditional convergence points out that, the dispersion in
the income level among different economies would reduce over time. On the other hand,
unconditional convergence is when the economic growth reduces with the increase in the
national product of that economy.
2.0 Background
1 2 3
0
5000
10000
15000
20000
25000
30000
35000
40000
45000
Australia
Canada
United States
Figure 1: Increase in per capita income of rich countries
⊘ This is a preview!⊘
Do you want full access?
Subscribe today to unlock all pages.
Trusted by 1+ million students worldwide
4
(Source: Developed by the learner)
1 2 3
0
100
200
300
400
500
600
700
Nigeria
Bangladesh
Pakistan
Figure 2: Increase in per capita income of poor countries
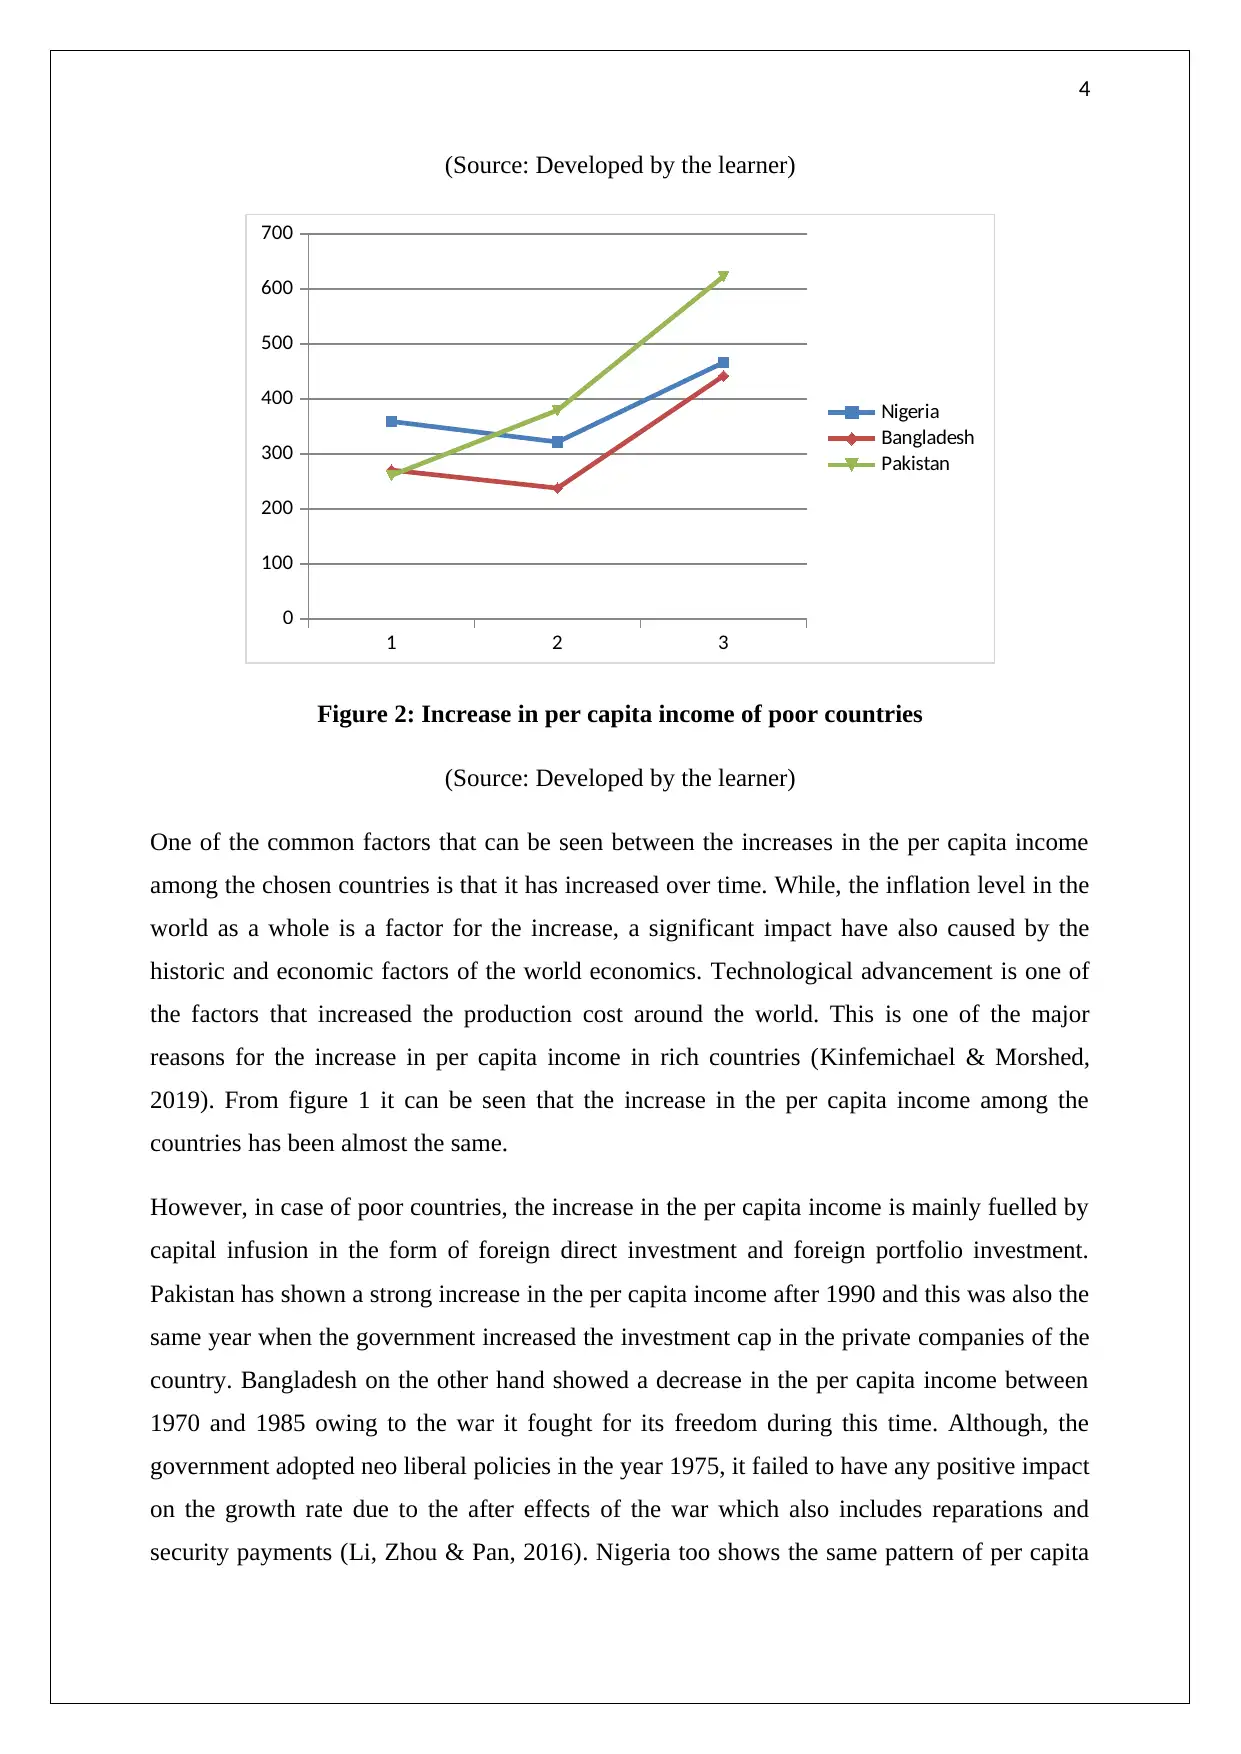
(Source: Developed by the learner)
One of the common factors that can be seen between the increases in the per capita income
among the chosen countries is that it has increased over time. While, the inflation level in the
world as a whole is a factor for the increase, a significant impact have also caused by the
historic and economic factors of the world economics. Technological advancement is one of
the factors that increased the production cost around the world. This is one of the major
reasons for the increase in per capita income in rich countries (Kinfemichael & Morshed,
2019). From figure 1 it can be seen that the increase in the per capita income among the
countries has been almost the same.
However, in case of poor countries, the increase in the per capita income is mainly fuelled by
capital infusion in the form of foreign direct investment and foreign portfolio investment.
Pakistan has shown a strong increase in the per capita income after 1990 and this was also the
same year when the government increased the investment cap in the private companies of the
country. Bangladesh on the other hand showed a decrease in the per capita income between
1970 and 1985 owing to the war it fought for its freedom during this time. Although, the
government adopted neo liberal policies in the year 1975, it failed to have any positive impact
on the growth rate due to the after effects of the war which also includes reparations and
security payments (Li, Zhou & Pan, 2016). Nigeria too shows the same pattern of per capita
(Source: Developed by the learner)
1 2 3
0
100
200
300
400
500
600
700
Nigeria
Bangladesh
Pakistan
Figure 2: Increase in per capita income of poor countries
(Source: Developed by the learner)
One of the common factors that can be seen between the increases in the per capita income
among the chosen countries is that it has increased over time. While, the inflation level in the
world as a whole is a factor for the increase, a significant impact have also caused by the
historic and economic factors of the world economics. Technological advancement is one of
the factors that increased the production cost around the world. This is one of the major
reasons for the increase in per capita income in rich countries (Kinfemichael & Morshed,
2019). From figure 1 it can be seen that the increase in the per capita income among the
countries has been almost the same.
However, in case of poor countries, the increase in the per capita income is mainly fuelled by
capital infusion in the form of foreign direct investment and foreign portfolio investment.
Pakistan has shown a strong increase in the per capita income after 1990 and this was also the
same year when the government increased the investment cap in the private companies of the
country. Bangladesh on the other hand showed a decrease in the per capita income between
1970 and 1985 owing to the war it fought for its freedom during this time. Although, the
government adopted neo liberal policies in the year 1975, it failed to have any positive impact
on the growth rate due to the after effects of the war which also includes reparations and
security payments (Li, Zhou & Pan, 2016). Nigeria too shows the same pattern of per capita
Paraphrase This Document
Need a fresh take? Get an instant paraphrase of this document with our AI Paraphraser
5
income as Bangladesh, however, increase in per capita income was much lower than that of
Bangladesh. The civil war in Nigeria ended in the year 1970 and after that it took time to
boost the national growth just like Bangladesh.
3.0 Data analysis
0
20
40
60
80
100
120
140
0 10000 20000 30000 40000 50000 60000
Series: Y1970
Sample 1 188
Observations 188
Mean 3937.432
Median 1278.380
Maximum 66571.87
Minimum 27.28000
Std. Dev. 7344.305
Skewness 4.692026
Kurtosis 34.02394
Jarque-Bera 8229.269
Probability 0.000000
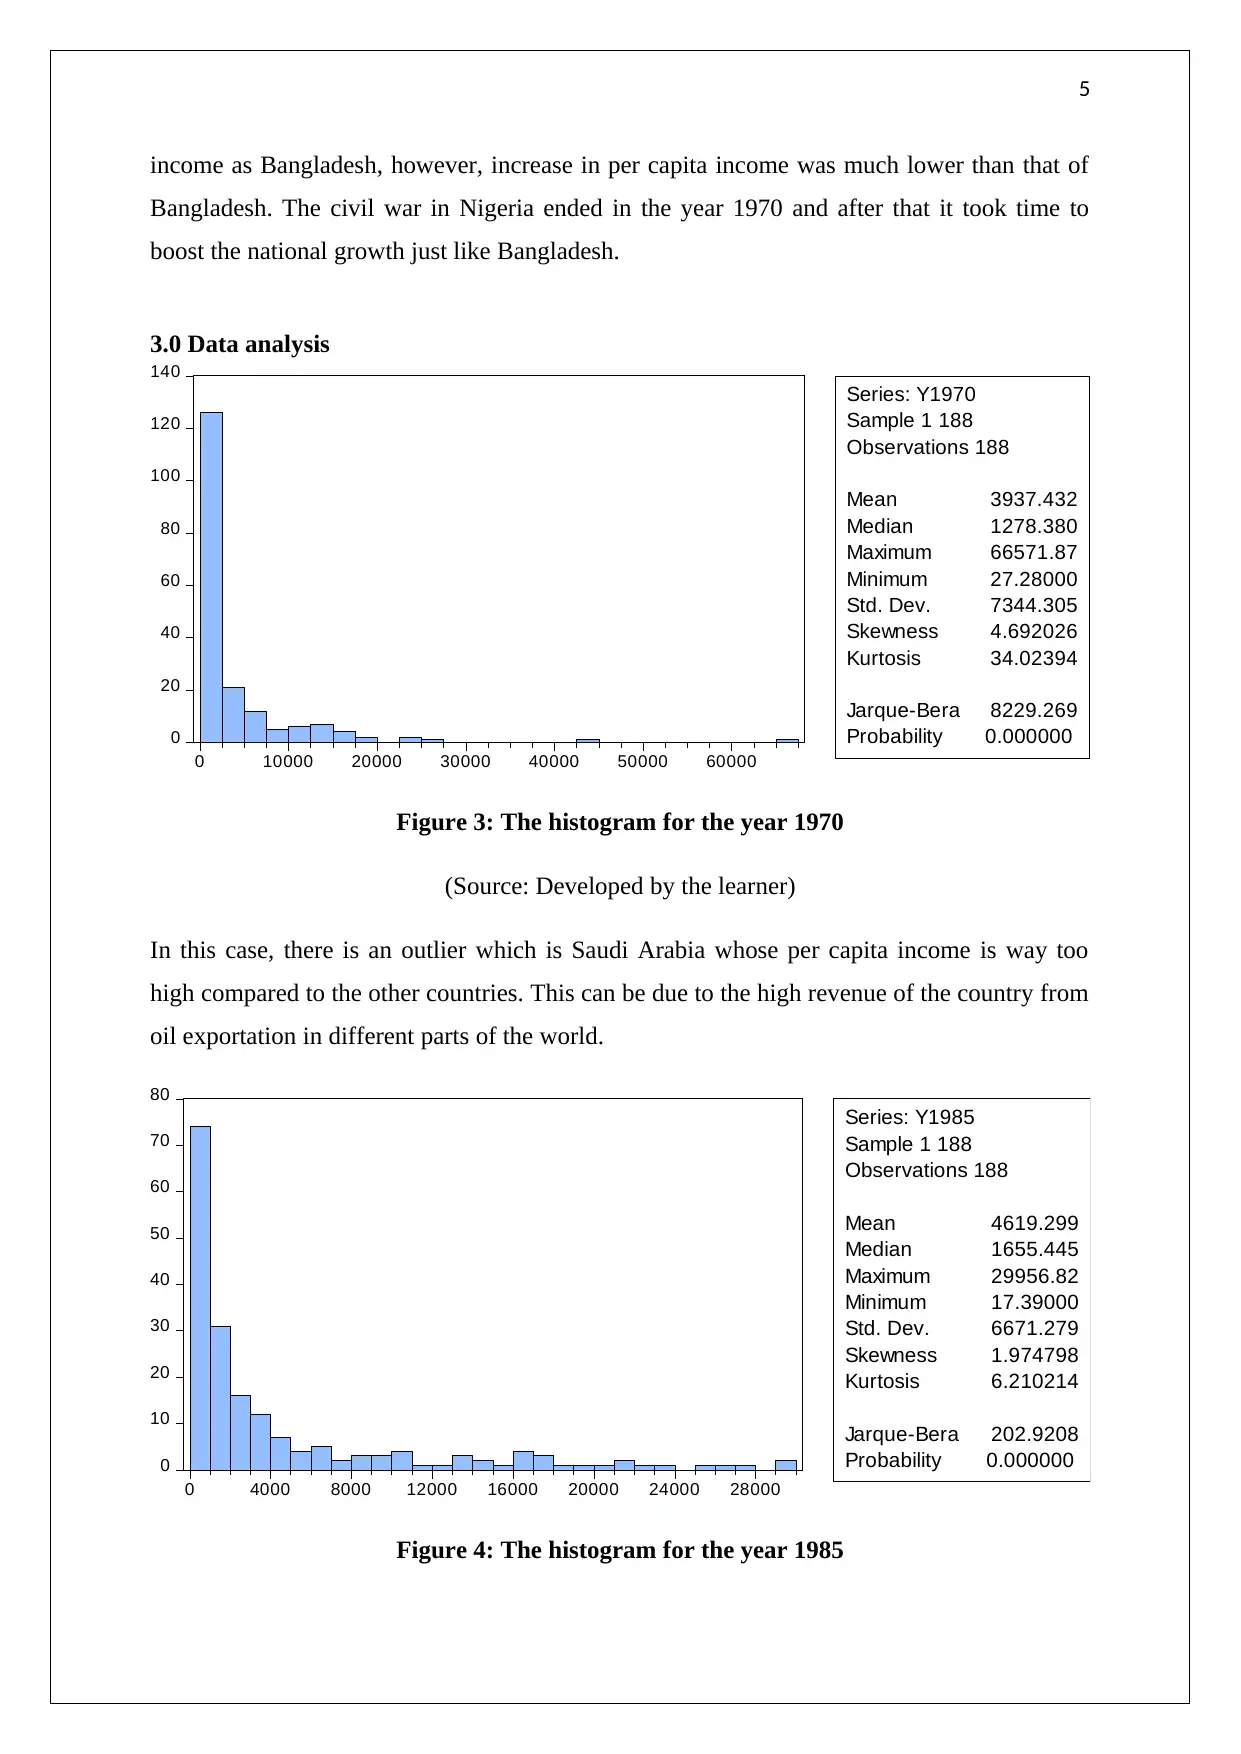
Figure 3: The histogram for the year 1970
(Source: Developed by the learner)
In this case, there is an outlier which is Saudi Arabia whose per capita income is way too
high compared to the other countries. This can be due to the high revenue of the country from
oil exportation in different parts of the world.
0
10
20
30
40
50
60
70
80
0 4000 8000 12000 16000 20000 24000 28000
Series: Y1985
Sample 1 188
Observations 188
Mean 4619.299
Median 1655.445
Maximum 29956.82
Minimum 17.39000
Std. Dev. 6671.279
Skewness 1.974798
Kurtosis 6.210214
Jarque-Bera 202.9208
Probability 0.000000
Figure 4: The histogram for the year 1985
income as Bangladesh, however, increase in per capita income was much lower than that of
Bangladesh. The civil war in Nigeria ended in the year 1970 and after that it took time to
boost the national growth just like Bangladesh.
3.0 Data analysis
0
20
40
60
80
100
120
140
0 10000 20000 30000 40000 50000 60000
Series: Y1970
Sample 1 188
Observations 188
Mean 3937.432
Median 1278.380
Maximum 66571.87
Minimum 27.28000
Std. Dev. 7344.305
Skewness 4.692026
Kurtosis 34.02394
Jarque-Bera 8229.269
Probability 0.000000
Figure 3: The histogram for the year 1970
(Source: Developed by the learner)
In this case, there is an outlier which is Saudi Arabia whose per capita income is way too
high compared to the other countries. This can be due to the high revenue of the country from
oil exportation in different parts of the world.
0
10
20
30
40
50
60
70
80
0 4000 8000 12000 16000 20000 24000 28000
Series: Y1985
Sample 1 188
Observations 188
Mean 4619.299
Median 1655.445
Maximum 29956.82
Minimum 17.39000
Std. Dev. 6671.279
Skewness 1.974798
Kurtosis 6.210214
Jarque-Bera 202.9208
Probability 0.000000
Figure 4: The histogram for the year 1985
6
(Source: Developed by the learner)
0
20
40
60
80
100
120
0 10000 20000 30000 40000 50000
Series: Y2007
Sample 1 188
Observations 188
Mean 7460.105
Median 2259.140
Maximum 51924.06
Minimum 105.1800
Std. Dev. 10844.90
Skewness 1.876412
Kurtosis 5.802772
Jarque-Bera 171.8572
Probability 0.000000
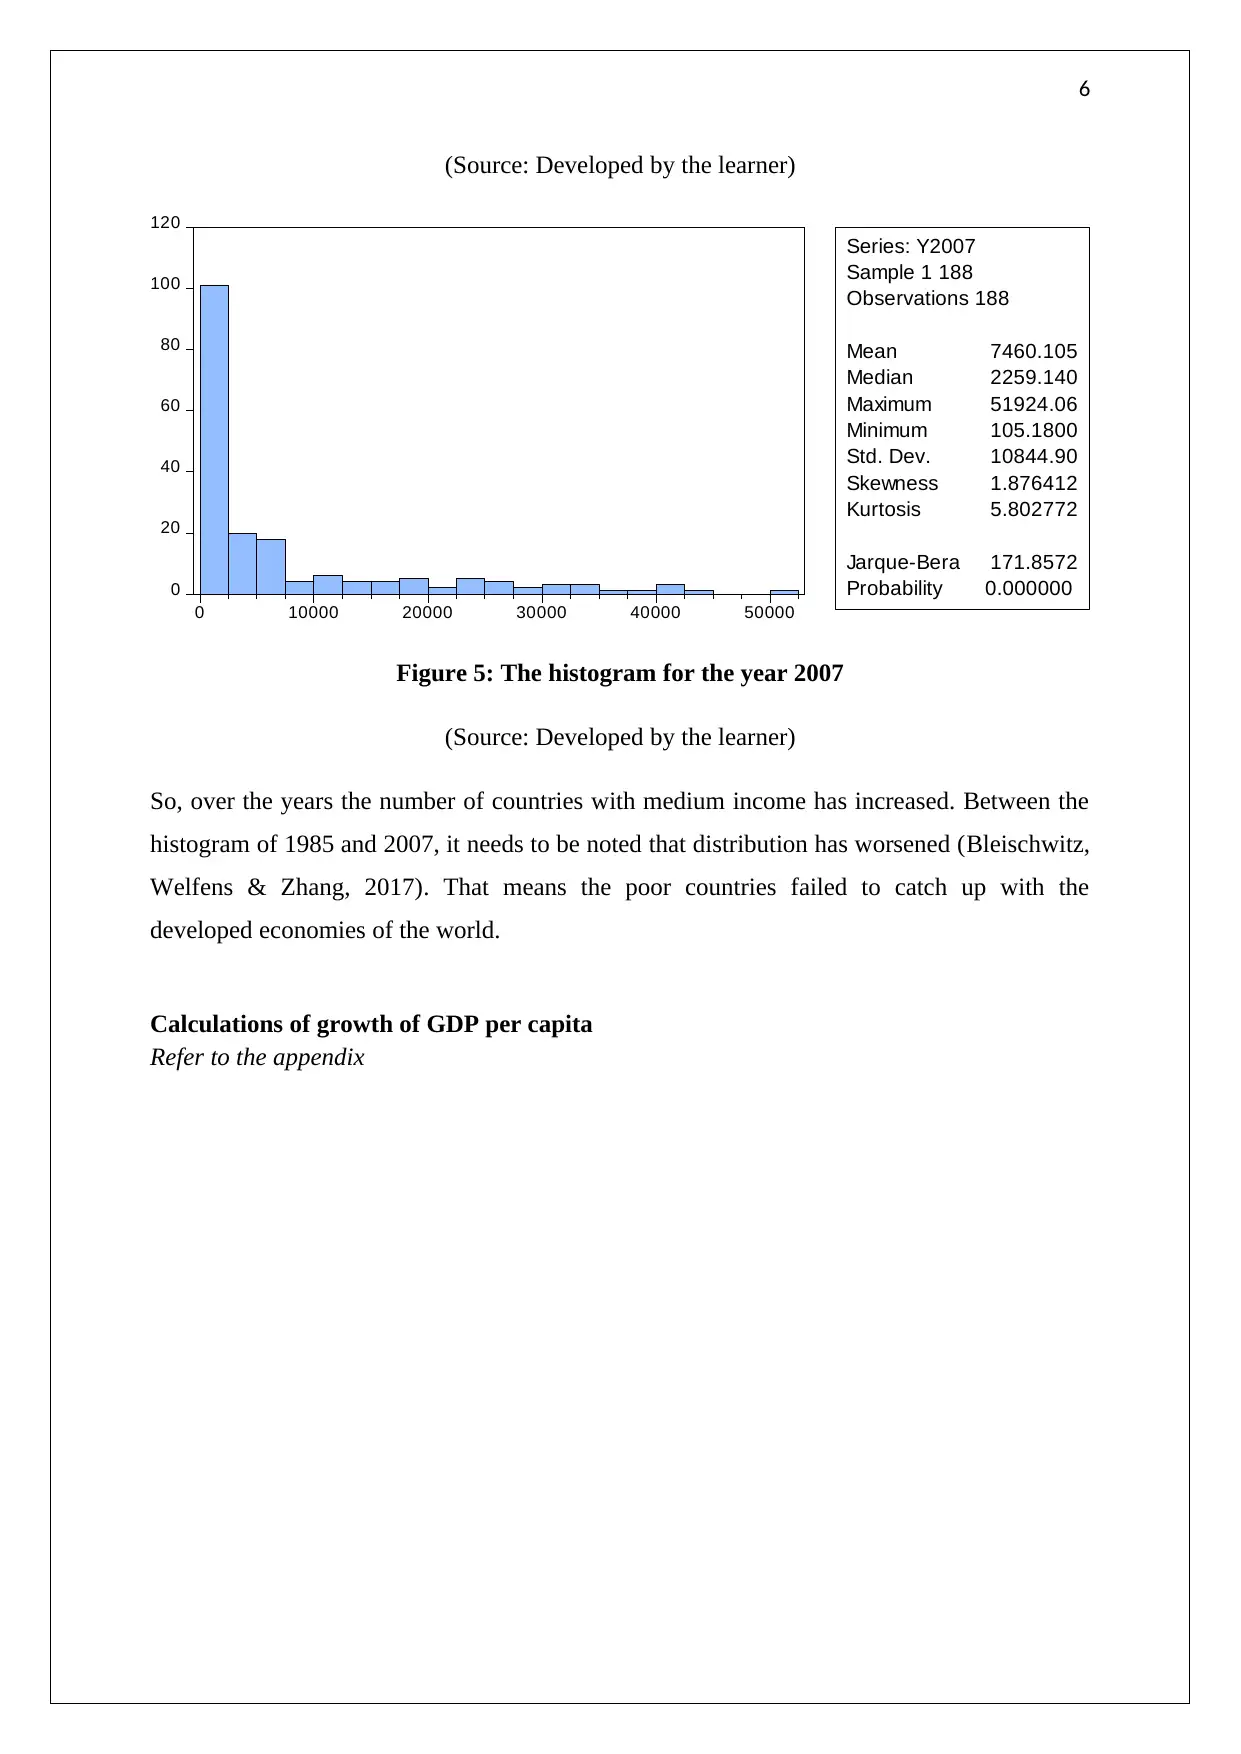
Figure 5: The histogram for the year 2007
(Source: Developed by the learner)
So, over the years the number of countries with medium income has increased. Between the
histogram of 1985 and 2007, it needs to be noted that distribution has worsened (Bleischwitz,
Welfens & Zhang, 2017). That means the poor countries failed to catch up with the
developed economies of the world.
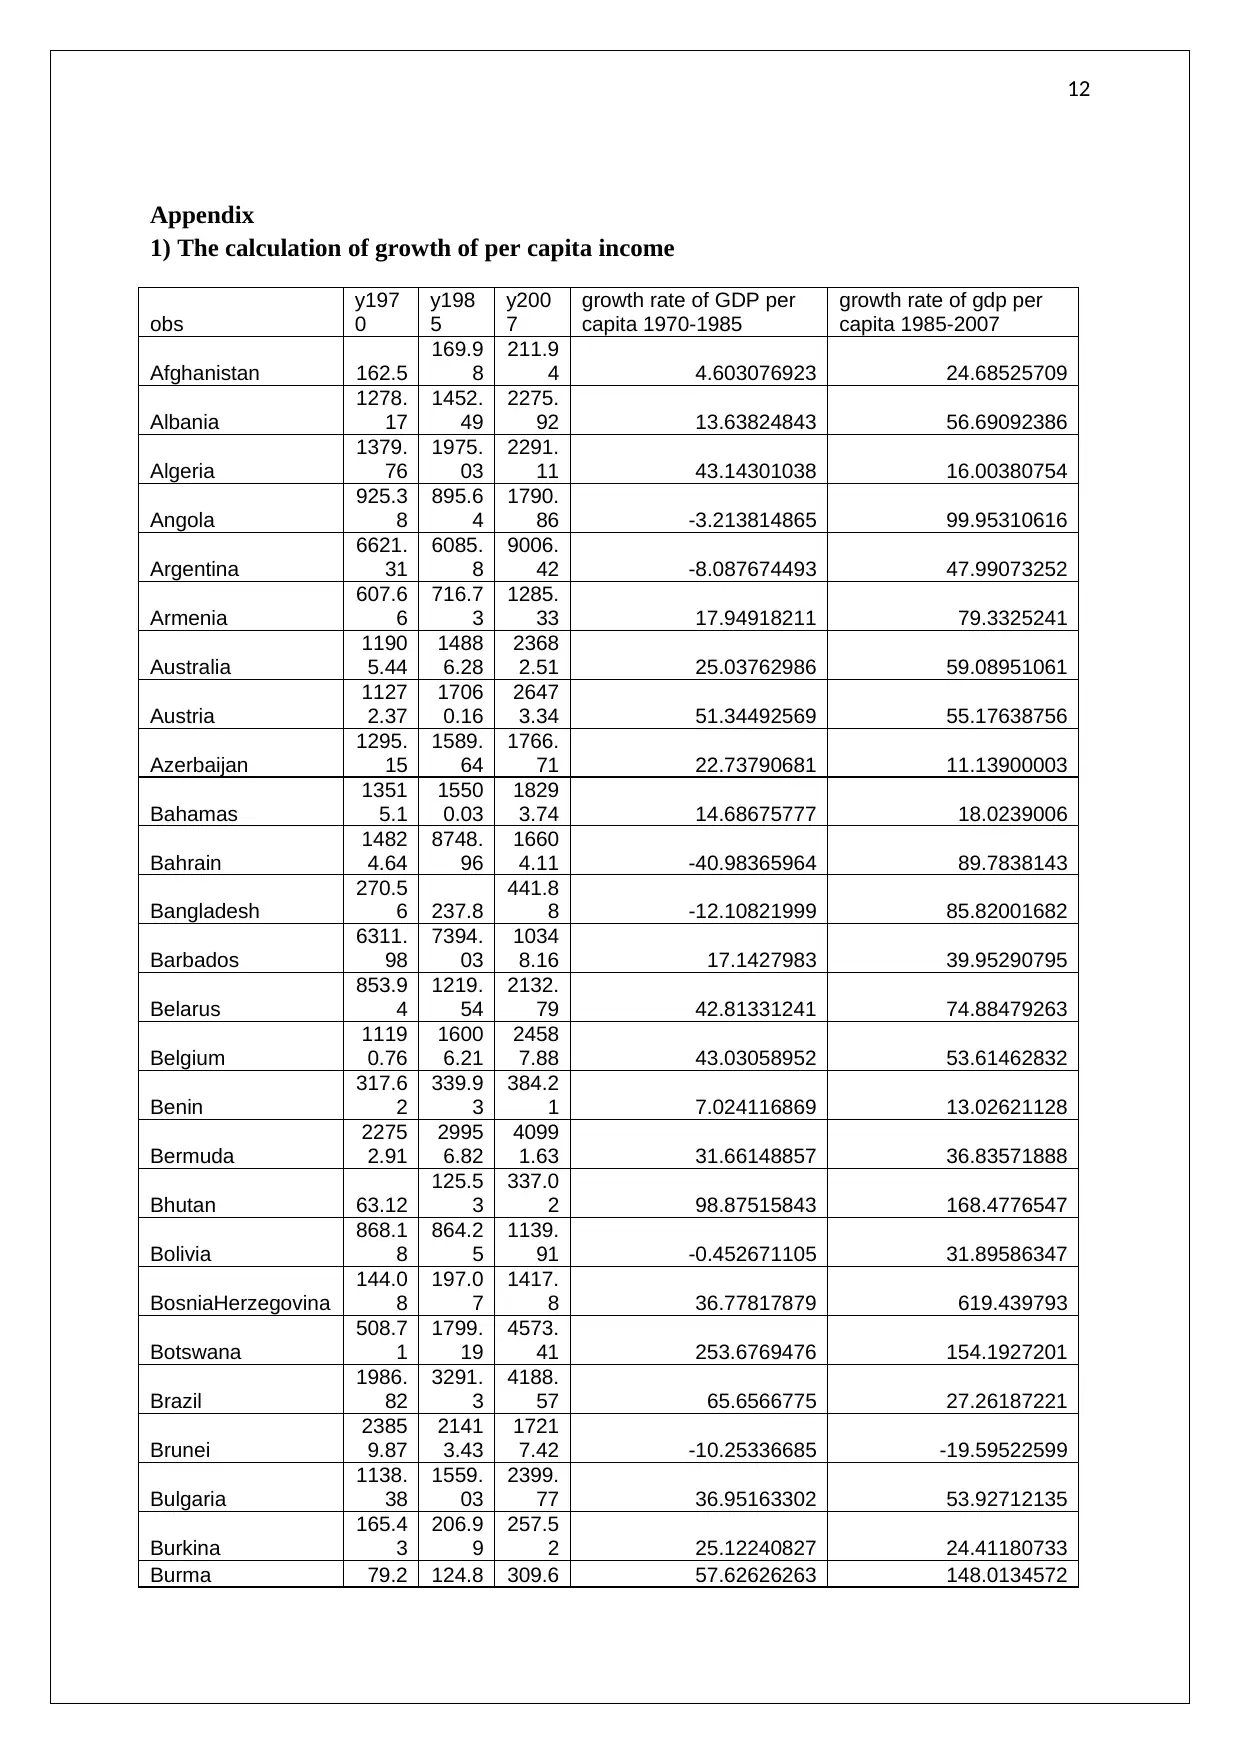
Calculations of growth of GDP per capita
Refer to the appendix
(Source: Developed by the learner)
0
20
40
60
80
100
120
0 10000 20000 30000 40000 50000
Series: Y2007
Sample 1 188
Observations 188
Mean 7460.105
Median 2259.140
Maximum 51924.06
Minimum 105.1800
Std. Dev. 10844.90
Skewness 1.876412
Kurtosis 5.802772
Jarque-Bera 171.8572
Probability 0.000000
Figure 5: The histogram for the year 2007
(Source: Developed by the learner)
So, over the years the number of countries with medium income has increased. Between the
histogram of 1985 and 2007, it needs to be noted that distribution has worsened (Bleischwitz,
Welfens & Zhang, 2017). That means the poor countries failed to catch up with the
developed economies of the world.
Calculations of growth of GDP per capita
Refer to the appendix
⊘ This is a preview!⊘
Do you want full access?
Subscribe today to unlock all pages.
Trusted by 1+ million students worldwide
7
Box Plot for the year 1970
0
10,000
20,000
30,000
40,000
50,000
60,000
70,000
y1970
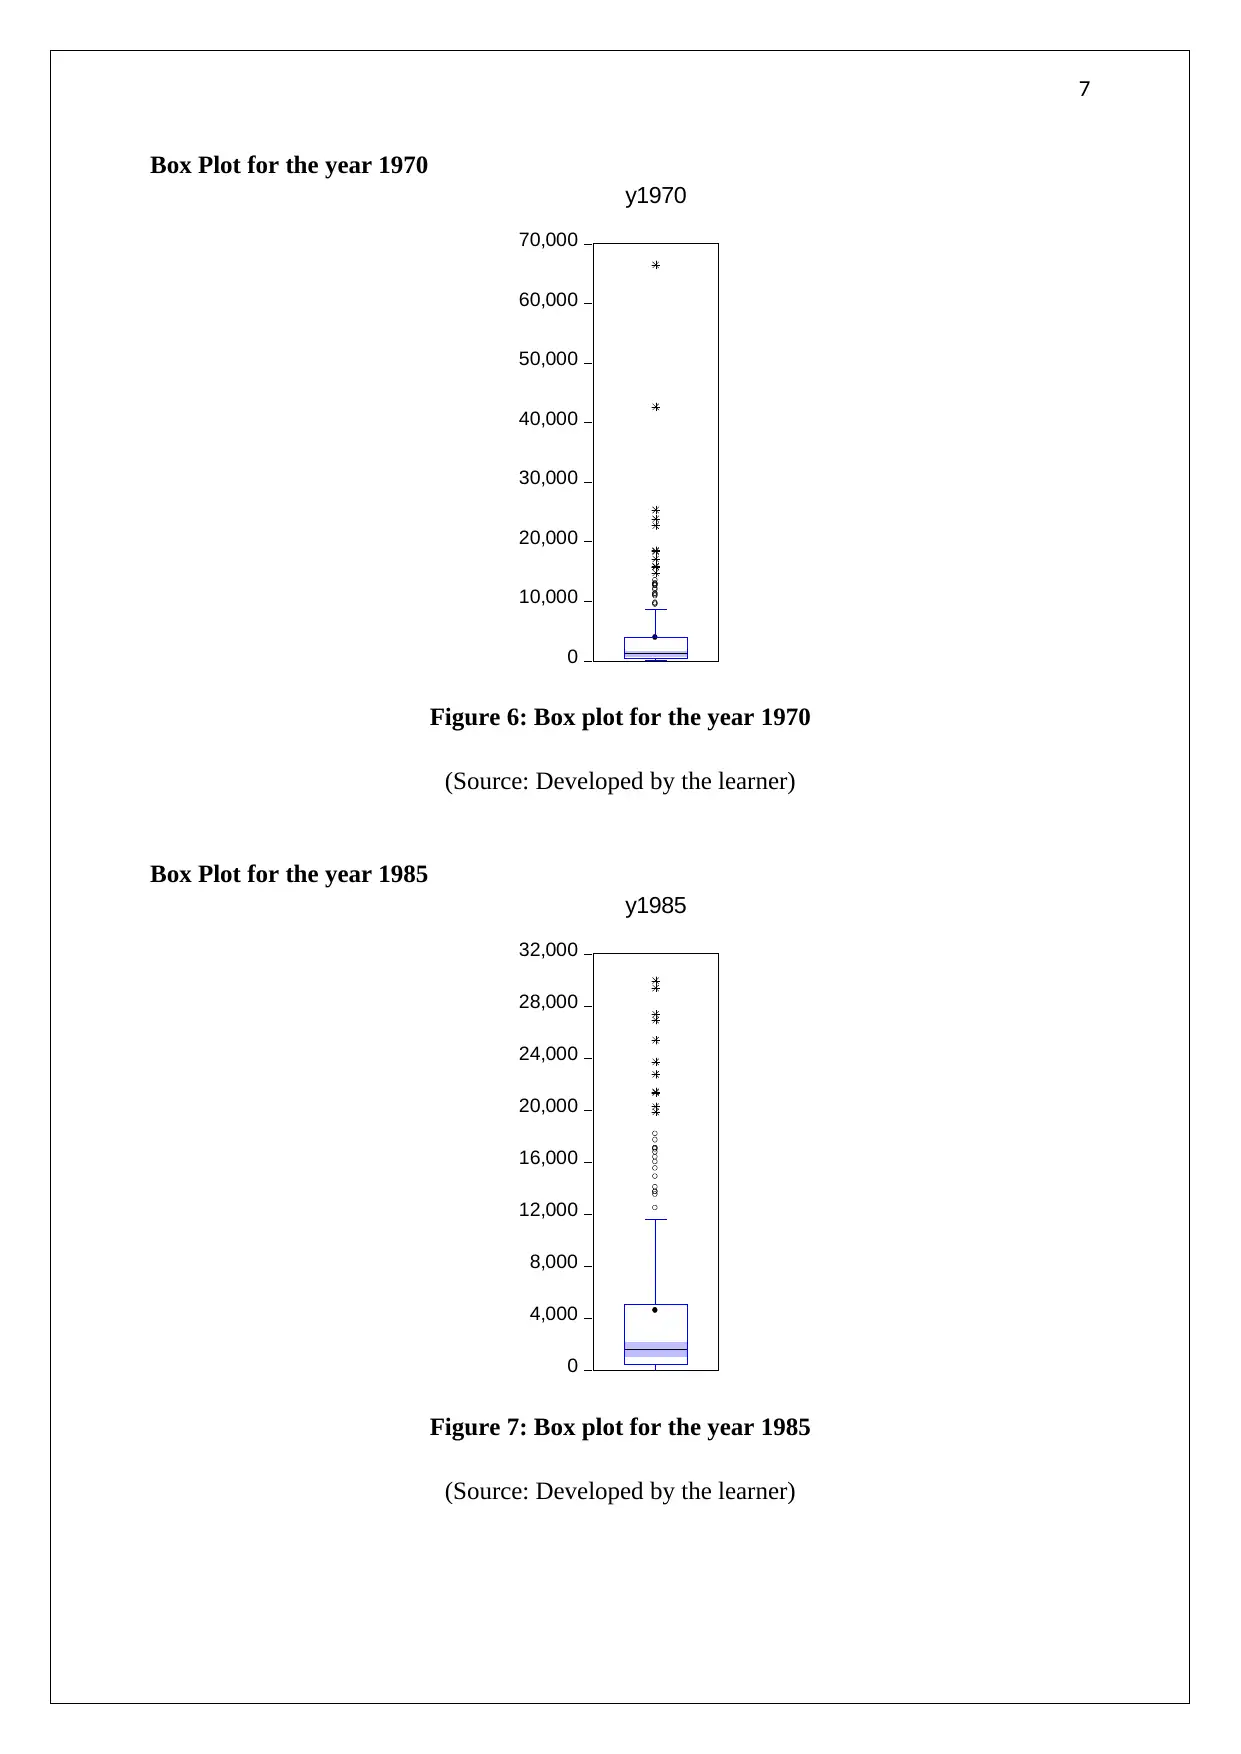
Figure 6: Box plot for the year 1970
(Source: Developed by the learner)
Box Plot for the year 1985
0
4,000
8,000
12,000
16,000
20,000
24,000
28,000
32,000
y1985
Figure 7: Box plot for the year 1985
(Source: Developed by the learner)
Box Plot for the year 1970
0
10,000
20,000
30,000
40,000
50,000
60,000
70,000
y1970
Figure 6: Box plot for the year 1970
(Source: Developed by the learner)
Box Plot for the year 1985
0
4,000
8,000
12,000
16,000
20,000
24,000
28,000
32,000
y1985
Figure 7: Box plot for the year 1985
(Source: Developed by the learner)
Paraphrase This Document
Need a fresh take? Get an instant paraphrase of this document with our AI Paraphraser
8
Box Plot for the year 2007
0
10,000
20,000
30,000
40,000
50,000
60,000
y2007
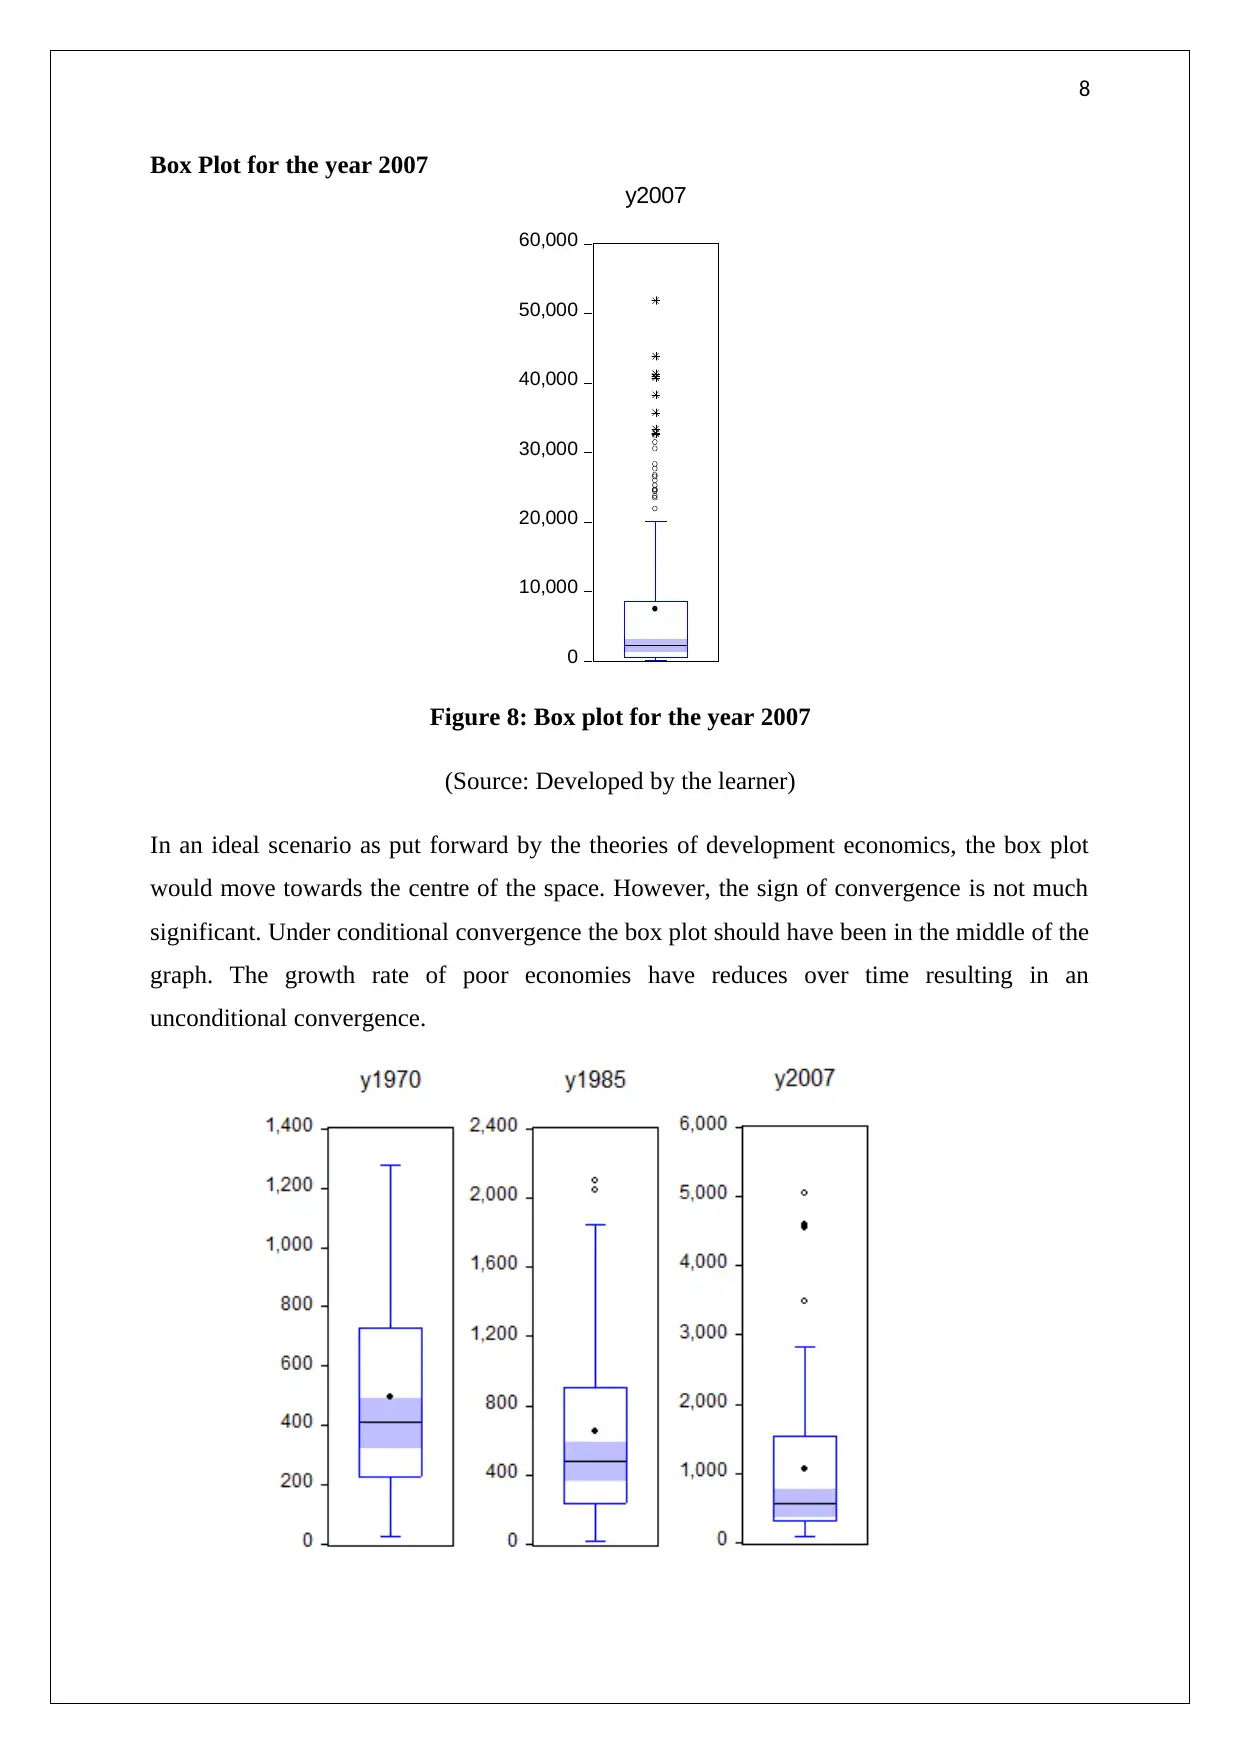
Figure 8: Box plot for the year 2007
(Source: Developed by the learner)
In an ideal scenario as put forward by the theories of development economics, the box plot
would move towards the centre of the space. However, the sign of convergence is not much
significant. Under conditional convergence the box plot should have been in the middle of the
graph. The growth rate of poor economies have reduces over time resulting in an
unconditional convergence.
Box Plot for the year 2007
0
10,000
20,000
30,000
40,000
50,000
60,000
y2007
Figure 8: Box plot for the year 2007
(Source: Developed by the learner)
In an ideal scenario as put forward by the theories of development economics, the box plot
would move towards the centre of the space. However, the sign of convergence is not much
significant. Under conditional convergence the box plot should have been in the middle of the
graph. The growth rate of poor economies have reduces over time resulting in an
unconditional convergence.
9
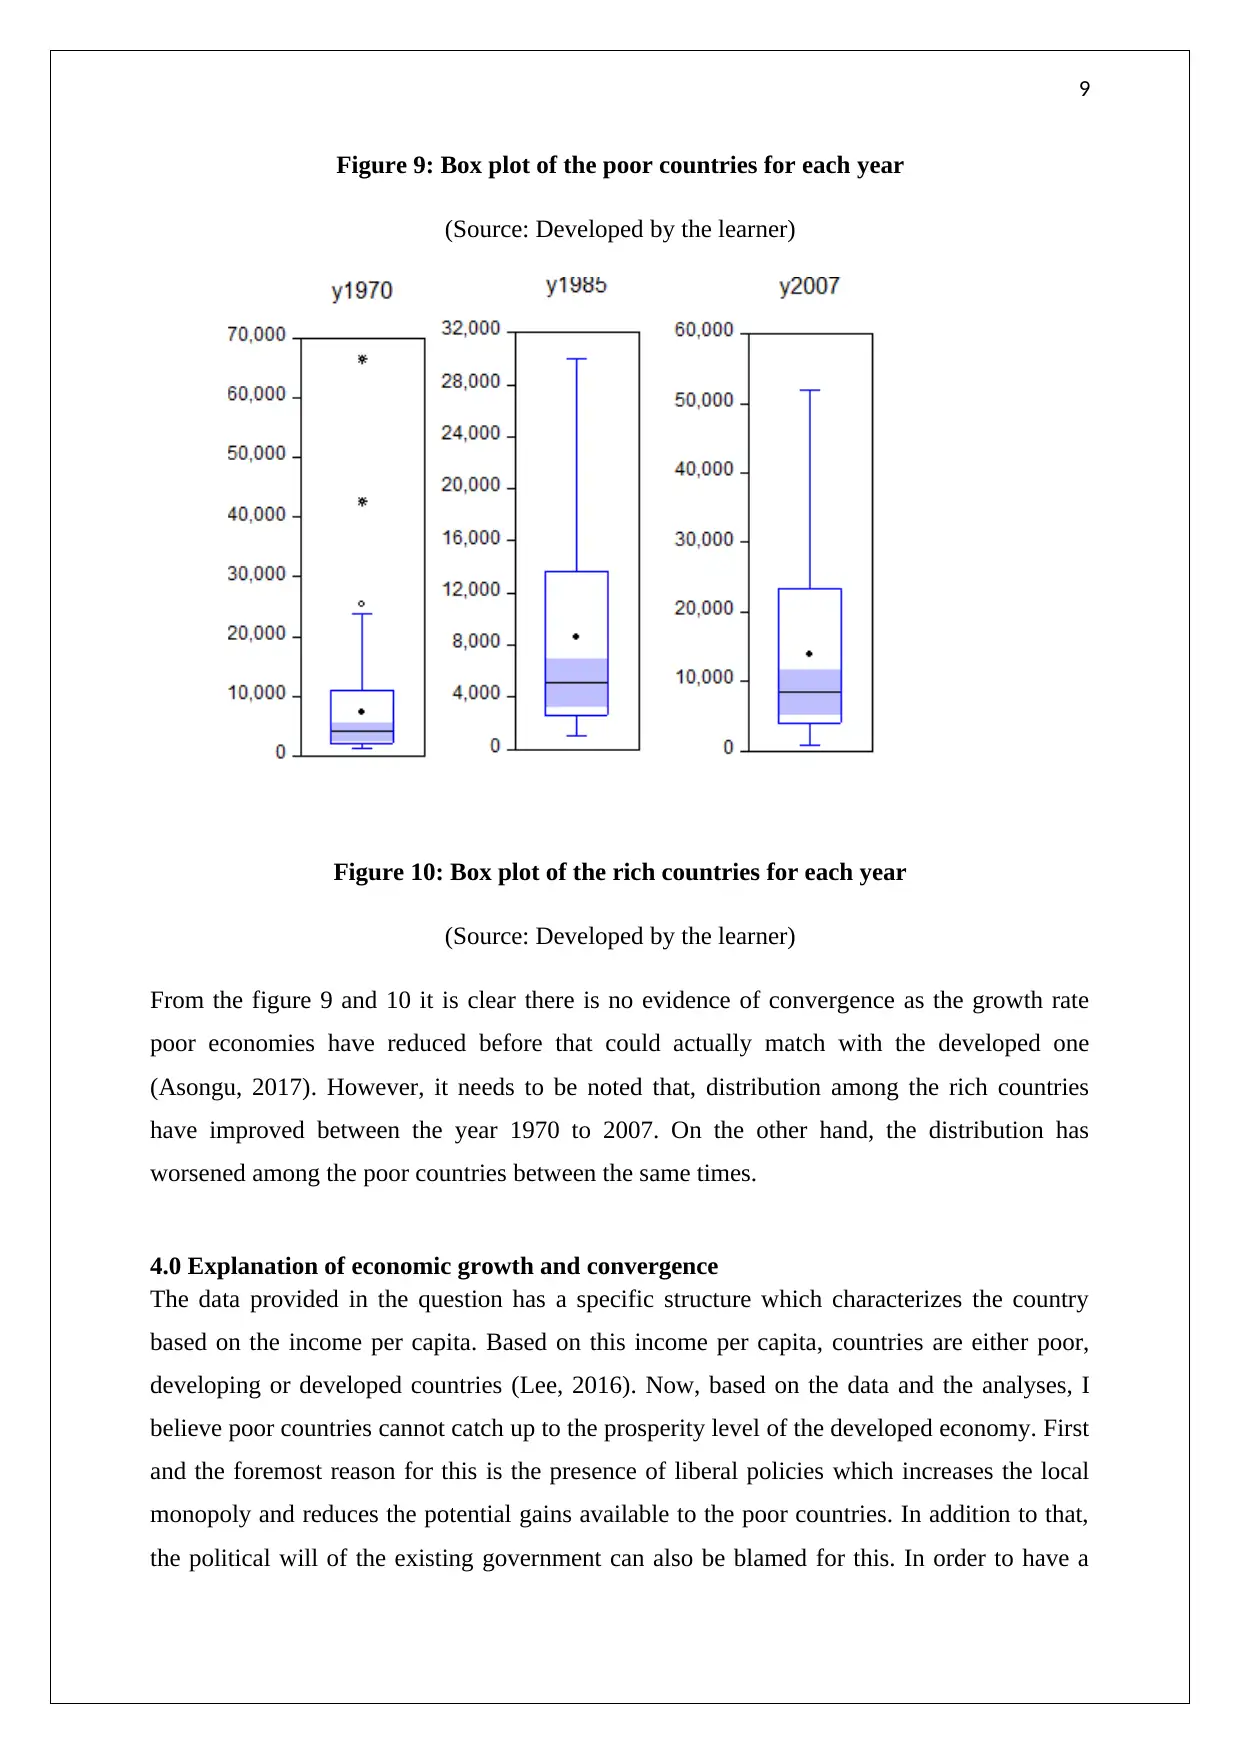
Figure 9: Box plot of the poor countries for each year
(Source: Developed by the learner)
Figure 10: Box plot of the rich countries for each year
(Source: Developed by the learner)
From the figure 9 and 10 it is clear there is no evidence of convergence as the growth rate
poor economies have reduced before that could actually match with the developed one
(Asongu, 2017). However, it needs to be noted that, distribution among the rich countries
have improved between the year 1970 to 2007. On the other hand, the distribution has
worsened among the poor countries between the same times.
4.0 Explanation of economic growth and convergence
The data provided in the question has a specific structure which characterizes the country
based on the income per capita. Based on this income per capita, countries are either poor,
developing or developed countries (Lee, 2016). Now, based on the data and the analyses, I
believe poor countries cannot catch up to the prosperity level of the developed economy. First
and the foremost reason for this is the presence of liberal policies which increases the local
monopoly and reduces the potential gains available to the poor countries. In addition to that,
the political will of the existing government can also be blamed for this. In order to have a
⊘ This is a preview!⊘
Do you want full access?
Subscribe today to unlock all pages.
Trusted by 1+ million students worldwide
10
conditional convergence, capital infusion in the economy needs to continue over the years.
However, most of the poor countries listed in the data set ranks higher in the corruption
perception index which becomes detrimental to the growth and development of the economy
(Yaya, Ling, Furuoka, Ezeoke & Jacob, 2019).
5.0 Conclusion
Therefore, on paper the different rate of economic growth will eventually make the poor
economies converge. However, an unconditional convergence set in where the growth of
economy reaches a saturation point. The data analysis done in this paper shows that, poor
countries, over the years have failed to show any sign of convergence. The distributions
worsened in all the parts of the world since the year 1970. In order to the theory to work,
individual interest or the operation of the corrupt government needs to be checked.
Paraphrase This Document
Need a fresh take? Get an instant paraphrase of this document with our AI Paraphraser
11
Reference
Asongu, S. A. (2017). Knowledge economy gaps, policy syndromes, and catch-up strategies:
Fresh South Korean lessons to Africa. Journal of the Knowledge Economy, 8(1), 211-
253.
Bleischwitz, R., Welfens, P., & Zhang, Z. (Eds.). (2017). Sustainable growth and resource
productivity: economic and global policy issues. Routledge.
Bücher, A., & Kojadinovic, I. (2018). A note on conditional versus joint unconditional weak
convergence in bootstrap consistency results. Journal of Theoretical Probability, 1-
21.
Kinfemichael, B., & Morshed, A. M. (2019). Unconditional convergence of labor
productivity in the service sector. Journal of Macroeconomics, 59, 217-229.
Lee, J. W. (2016). Korea's economic growth and catch‐up: Implications for China. China &
World Economy, 24(5), 71-97.
Li, K. W., Zhou, X., & Pan, Z. (2016). Cross-country output convergence and growth:
Evidence from varying coefficient nonparametric method. Economic Modelling, 55,
32-41.
Savoia, A., & Sen, K. (2016). Do we see convergence in institutions? A cross-country
analysis. The Journal of Development Studies, 52(2), 166-185.
Yaya, O. S., Ling, P. K., Furuoka, F., Ezeoke, C. M. R., & Jacob, R. I. (2019). Can West
African countries catch up with Nigeria? Evidence from smooth nonlinearity method
in fractional unit root framework. International Economics. 32(2), 135-142.
12
Appendix
1) The calculation of growth of per capita income
obs
y197
0
y198
5
y200
7
growth rate of GDP per
capita 1970-1985
growth rate of gdp per
capita 1985-2007
Afghanistan 162.5
169.9
8
211.9
4 4.603076923 24.68525709
Albania
1278.
17
1452.
49
2275.
92 13.63824843 56.69092386
Algeria
1379.
76
1975.
03
2291.
11 43.14301038 16.00380754
Angola
925.3
8
895.6
4
1790.
86 -3.213814865 99.95310616
Argentina
6621.
31
6085.
8
9006.
42 -8.087674493 47.99073252
Armenia
607.6
6
716.7
3
1285.
33 17.94918211 79.3325241
Australia
1190
5.44
1488
6.28
2368
2.51 25.03762986 59.08951061
Austria
1127
2.37
1706
0.16
2647
3.34 51.34492569 55.17638756
Azerbaijan
1295.
15
1589.
64
1766.
71 22.73790681 11.13900003
Bahamas
1351
5.1
1550
0.03
1829
3.74 14.68675777 18.0239006
Bahrain
1482
4.64
8748.
96
1660
4.11 -40.98365964 89.7838143
Bangladesh
270.5
6 237.8
441.8
8 -12.10821999 85.82001682
Barbados
6311.
98
7394.
03
1034
8.16 17.1427983 39.95290795
Belarus
853.9
4
1219.
54
2132.
79 42.81331241 74.88479263
Belgium
1119
0.76
1600
6.21
2458
7.88 43.03058952 53.61462832
Benin
317.6
2
339.9
3
384.2
1 7.024116869 13.02621128
Bermuda
2275
2.91
2995
6.82
4099
1.63 31.66148857 36.83571888
Bhutan 63.12
125.5
3
337.0
2 98.87515843 168.4776547
Bolivia
868.1
8
864.2
5
1139.
91 -0.452671105 31.89586347
BosniaHerzegovina
144.0
8
197.0
7
1417.
8 36.77817879 619.439793
Botswana
508.7
1
1799.
19
4573.
41 253.6769476 154.1927201
Brazil
1986.
82
3291.
3
4188.
57 65.6566775 27.26187221
Brunei
2385
9.87
2141
3.43
1721
7.42 -10.25336685 -19.59522599
Bulgaria
1138.
38
1559.
03
2399.
77 36.95163302 53.92712135
Burkina
165.4
3
206.9
9
257.5
2 25.12240827 24.41180733
Burma 79.2 124.8 309.6 57.62626263 148.0134572
⊘ This is a preview!⊘
Do you want full access?
Subscribe today to unlock all pages.
Trusted by 1+ million students worldwide
1 out of 18
Related Documents


Your All-in-One AI-Powered Toolkit for Academic Success.
+13062052269
info@desklib.com
Available 24*7 on WhatsApp / Email
![[object Object]](/_next/static/media/star-bottom.7253800d.svg)
Unlock your academic potential
Copyright © 2020–2026 A2Z Services. All Rights Reserved. Developed and managed by ZUCOL.