Economic Growth and Sustainable Development: Canada & Sri Lanka
VerifiedAdded on 2023/03/21
|24
|6829
|95
Essay
AI Summary
This essay examines economic growth and sustainable development by comparing Canada, a rich country, and Sri Lanka, a poor country. The introduction highlights the importance of economic growth and the disparities between developed and developing nations, setting the stage for an analysis using the Solow model. The essay delves into economic growth theory, emphasizing the roles of capital, population, technology, and education. It applies these theoretical insights to the chosen countries, presenting data on GDP and per capita GDP to illustrate the economic differences. The analysis includes an overview of the Solow and Malthusian models and discusses how factors like capital accumulation, population growth, and the quality of labor (health and education) influence economic performance. The essay concludes by offering policy recommendations for Sri Lanka, aiming to improve its economic performance and social welfare based on the findings from the data analysis and the economic models discussed. The essay uses data from 1998 to 2017 to compare the two countries' economic performance.

Running head: ECONOMIC GROWTH AND SUSTAINABLE DEVELOPMENT
Economic Growth and Sustainable Development
Name of the Student
Name of the University
Author Note
Economic Growth and Sustainable Development
Name of the Student
Name of the University
Author Note
Paraphrase This Document
Need a fresh take? Get an instant paraphrase of this document with our AI Paraphraser

1ECONOMIC GROWTH AND SUSTAINABLE DEVELOPMENT
Introduction
Economic growth is an important factor for development of a country. More the
economic growth better is the condition of a country as per standard economic theory. All the
countries thus try to achieve as much as growth to reach the maximum possible and
sustainable economic growth to become a rich economy. Many countries have already
achieved the rich status namely United States, France, Japan, Norway and many more.
However, many countries are yet poor and trying hard to become economically balanced and
rich. Contrariwise, every country grows with a certain rate and it is quite natural to think that
a rich country has every advantage to grow and become richer which might not be the case
with a poor country. In Solow model of economic growth theory, it is however argued that a
poor (developing) country can catch up with a rich (developed) country in the long run under
certain circumstances. Thus, in this essay two countries one rich and one poor is considered
to examine how a poor country grows and catch up with the rich country.
Figure 1: GDP per capita (US $)
Source: (Created by the Author)
1998 1999 2000 2001 2002 2003 2004 2005 2006 2007 2008 2009 2010 2011 2012 2013 2014 2015 2016 2017
0
10000
20000
30000
40000
50000
60000
GDP per capita (US $)
Canada Sri Lanka
2ECONOMIC GROWTH AND SUSTAINABLE DEVELOPMENT
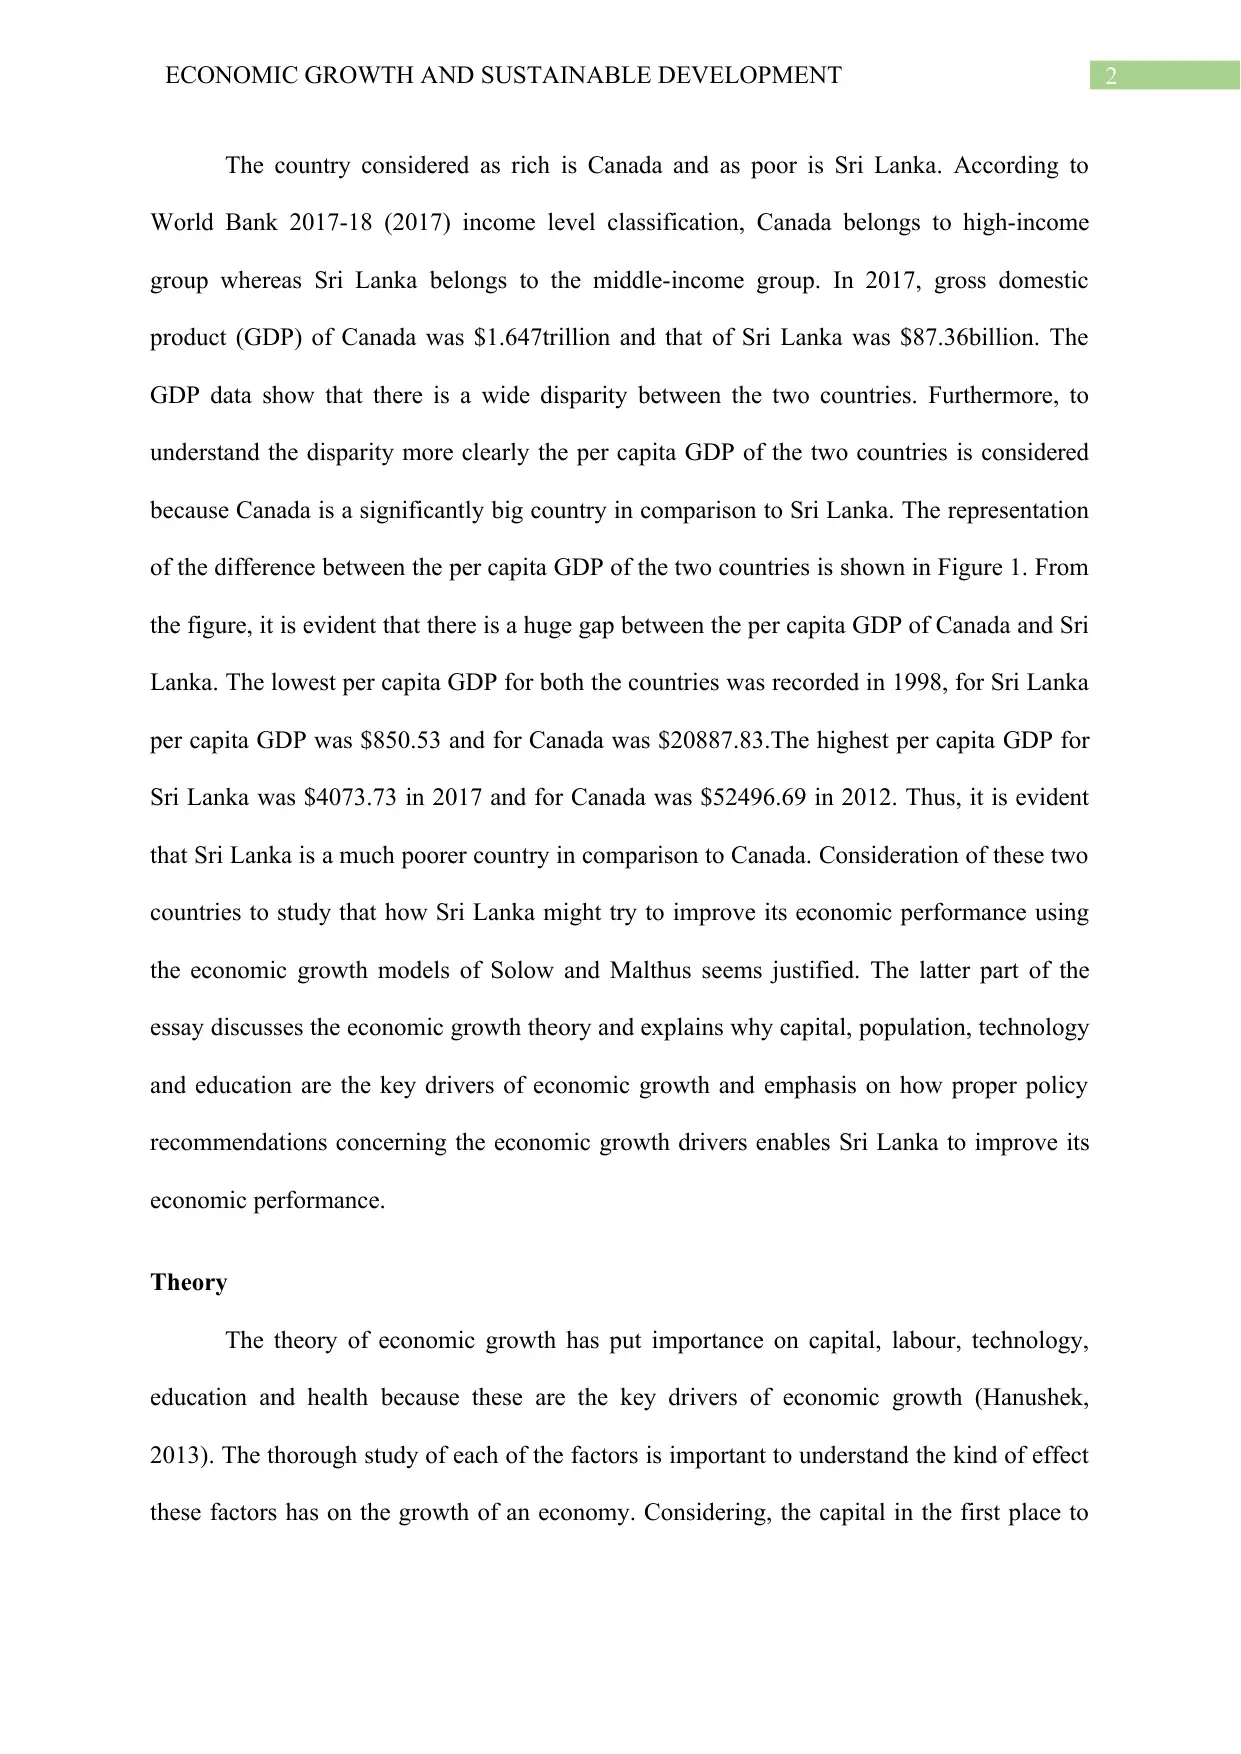
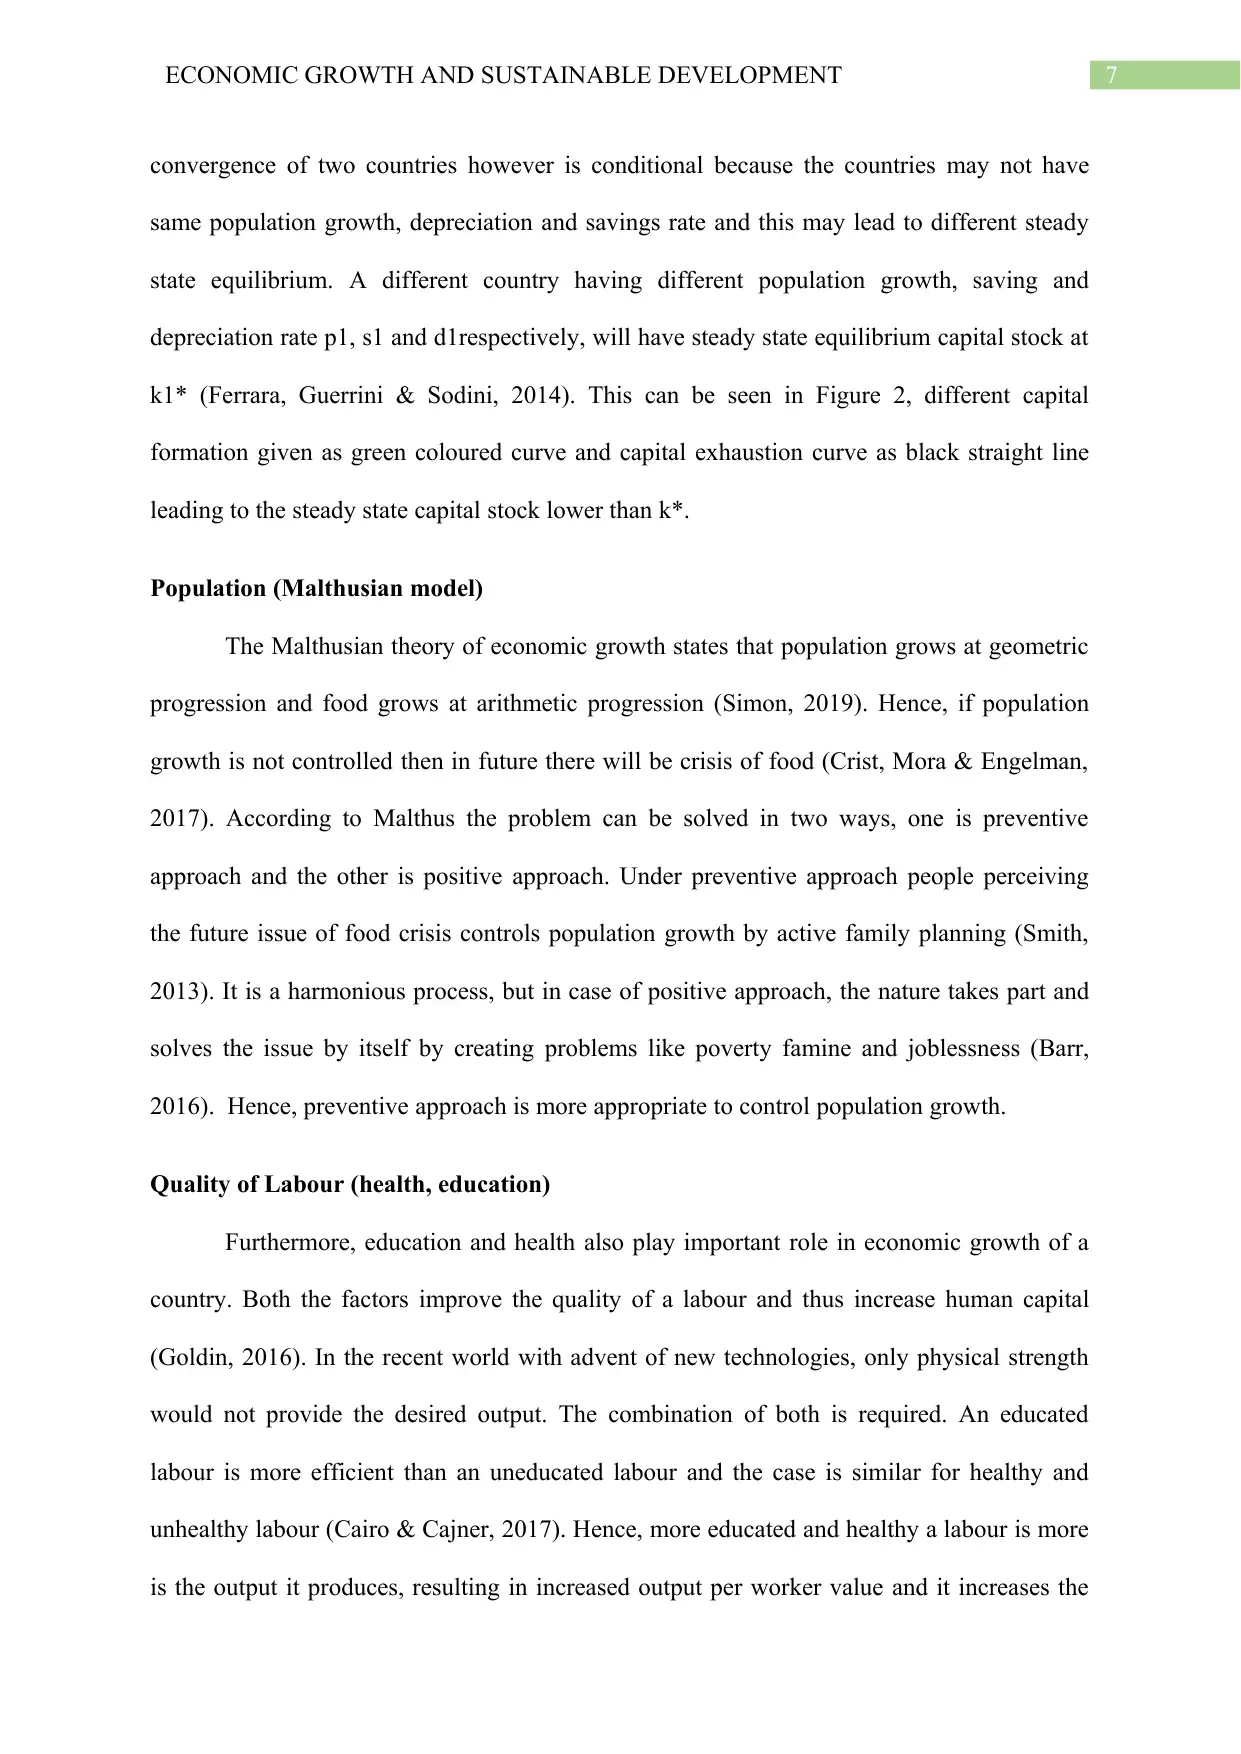
The country considered as rich is Canada and as poor is Sri Lanka. According to
World Bank 2017-18 (2017) income level classification, Canada belongs to high-income
group whereas Sri Lanka belongs to the middle-income group. In 2017, gross domestic
product (GDP) of Canada was $1.647trillion and that of Sri Lanka was $87.36billion. The
GDP data show that there is a wide disparity between the two countries. Furthermore, to
understand the disparity more clearly the per capita GDP of the two countries is considered
because Canada is a significantly big country in comparison to Sri Lanka. The representation
of the difference between the per capita GDP of the two countries is shown in Figure 1. From
the figure, it is evident that there is a huge gap between the per capita GDP of Canada and Sri
Lanka. The lowest per capita GDP for both the countries was recorded in 1998, for Sri Lanka
per capita GDP was $850.53 and for Canada was $20887.83.The highest per capita GDP for
Sri Lanka was $4073.73 in 2017 and for Canada was $52496.69 in 2012. Thus, it is evident
that Sri Lanka is a much poorer country in comparison to Canada. Consideration of these two
countries to study that how Sri Lanka might try to improve its economic performance using
the economic growth models of Solow and Malthus seems justified. The latter part of the
essay discusses the economic growth theory and explains why capital, population, technology
and education are the key drivers of economic growth and emphasis on how proper policy
recommendations concerning the economic growth drivers enables Sri Lanka to improve its
economic performance.
Theory
The theory of economic growth has put importance on capital, labour, technology,
education and health because these are the key drivers of economic growth (Hanushek,
2013). The thorough study of each of the factors is important to understand the kind of effect
these factors has on the growth of an economy. Considering, the capital in the first place to
⊘ This is a preview!⊘
Do you want full access?
Subscribe today to unlock all pages.
Trusted by 1+ million students worldwide
3ECONOMIC GROWTH AND SUSTAINABLE DEVELOPMENT
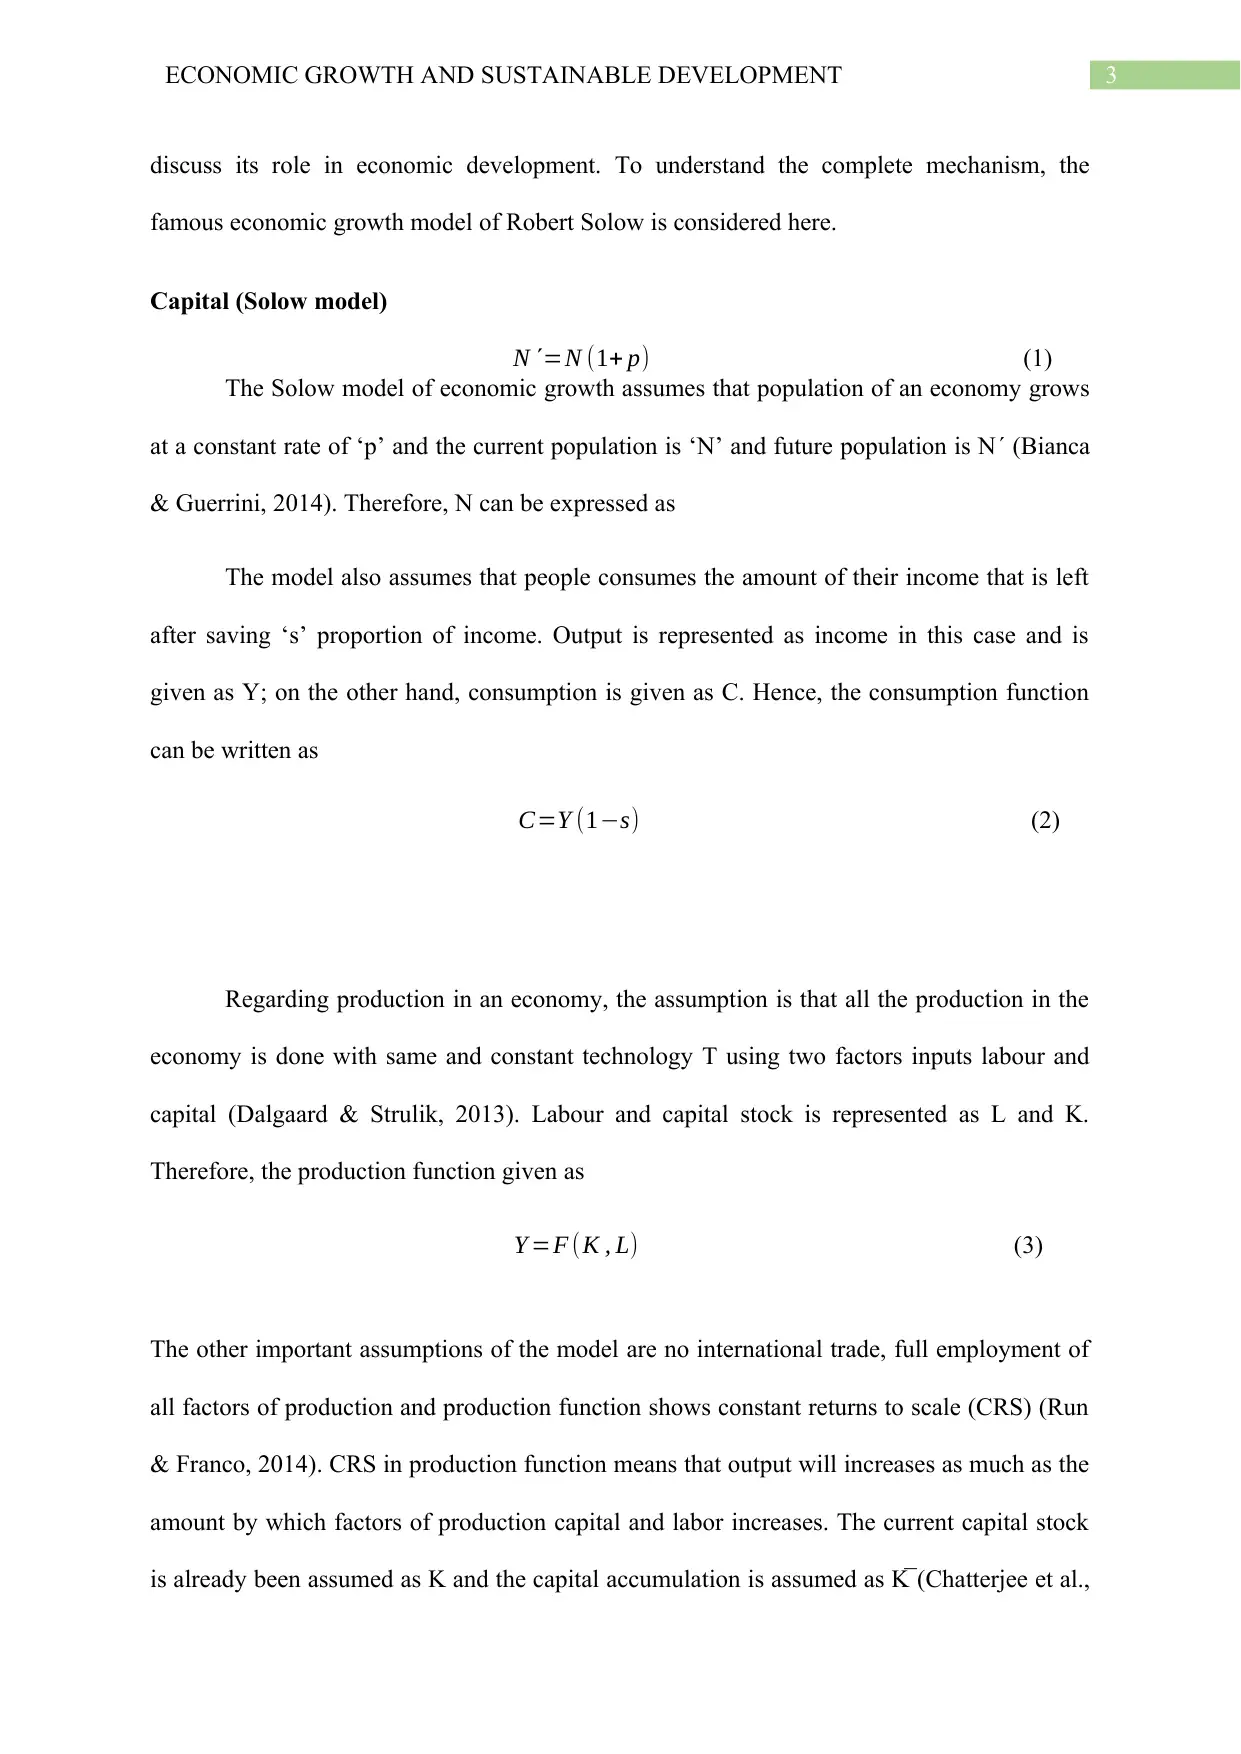
discuss its role in economic development. To understand the complete mechanism, the
famous economic growth model of Robert Solow is considered here.
Capital (Solow model)
N ΄=N (1+ p) (1)
The Solow model of economic growth assumes that population of an economy grows
at a constant rate of ‘p’ and the current population is ‘N’ and future population is N΄ (Bianca
& Guerrini, 2014). Therefore, N can be expressed as
The model also assumes that people consumes the amount of their income that is left
after saving ‘s’ proportion of income. Output is represented as income in this case and is
given as Y; on the other hand, consumption is given as C. Hence, the consumption function
can be written as
Regarding production in an economy, the assumption is that all the production in the
economy is done with same and constant technology T using two factors inputs labour and
capital (Dalgaard & Strulik, 2013). Labour and capital stock is represented as L and K.
Therefore, the production function given as
Y =F (K , L) (3)
The other important assumptions of the model are no international trade, full employment of
all factors of production and production function shows constant returns to scale (CRS) (Run
& Franco, 2014). CRS in production function means that output will increases as much as the
amount by which factors of production capital and labor increases. The current capital stock
is already been assumed as K and the capital accumulation is assumed as K̅ (Chatterjee et al.,
C=Y (1−s) (2)
Paraphrase This Document
Need a fresh take? Get an instant paraphrase of this document with our AI Paraphraser
4ECONOMIC GROWTH AND SUSTAINABLE DEVELOPMENT
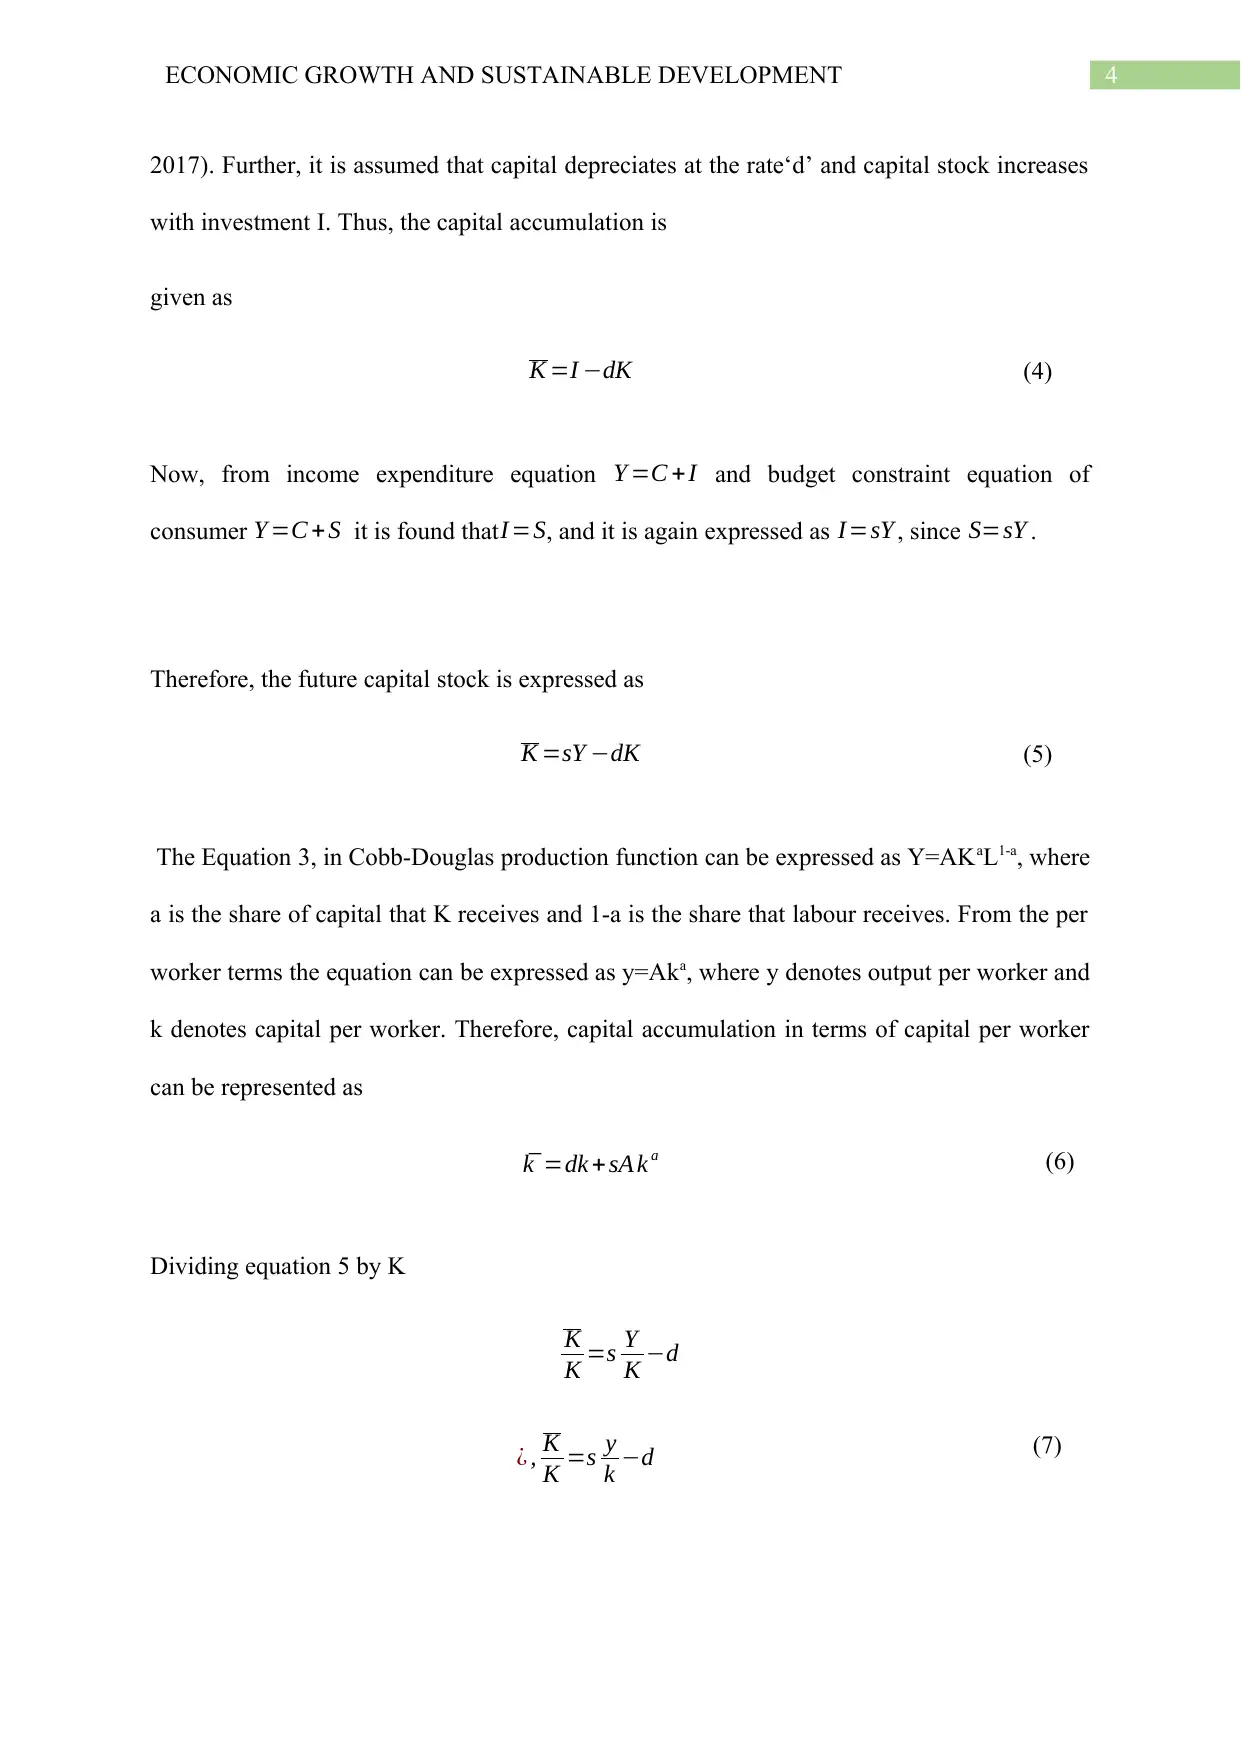
2017). Further, it is assumed that capital depreciates at the rate‘d’ and capital stock increases
with investment I. Thus, the capital accumulation is
given as
K =I −dK (4)
Now, from income expenditure equation Y =C +I and budget constraint equation of
consumer Y =C + S it is found thatI =S, and it is again expressed as I=sY , since S=sY .
Therefore, the future capital stock is expressed as
K =sY −dK (5)
The Equation 3, in Cobb-Douglas production function can be expressed as Y=AKaL1-a, where
a is the share of capital that K receives and 1-a is the share that labour receives. From the per
worker terms the equation can be expressed as y=Aka, where y denotes output per worker and
k denotes capital per worker. Therefore, capital accumulation in terms of capital per worker
can be represented as
k̅ =dk + sA k a (6)
Dividing equation 5 by K
K
K =s Y
K −d
¿ , K
K =s y
k −d (7)
5ECONOMIC GROWTH AND SUSTAINABLE DEVELOPMENT
¿ , K
K =s
Y
L
K
L
−d
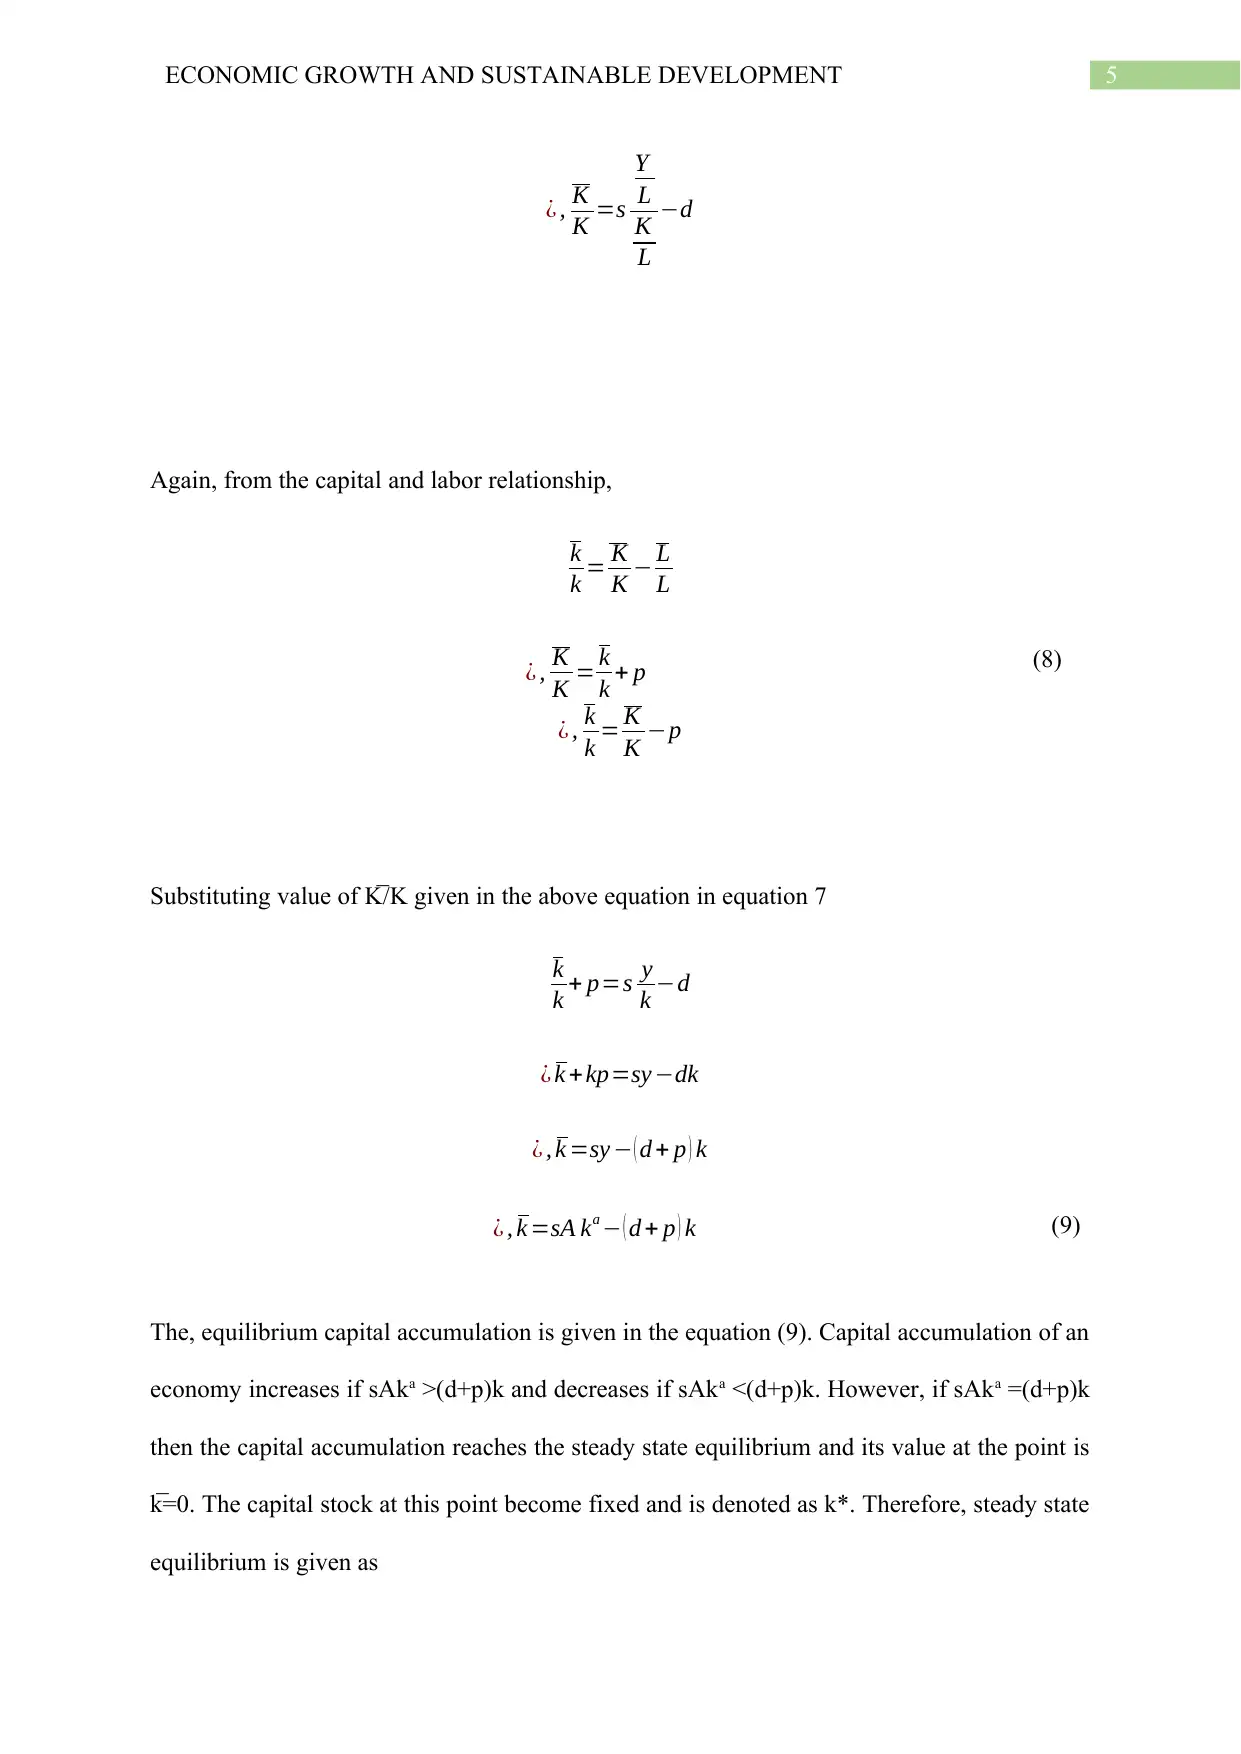
Again, from the capital and labor relationship,
k
k = K
K − L
L
¿ , K
K = k
k + p (8)
¿ , k
k = K
K −p
Substituting value of K̅ /K given in the above equation in equation 7
k
k + p=s y
k −d
¿ k + kp=sy −dk
¿ , k =sy − ( d + p ) k
¿ , k =sA ka − ( d + p ) k (9)
The, equilibrium capital accumulation is given in the equation (9). Capital accumulation of an
economy increases if sAka >(d+p)k and decreases if sAka <(d+p)k. However, if sAka =(d+p)k
then the capital accumulation reaches the steady state equilibrium and its value at the point is
k̅=0. The capital stock at this point become fixed and is denoted as k*. Therefore, steady state
equilibrium is given as
¿ , K
K =s
Y
L
K
L
−d
Again, from the capital and labor relationship,
k
k = K
K − L
L
¿ , K
K = k
k + p (8)
¿ , k
k = K
K −p
Substituting value of K̅ /K given in the above equation in equation 7
k
k + p=s y
k −d
¿ k + kp=sy −dk
¿ , k =sy − ( d + p ) k
¿ , k =sA ka − ( d + p ) k (9)
The, equilibrium capital accumulation is given in the equation (9). Capital accumulation of an
economy increases if sAka >(d+p)k and decreases if sAka <(d+p)k. However, if sAka =(d+p)k
then the capital accumulation reaches the steady state equilibrium and its value at the point is
k̅=0. The capital stock at this point become fixed and is denoted as k*. Therefore, steady state
equilibrium is given as
⊘ This is a preview!⊘
Do you want full access?
Subscribe today to unlock all pages.
Trusted by 1+ million students worldwide
6ECONOMIC GROWTH AND SUSTAINABLE DEVELOPMENT
sA k a− ( d + p ) k =0
¿ , sA ka = ( d + p ) k
¿ , sA
(d + p) =k1−a
¿ , k∗¿( sA
d + p )
1
1−a Steady state
equilibrium
capital stock
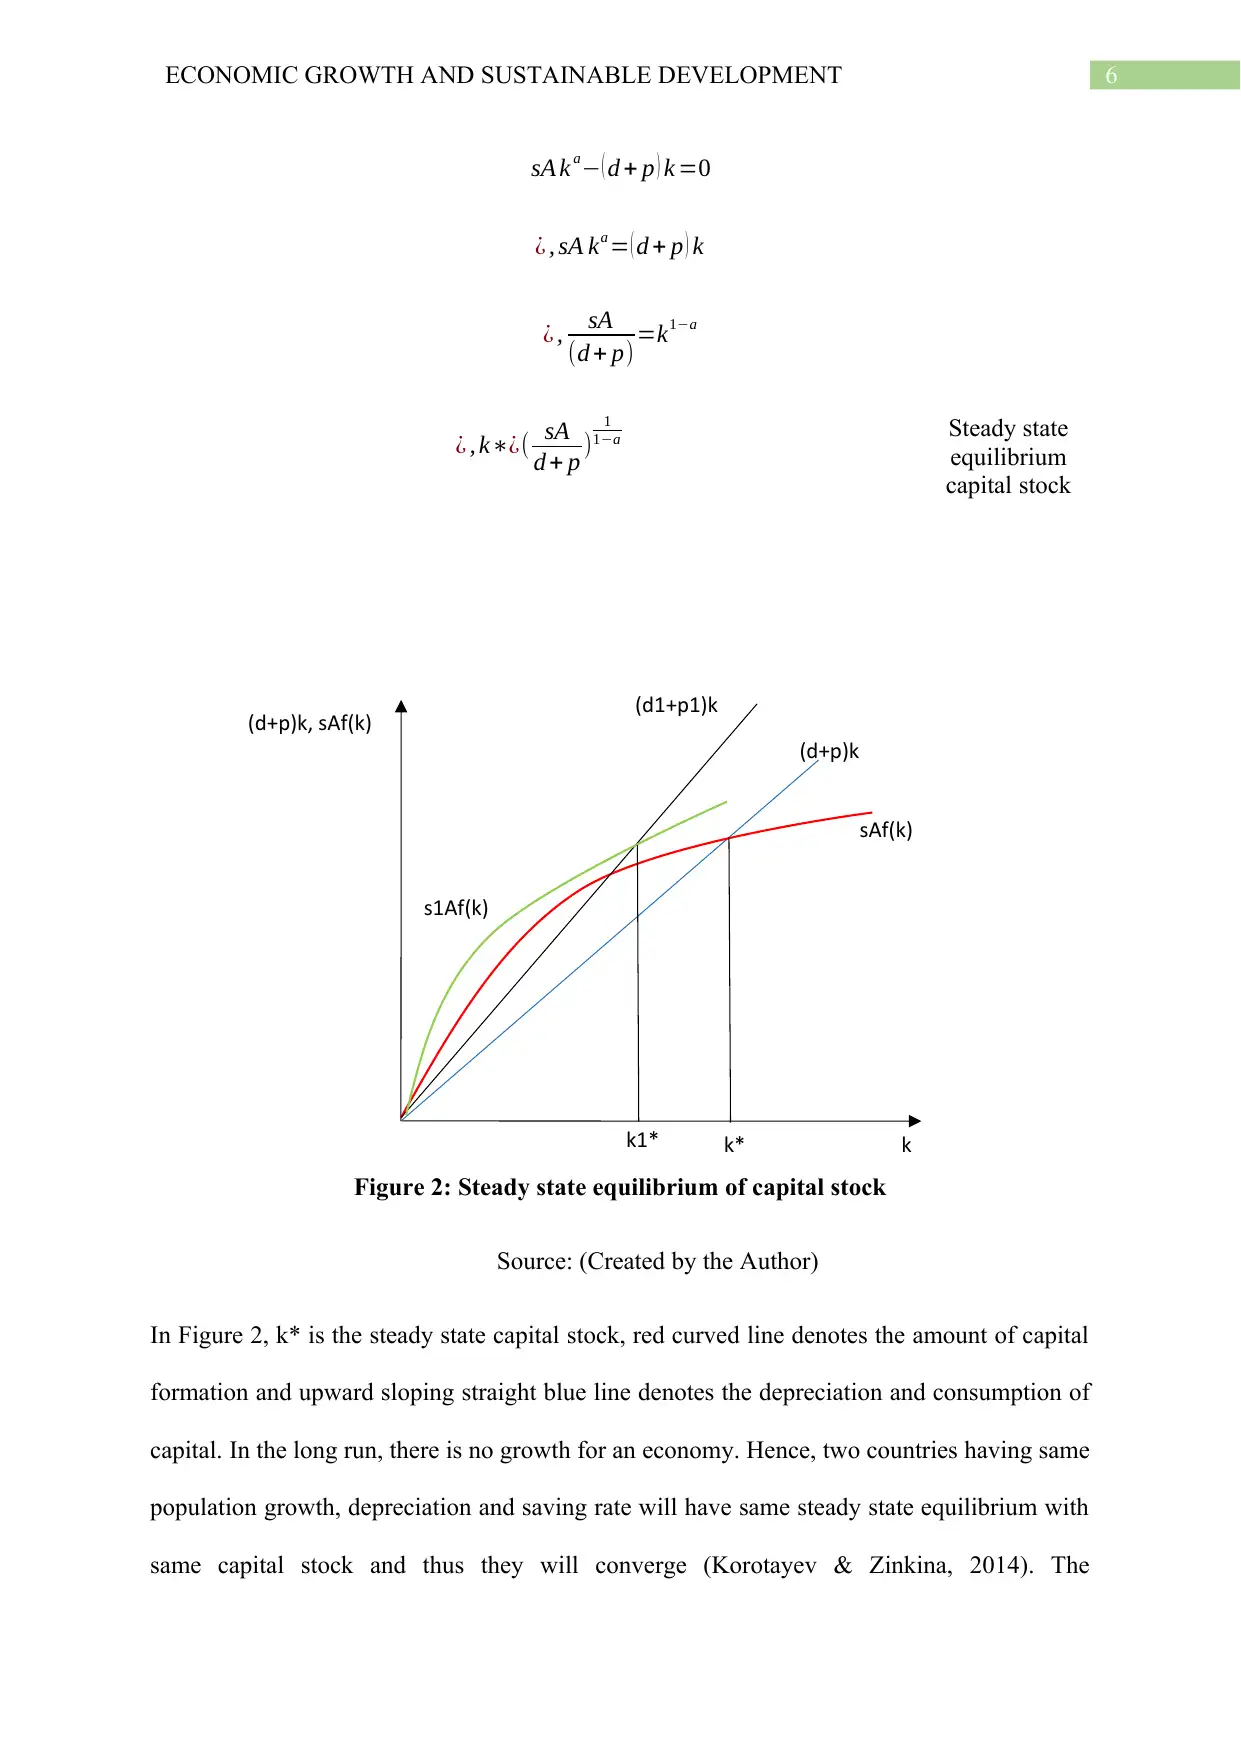
Figure 2: Steady state equilibrium of capital stock
Source: (Created by the Author)
In Figure 2, k* is the steady state capital stock, red curved line denotes the amount of capital
formation and upward sloping straight blue line denotes the depreciation and consumption of
capital. In the long run, there is no growth for an economy. Hence, two countries having same
population growth, depreciation and saving rate will have same steady state equilibrium with
same capital stock and thus they will converge (Korotayev & Zinkina, 2014). The
k1*
s1Af(k)
(d1+p1)k
(d+p)k, sAf(k)
(d+p)k
sAf(k)
kk*
sA k a− ( d + p ) k =0
¿ , sA ka = ( d + p ) k
¿ , sA
(d + p) =k1−a
¿ , k∗¿( sA
d + p )
1
1−a Steady state
equilibrium
capital stock
Figure 2: Steady state equilibrium of capital stock
Source: (Created by the Author)
In Figure 2, k* is the steady state capital stock, red curved line denotes the amount of capital
formation and upward sloping straight blue line denotes the depreciation and consumption of
capital. In the long run, there is no growth for an economy. Hence, two countries having same
population growth, depreciation and saving rate will have same steady state equilibrium with
same capital stock and thus they will converge (Korotayev & Zinkina, 2014). The
k1*
s1Af(k)
(d1+p1)k
(d+p)k, sAf(k)
(d+p)k
sAf(k)
kk*
Paraphrase This Document
Need a fresh take? Get an instant paraphrase of this document with our AI Paraphraser
7ECONOMIC GROWTH AND SUSTAINABLE DEVELOPMENT
convergence of two countries however is conditional because the countries may not have
same population growth, depreciation and savings rate and this may lead to different steady
state equilibrium. A different country having different population growth, saving and
depreciation rate p1, s1 and d1respectively, will have steady state equilibrium capital stock at
k1* (Ferrara, Guerrini & Sodini, 2014). This can be seen in Figure 2, different capital
formation given as green coloured curve and capital exhaustion curve as black straight line
leading to the steady state capital stock lower than k*.
Population (Malthusian model)
The Malthusian theory of economic growth states that population grows at geometric
progression and food grows at arithmetic progression (Simon, 2019). Hence, if population
growth is not controlled then in future there will be crisis of food (Crist, Mora & Engelman,
2017). According to Malthus the problem can be solved in two ways, one is preventive
approach and the other is positive approach. Under preventive approach people perceiving
the future issue of food crisis controls population growth by active family planning (Smith,
2013). It is a harmonious process, but in case of positive approach, the nature takes part and
solves the issue by itself by creating problems like poverty famine and joblessness (Barr,
2016). Hence, preventive approach is more appropriate to control population growth.
Quality of Labour (health, education)
Furthermore, education and health also play important role in economic growth of a
country. Both the factors improve the quality of a labour and thus increase human capital
(Goldin, 2016). In the recent world with advent of new technologies, only physical strength
would not provide the desired output. The combination of both is required. An educated
labour is more efficient than an uneducated labour and the case is similar for healthy and
unhealthy labour (Cairo & Cajner, 2017). Hence, more educated and healthy a labour is more
is the output it produces, resulting in increased output per worker value and it increases the

8ECONOMIC GROWTH AND SUSTAINABLE DEVELOPMENT
value of capital per worker ratio too. Hence, to improve economic growth of a country
education and health must be prioritized.
Technology
Technology is also an important contributor of economic growth because sit increase
the productivity of workers and improves working conditions that enables workers to work
for longer hours (Rodrik, 2014). Output produced per unit of capital-invested, improves with
new and improved technology. Thus, improvement is technology is always welcome, but too
fast innovation on the other hand increases cost of production as upgrading technology
frequently involves huge cost and no country would want to do that (Oyelola et al., 2013) .
Hence, technology change at a certain gap is positive factor for economic growth.
Governance and openness
The other factors that influence economic growth are good governance. The
management of resources and controlling the factors of economic growth requires feasible
and effective policies (Rondinelli, 2013). Hence, good governance is required to formulate
such policies. Both the countries concerned here are open economies hence comparative
advantage is there for both of them (Uy, Yi & Zhang, 2013). In the age of globalization being
open is a boon as accessibility to new technology and bigger market. Hence, openness helps
an economy to grow faster.
Application
In this essay, Canada is considered as the rich country and Sri Lanka is considered as
the poor country, the justification of such an assumption can be known from the value of
GDP of both the countries shown in Figure 3.
⊘ This is a preview!⊘
Do you want full access?
Subscribe today to unlock all pages.
Trusted by 1+ million students worldwide
9ECONOMIC GROWTH AND SUSTAINABLE DEVELOPMENT
Figure
3: GDP of
Canada and Sri
Lanka
Source:
(Created by the
Author)
The
growth theory of economics that is discussed in the previous section provides the notion that
it is possible for poor country to become rich and catch up with the rich developed country.
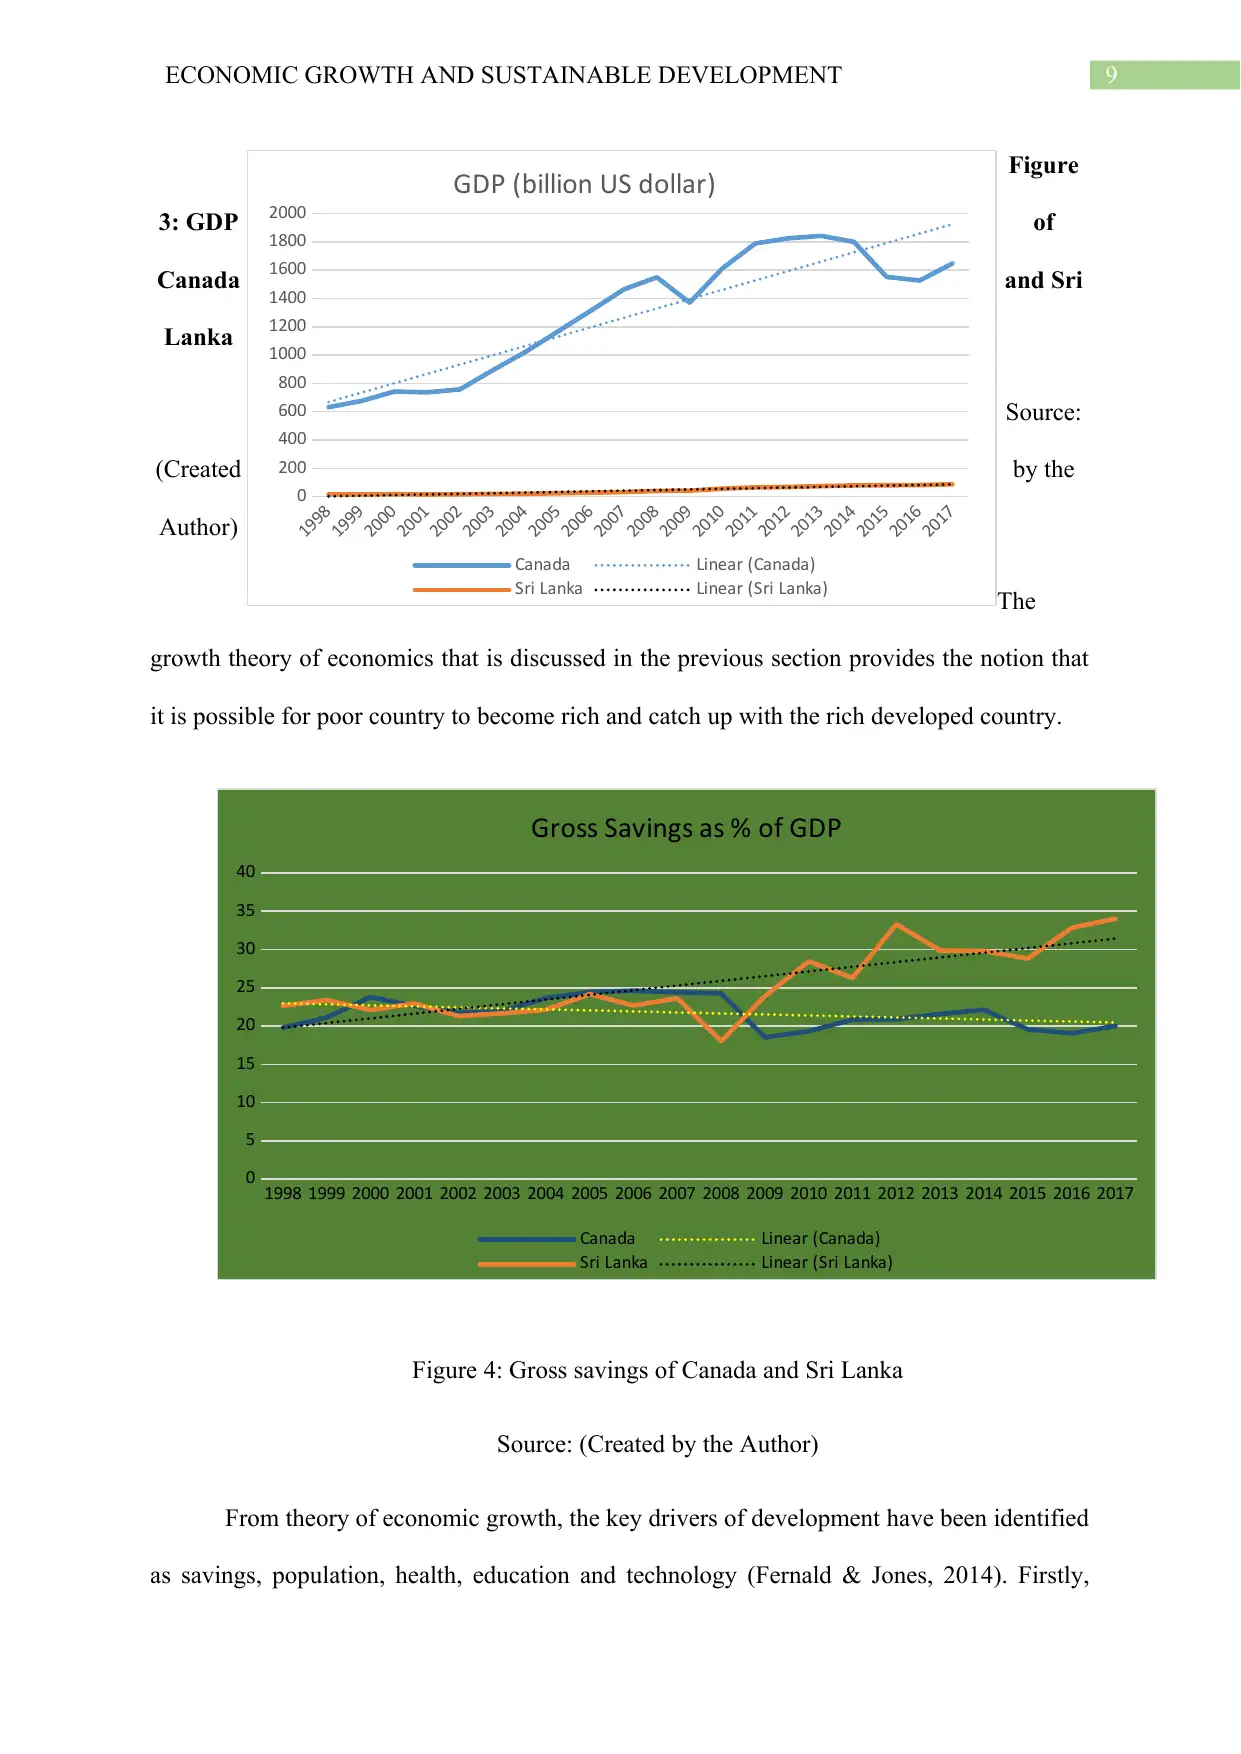
Figure 4: Gross savings of Canada and Sri Lanka
Source: (Created by the Author)
From theory of economic growth, the key drivers of development have been identified
as savings, population, health, education and technology (Fernald & Jones, 2014). Firstly,
1998
1999
2000
2001
2002
2003
2004
2005
2006
2007
2008
2009
2010
2011
2012
2013
2014
2015
2016
2017
0
200
400
600
800
1000
1200
1400
1600
1800
2000
GDP (billion US dollar)
Canada Linear (Canada)
Sri Lanka Linear (Sri Lanka)
1998 1999 2000 2001 2002 2003 2004 2005 2006 2007 2008 2009 2010 2011 2012 2013 2014 2015 2016 2017
0
5
10
15
20
25
30
35
40
Gross Savings as % of GDP
Canada Linear (Canada)
Sri Lanka Linear (Sri Lanka)
Figure
3: GDP of
Canada and Sri
Lanka
Source:
(Created by the
Author)
The
growth theory of economics that is discussed in the previous section provides the notion that
it is possible for poor country to become rich and catch up with the rich developed country.
Figure 4: Gross savings of Canada and Sri Lanka
Source: (Created by the Author)
From theory of economic growth, the key drivers of development have been identified
as savings, population, health, education and technology (Fernald & Jones, 2014). Firstly,
1998
1999
2000
2001
2002
2003
2004
2005
2006
2007
2008
2009
2010
2011
2012
2013
2014
2015
2016
2017
0
200
400
600
800
1000
1200
1400
1600
1800
2000
GDP (billion US dollar)
Canada Linear (Canada)
Sri Lanka Linear (Sri Lanka)
1998 1999 2000 2001 2002 2003 2004 2005 2006 2007 2008 2009 2010 2011 2012 2013 2014 2015 2016 2017
0
5
10
15
20
25
30
35
40
Gross Savings as % of GDP
Canada Linear (Canada)
Sri Lanka Linear (Sri Lanka)
Paraphrase This Document
Need a fresh take? Get an instant paraphrase of this document with our AI Paraphraser
10ECONOMIC GROWTH AND SUSTAINABLE DEVELOPMENT
considering Solow model to discuss the possibility of Sri Lanka to be on the path of
economic development and catch up with Canada in the long run. The key factors of Solow
model are savings, population growth, total output or GDP and depreciation (Shapirov,2015).
Figure 4 depicts the gross savings as percent of GDP of Canada and Sri Lanka for 20 years.
In
the figure, it can be seen that in the initial years the savings rate of both the countries grew
nearly at the same rate until 2009. From 2010 savings rate of Canada started to fall while for
Sri Lanka, it started to rise and the gap between the two only kept on increasing with every
passing year. In 2017, gross savings rate of Canada was just over 20% and of Sri Lanka it
was barely over 34% of the total GDP of the country in the corresponding year. Hence,
savings rate of Sri Lanka is significantly higher than Canada and it definitely contributes in
the capital accumulation more effectively than Canada. Therefore, given the other factors
constant Sri Lanka will definitely improve its economy and catch up with Canada.
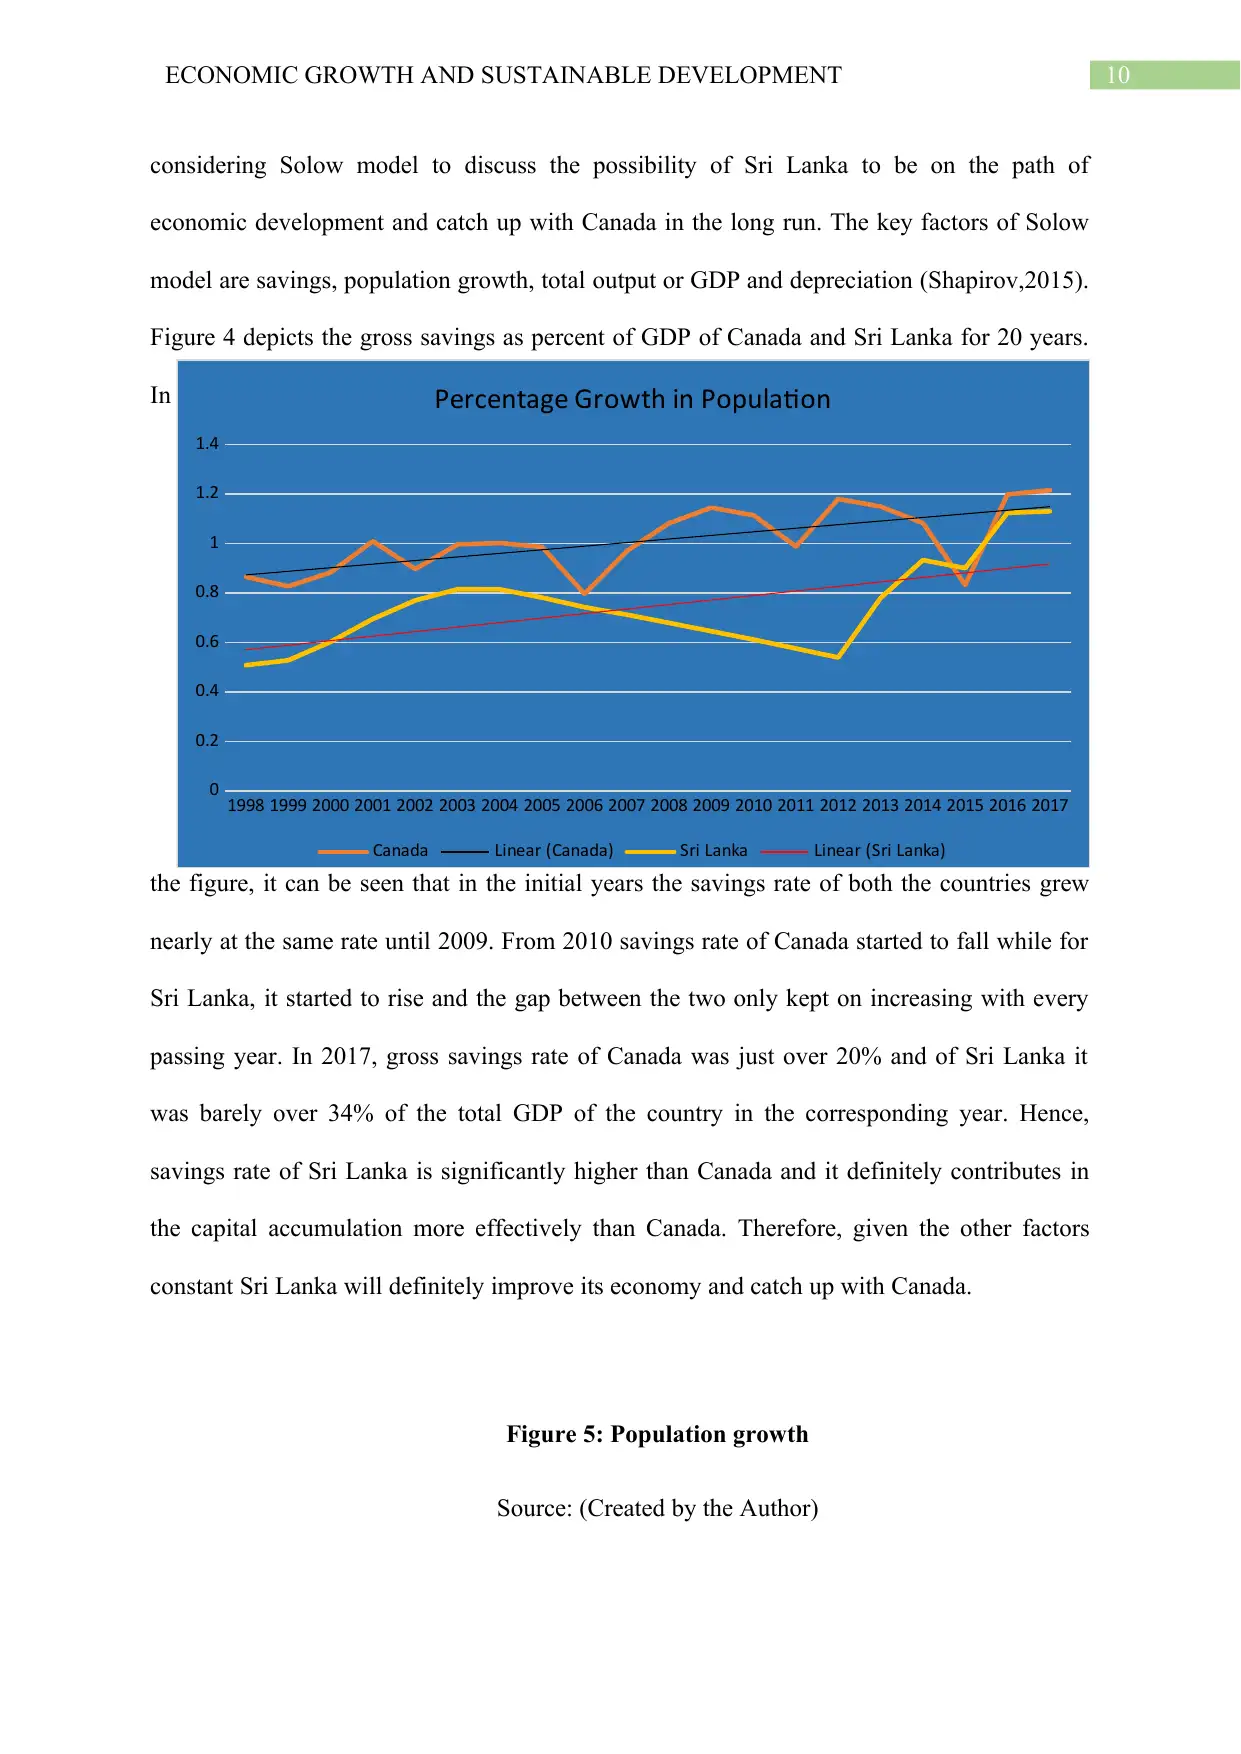
Figure 5: Population growth
Source: (Created by the Author)
1998 1999 2000 2001 2002 2003 2004 2005 2006 2007 2008 2009 2010 2011 2012 2013 2014 2015 2016 2017
0
0.2
0.4
0.6
0.8
1
1.2
1.4
Percentage Growth in Population
Canada Linear (Canada) Sri Lanka Linear (Sri Lanka)
considering Solow model to discuss the possibility of Sri Lanka to be on the path of
economic development and catch up with Canada in the long run. The key factors of Solow
model are savings, population growth, total output or GDP and depreciation (Shapirov,2015).
Figure 4 depicts the gross savings as percent of GDP of Canada and Sri Lanka for 20 years.
In
the figure, it can be seen that in the initial years the savings rate of both the countries grew
nearly at the same rate until 2009. From 2010 savings rate of Canada started to fall while for
Sri Lanka, it started to rise and the gap between the two only kept on increasing with every
passing year. In 2017, gross savings rate of Canada was just over 20% and of Sri Lanka it
was barely over 34% of the total GDP of the country in the corresponding year. Hence,
savings rate of Sri Lanka is significantly higher than Canada and it definitely contributes in
the capital accumulation more effectively than Canada. Therefore, given the other factors
constant Sri Lanka will definitely improve its economy and catch up with Canada.
Figure 5: Population growth
Source: (Created by the Author)
1998 1999 2000 2001 2002 2003 2004 2005 2006 2007 2008 2009 2010 2011 2012 2013 2014 2015 2016 2017
0
0.2
0.4
0.6
0.8
1
1.2
1.4
Percentage Growth in Population
Canada Linear (Canada) Sri Lanka Linear (Sri Lanka)
11ECONOMIC GROWTH AND SUSTAINABLE DEVELOPMENT
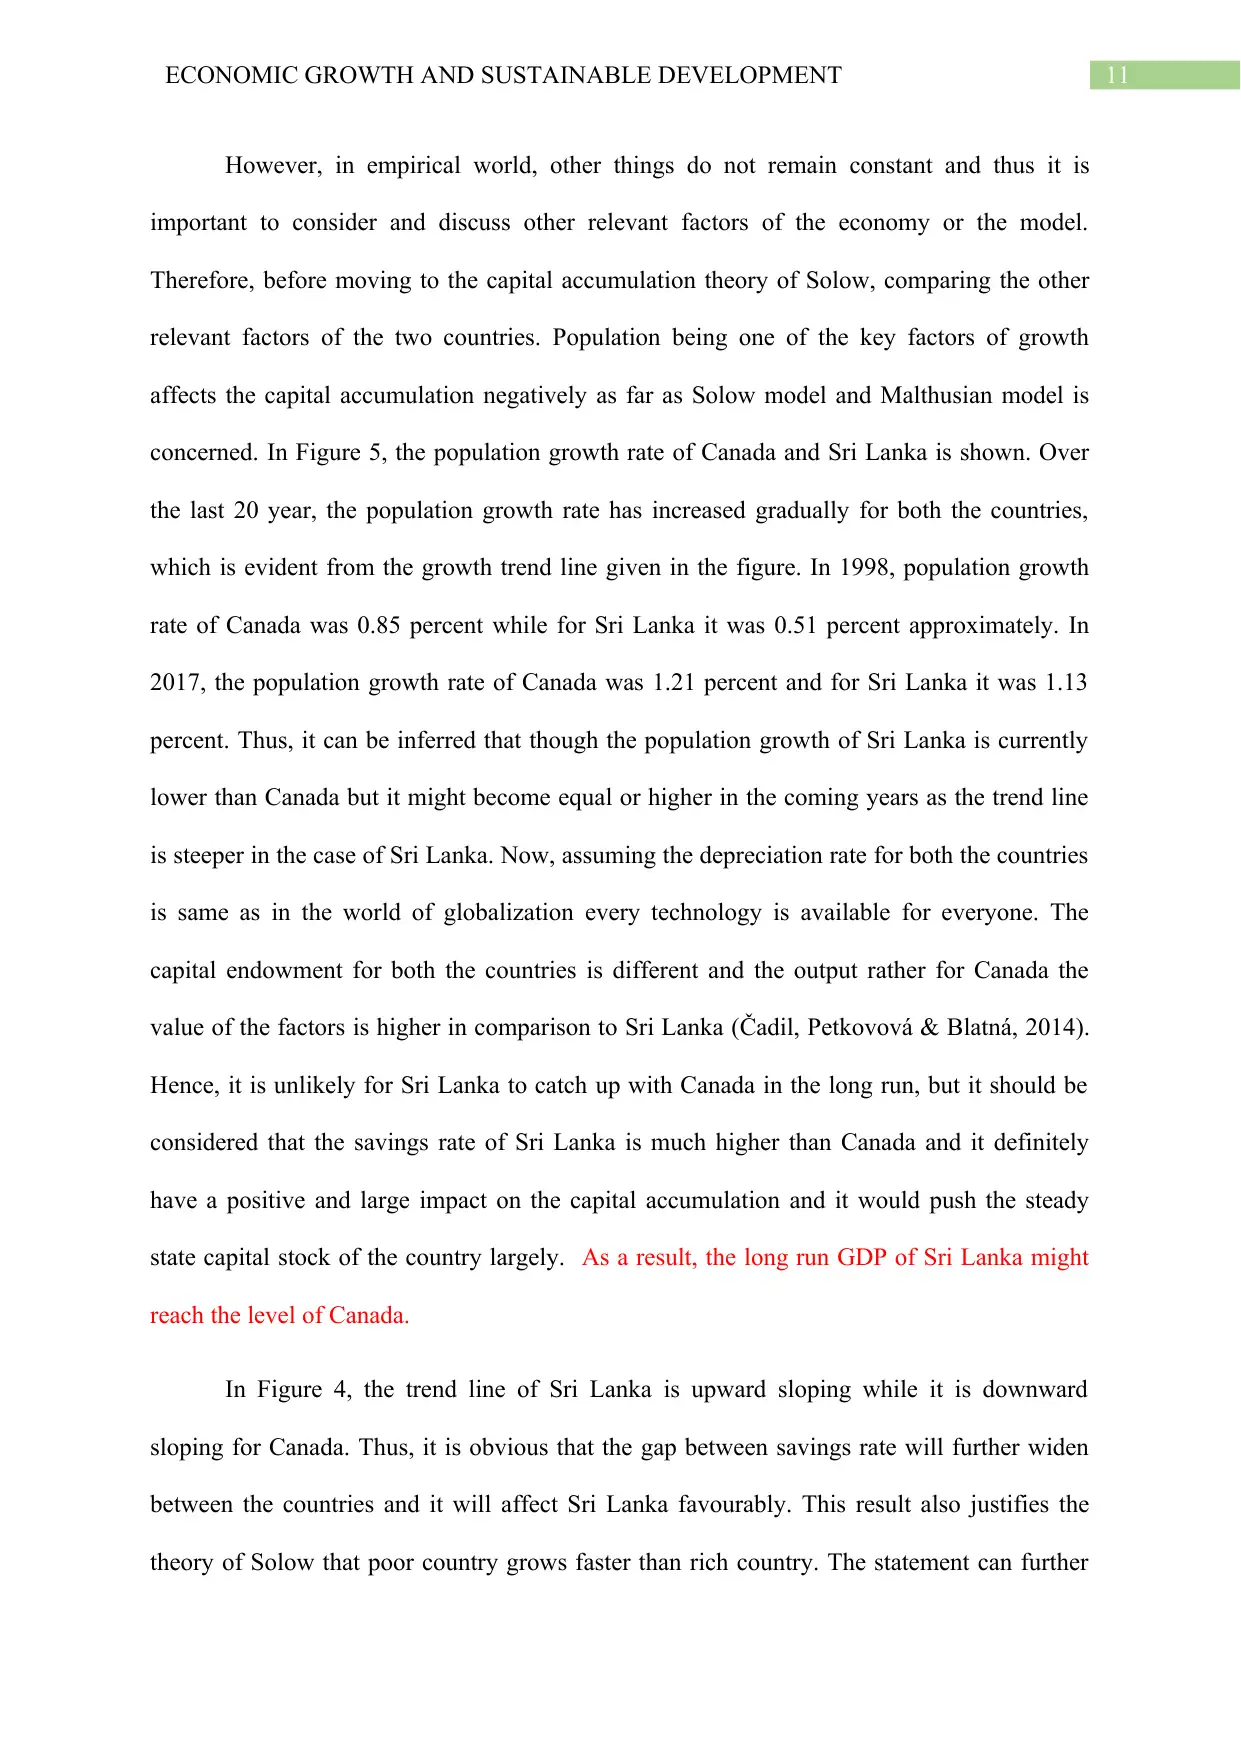
However, in empirical world, other things do not remain constant and thus it is
important to consider and discuss other relevant factors of the economy or the model.
Therefore, before moving to the capital accumulation theory of Solow, comparing the other
relevant factors of the two countries. Population being one of the key factors of growth
affects the capital accumulation negatively as far as Solow model and Malthusian model is
concerned. In Figure 5, the population growth rate of Canada and Sri Lanka is shown. Over
the last 20 year, the population growth rate has increased gradually for both the countries,
which is evident from the growth trend line given in the figure. In 1998, population growth
rate of Canada was 0.85 percent while for Sri Lanka it was 0.51 percent approximately. In
2017, the population growth rate of Canada was 1.21 percent and for Sri Lanka it was 1.13
percent. Thus, it can be inferred that though the population growth of Sri Lanka is currently
lower than Canada but it might become equal or higher in the coming years as the trend line
is steeper in the case of Sri Lanka. Now, assuming the depreciation rate for both the countries
is same as in the world of globalization every technology is available for everyone. The
capital endowment for both the countries is different and the output rather for Canada the
value of the factors is higher in comparison to Sri Lanka (Čadil, Petkovová & Blatná, 2014).
Hence, it is unlikely for Sri Lanka to catch up with Canada in the long run, but it should be
considered that the savings rate of Sri Lanka is much higher than Canada and it definitely
have a positive and large impact on the capital accumulation and it would push the steady
state capital stock of the country largely. As a result, the long run GDP of Sri Lanka might
reach the level of Canada.
In Figure 4, the trend line of Sri Lanka is upward sloping while it is downward
sloping for Canada. Thus, it is obvious that the gap between savings rate will further widen
between the countries and it will affect Sri Lanka favourably. This result also justifies the
theory of Solow that poor country grows faster than rich country. The statement can further
⊘ This is a preview!⊘
Do you want full access?
Subscribe today to unlock all pages.
Trusted by 1+ million students worldwide
1 out of 24
Related Documents


Your All-in-One AI-Powered Toolkit for Academic Success.
+13062052269
info@desklib.com
Available 24*7 on WhatsApp / Email
![[object Object]](/_next/static/media/star-bottom.7253800d.svg)
Unlock your academic potential
Copyright © 2020–2026 A2Z Services. All Rights Reserved. Developed and managed by ZUCOL.