Analysis of GDP, Inflation, and Unemployment Trends

Verified

Added on  2021/06/14

|13
|1301
|60
Report
AI Summary
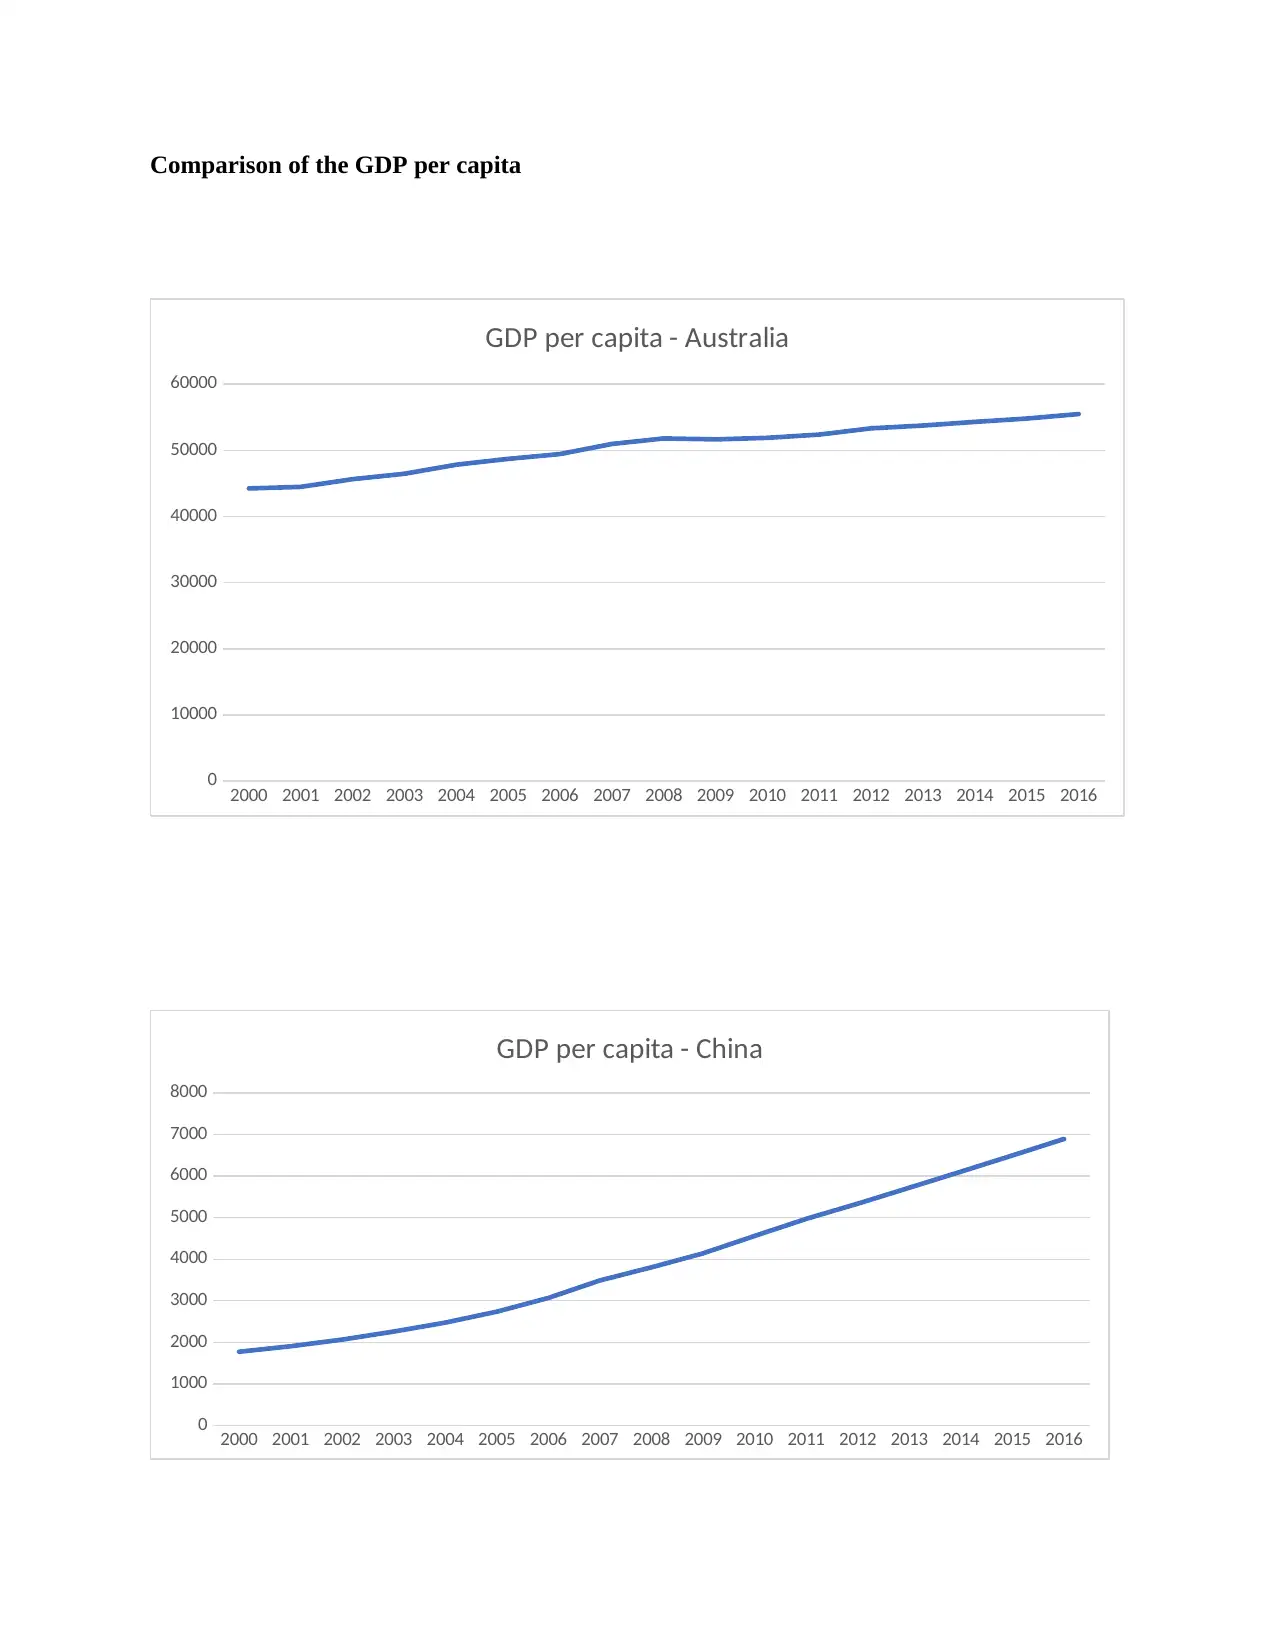
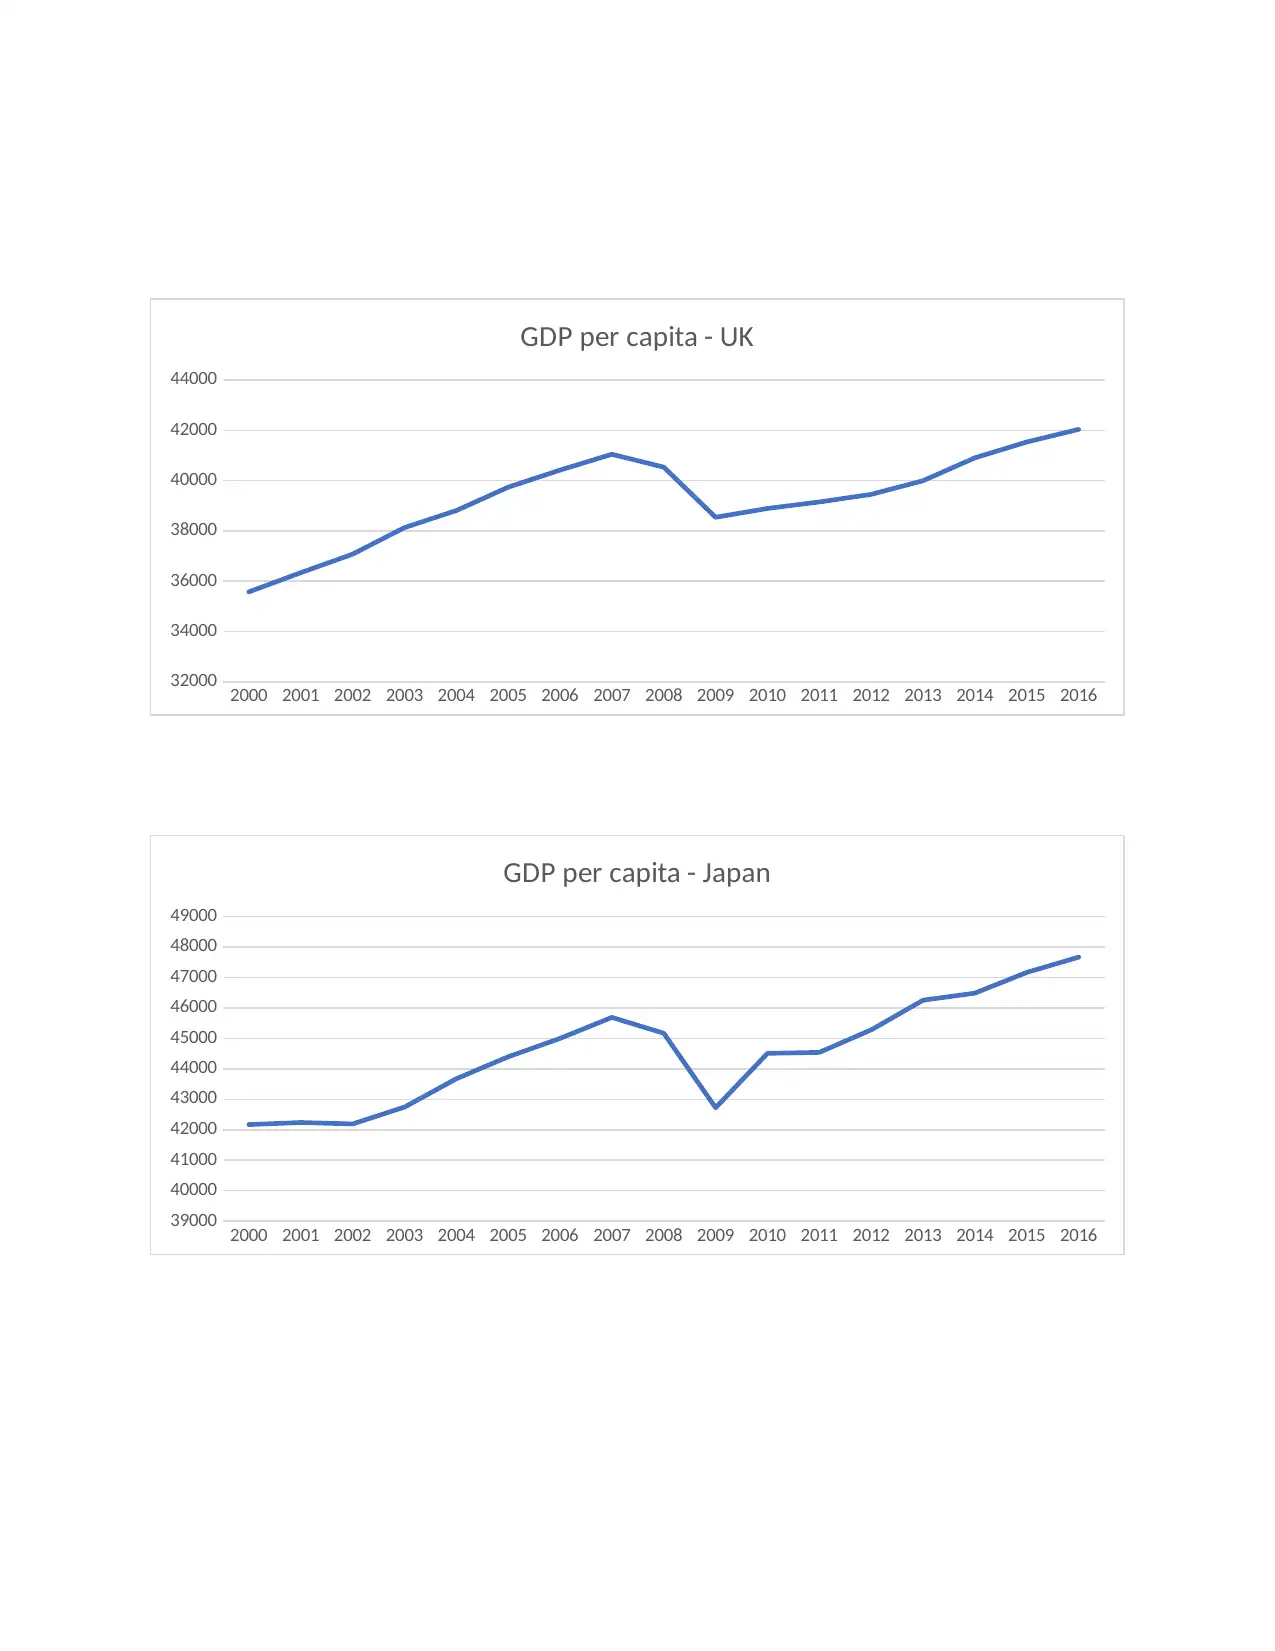
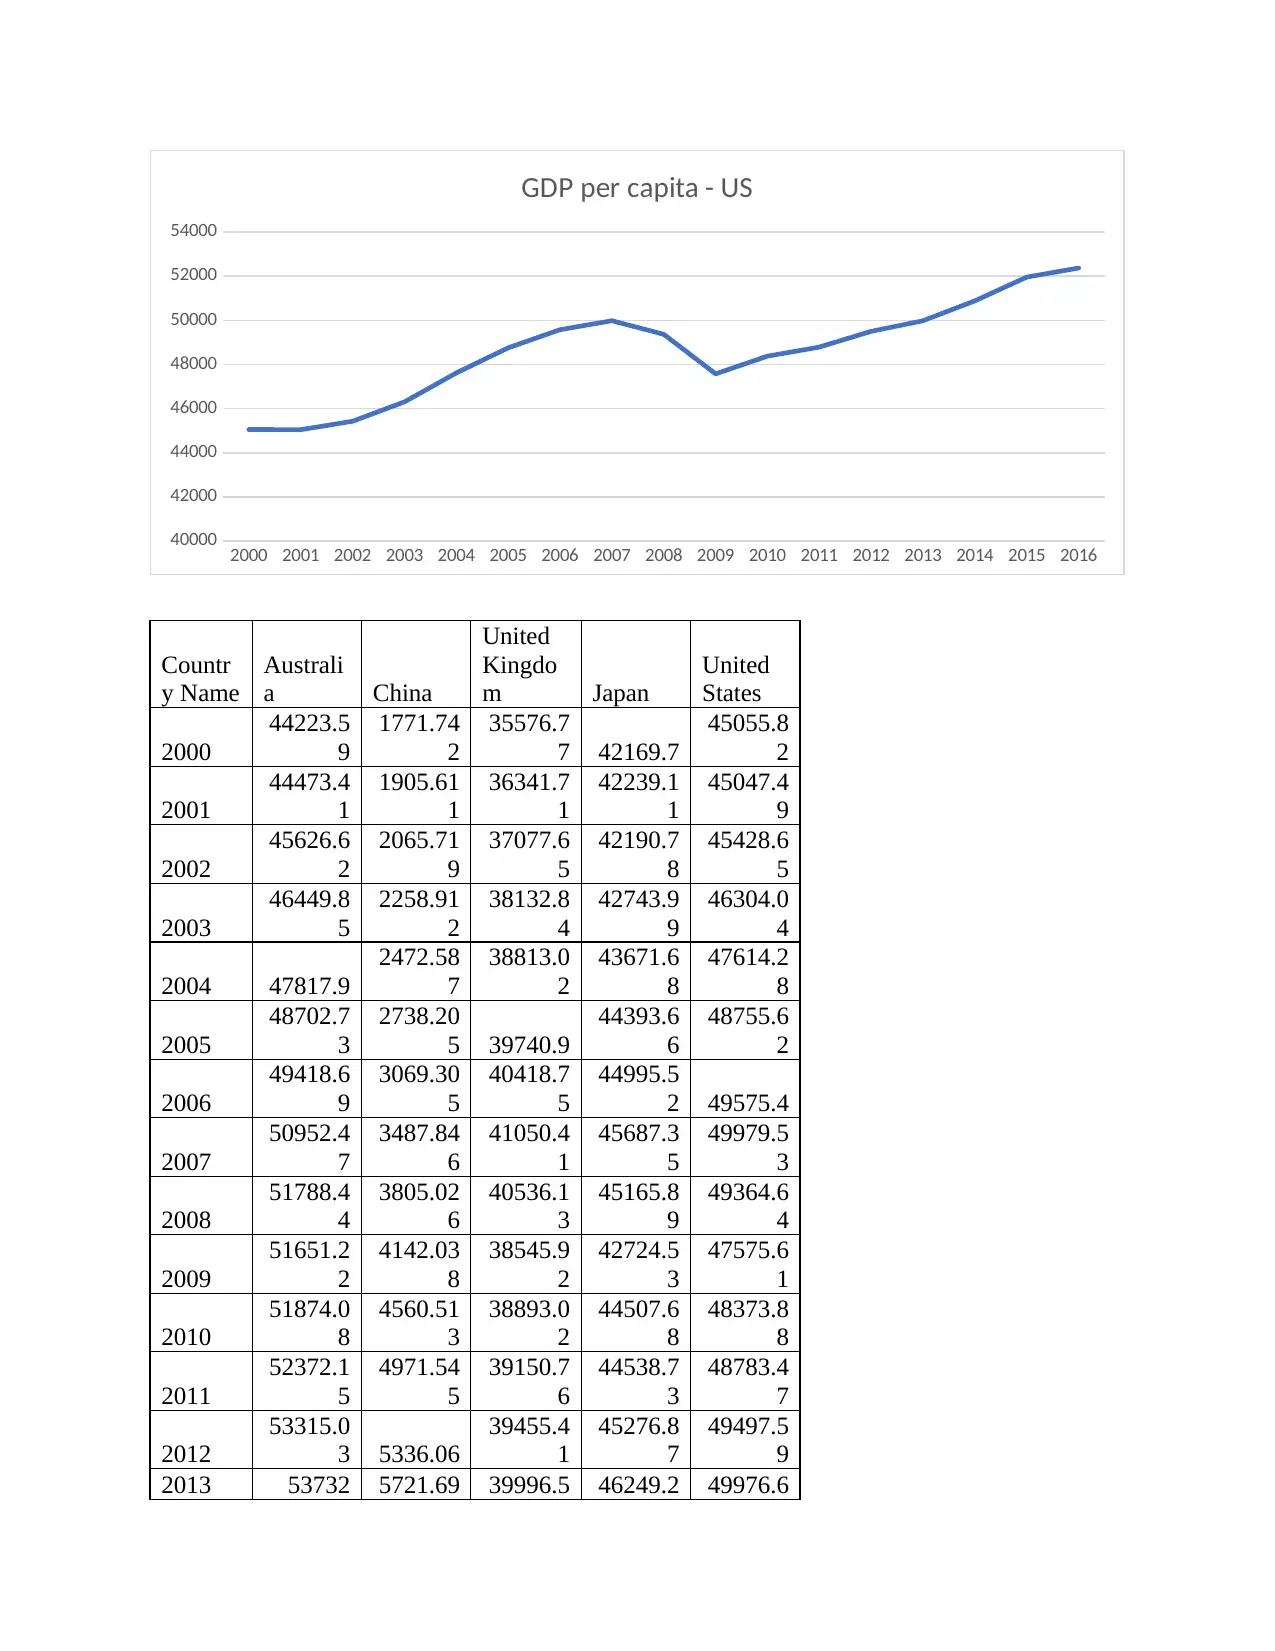
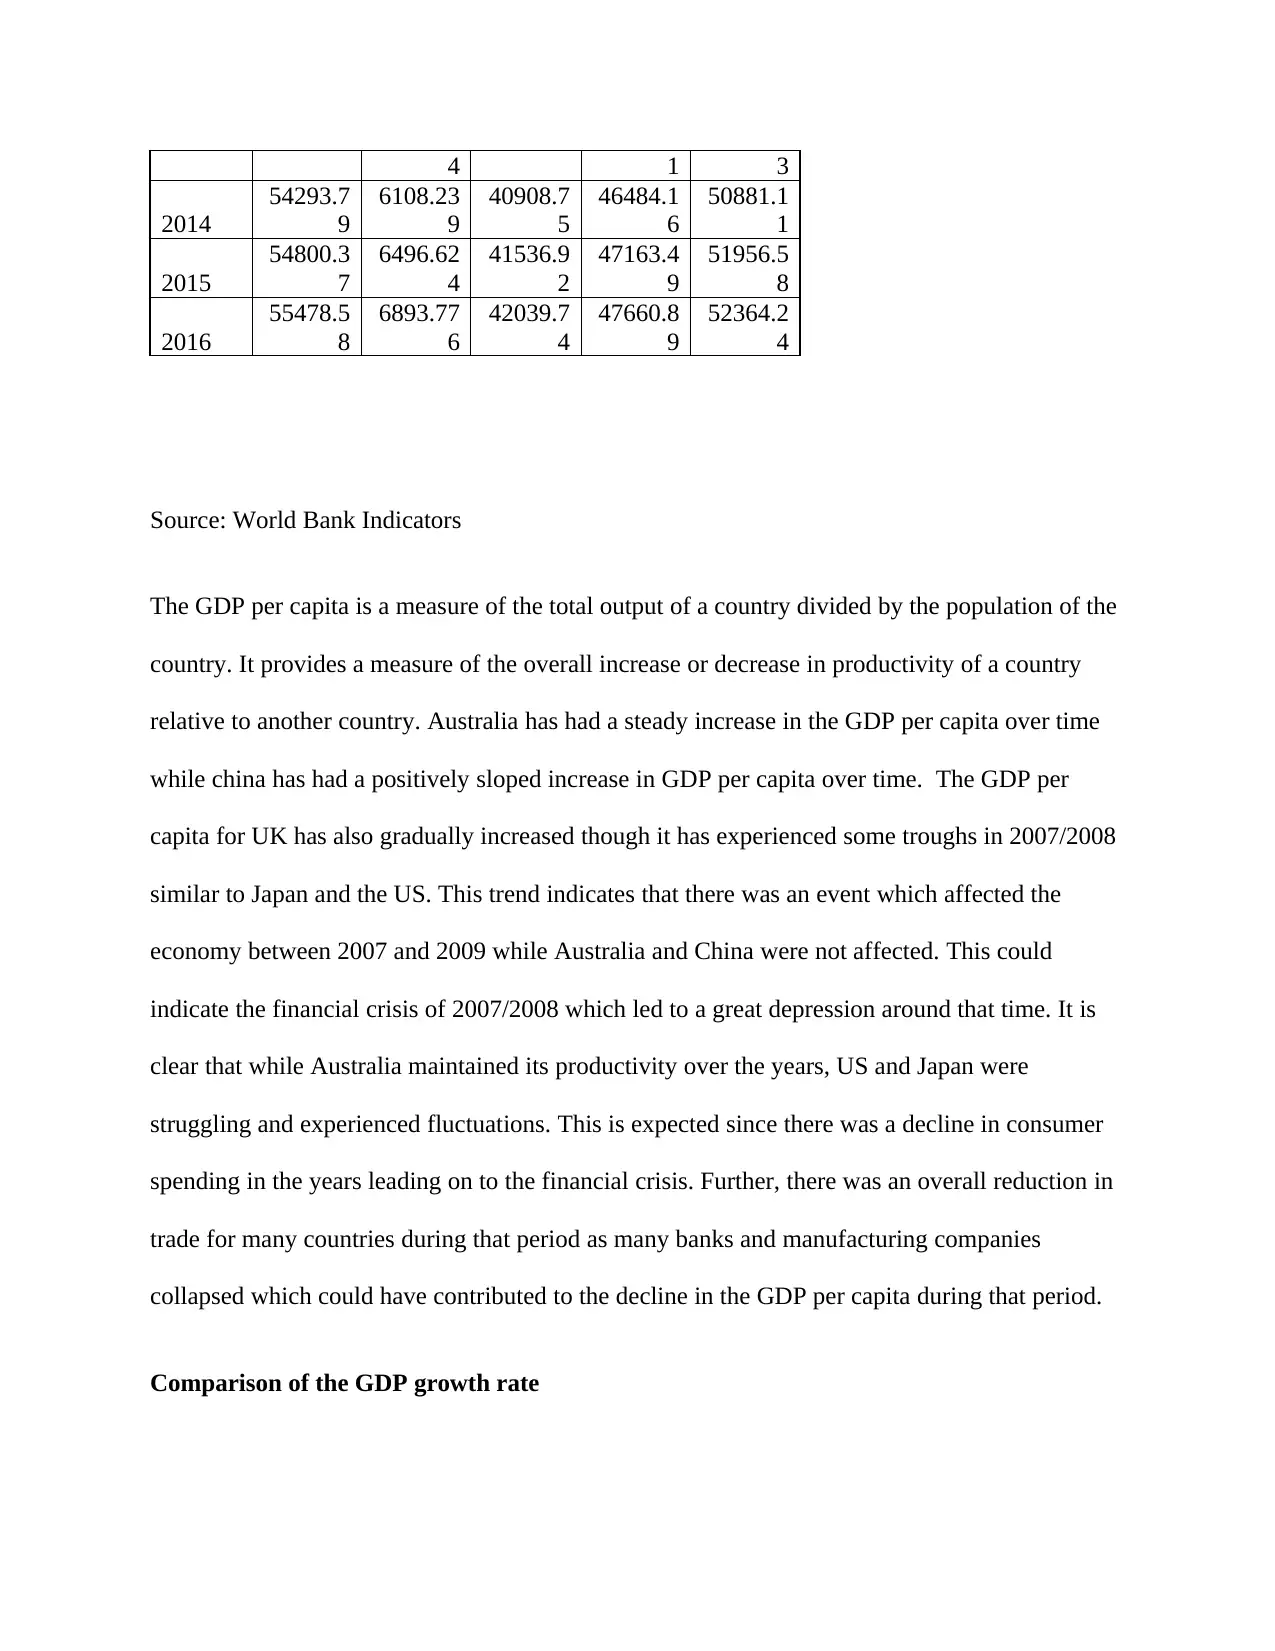
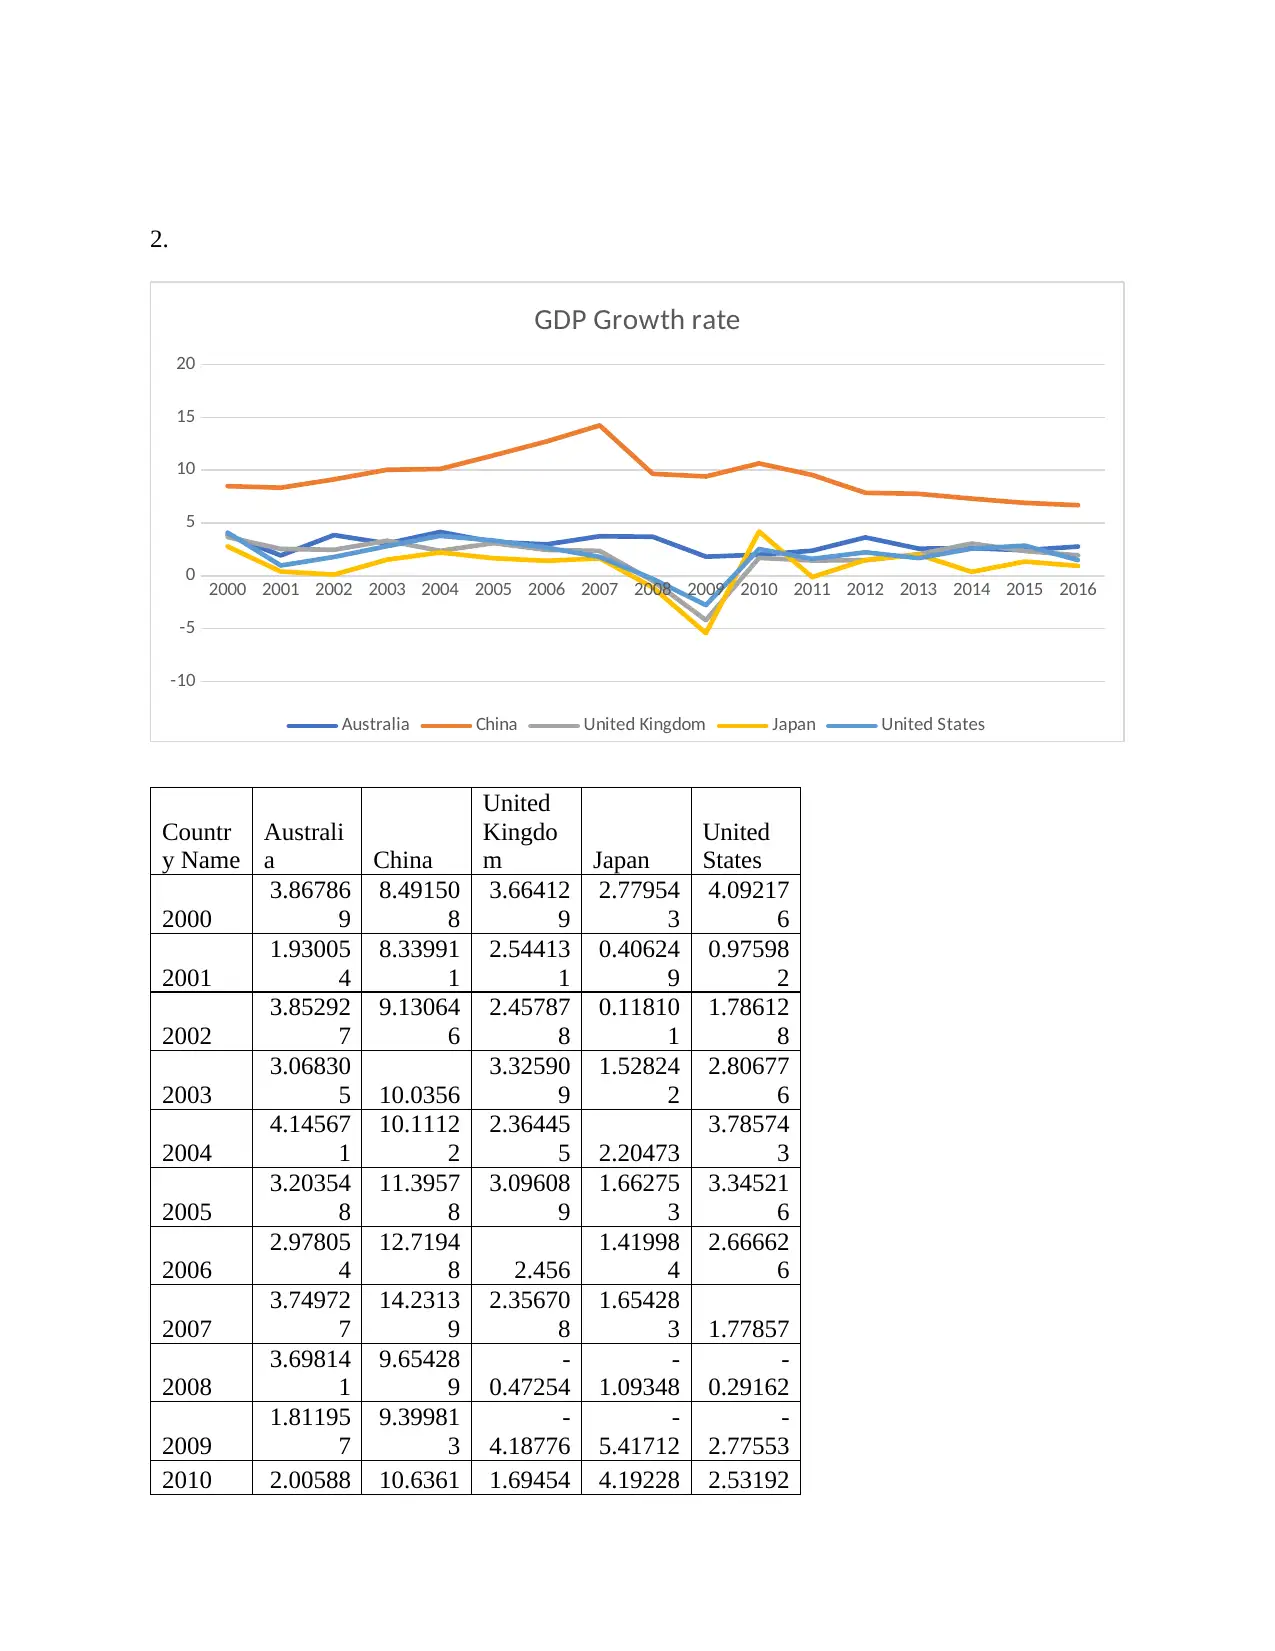
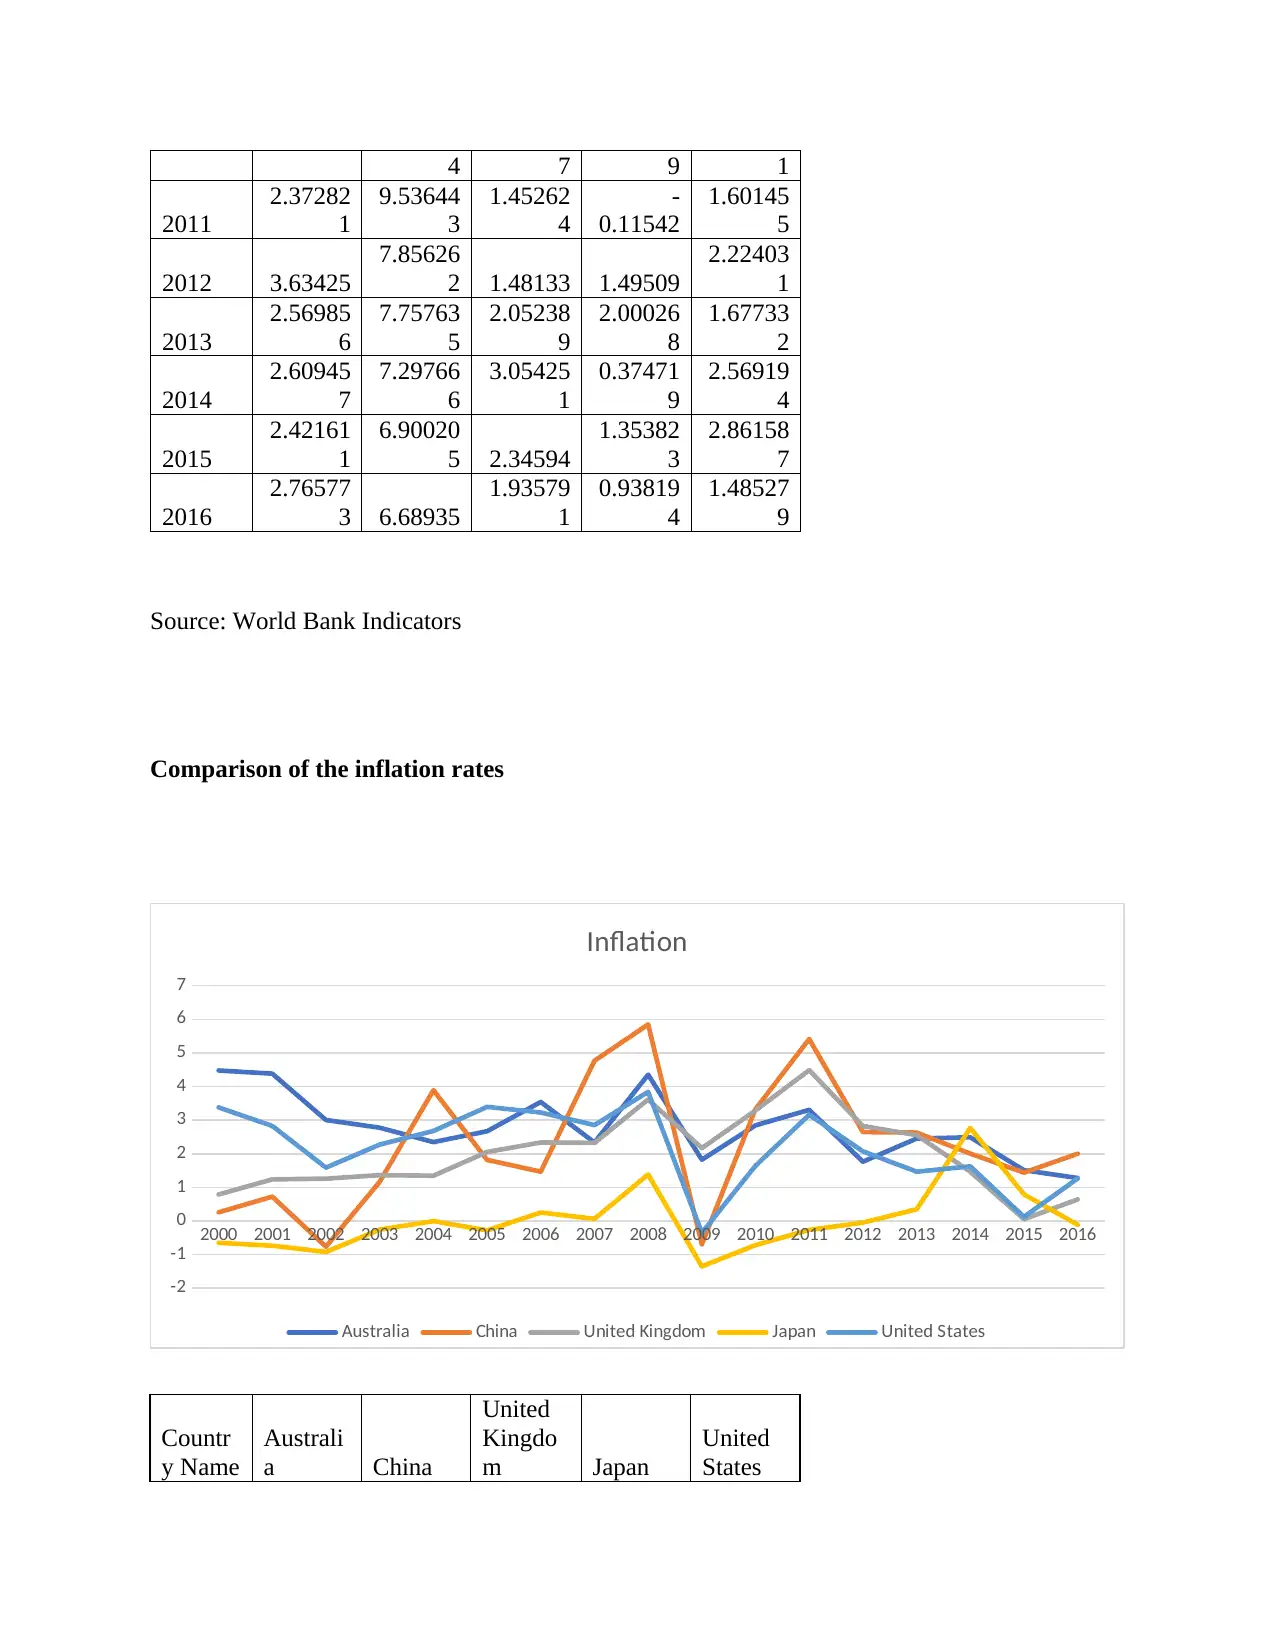
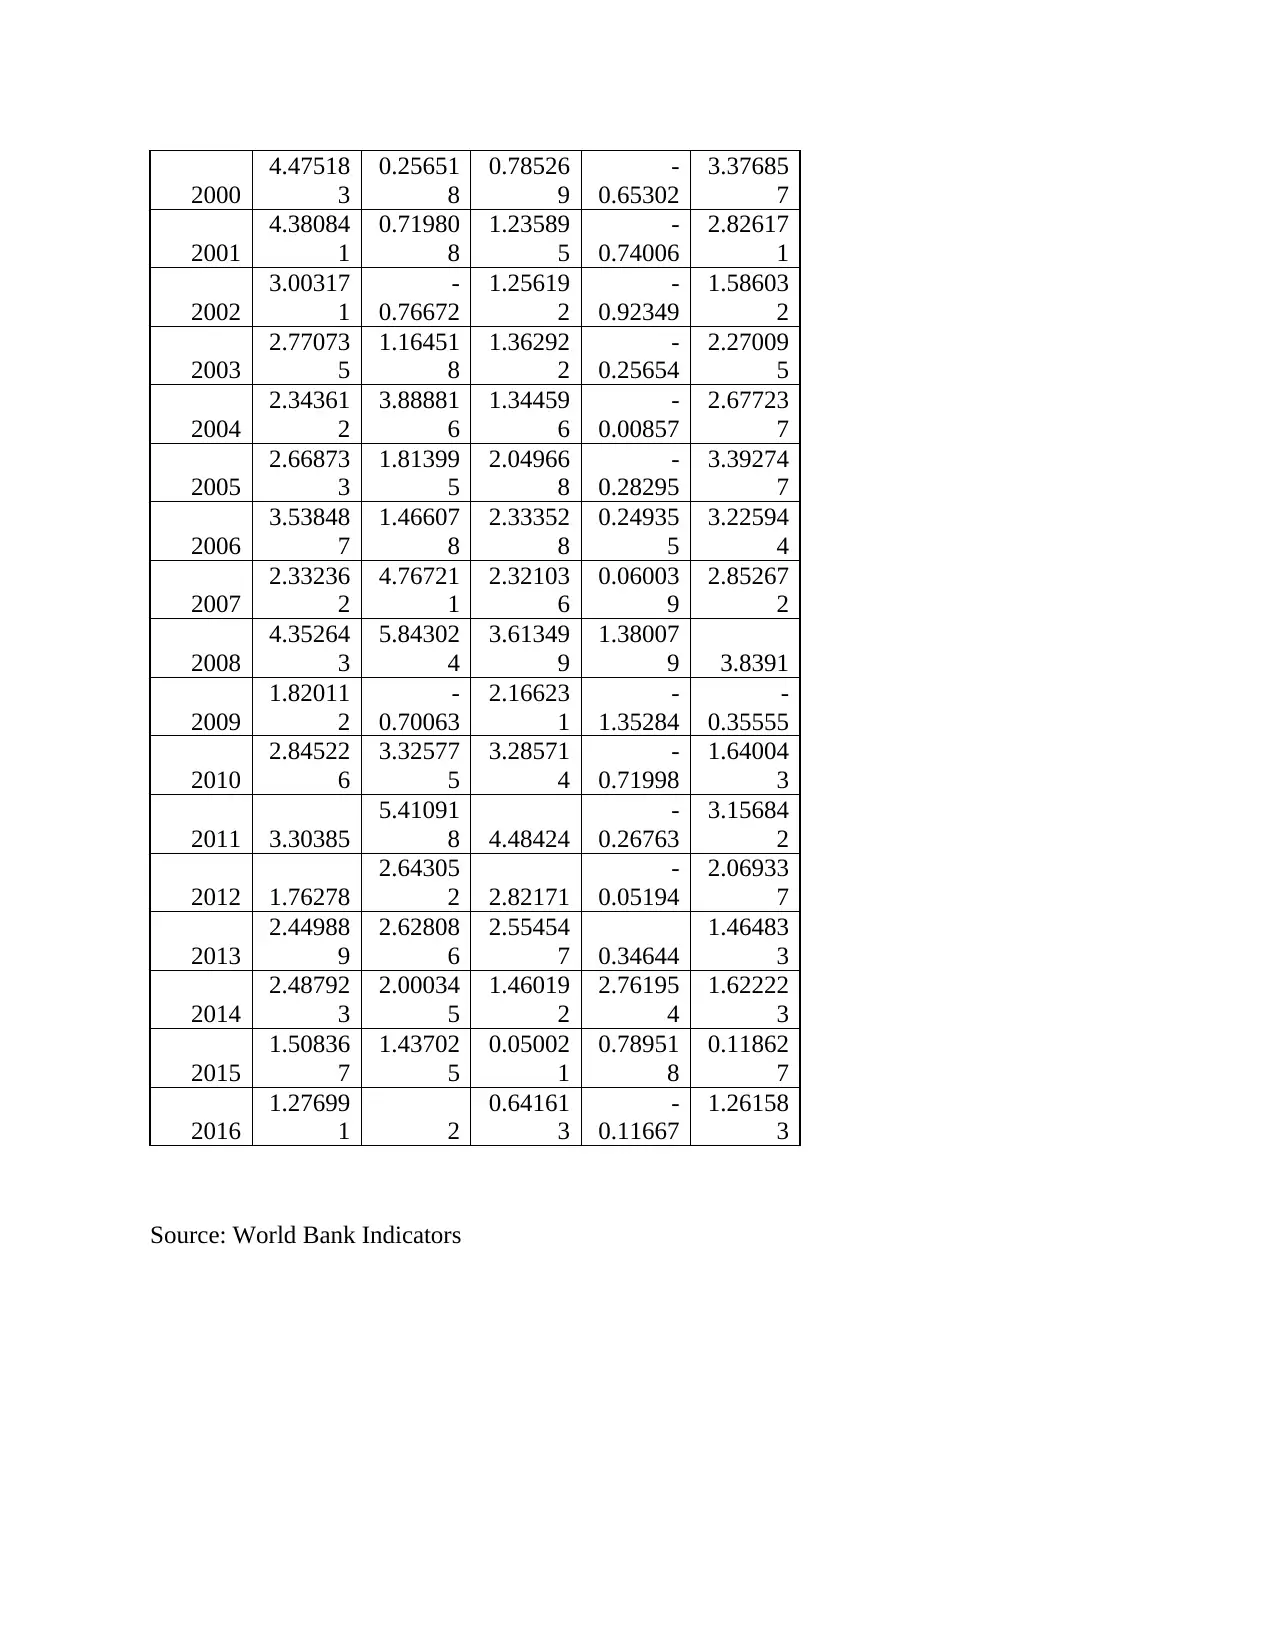
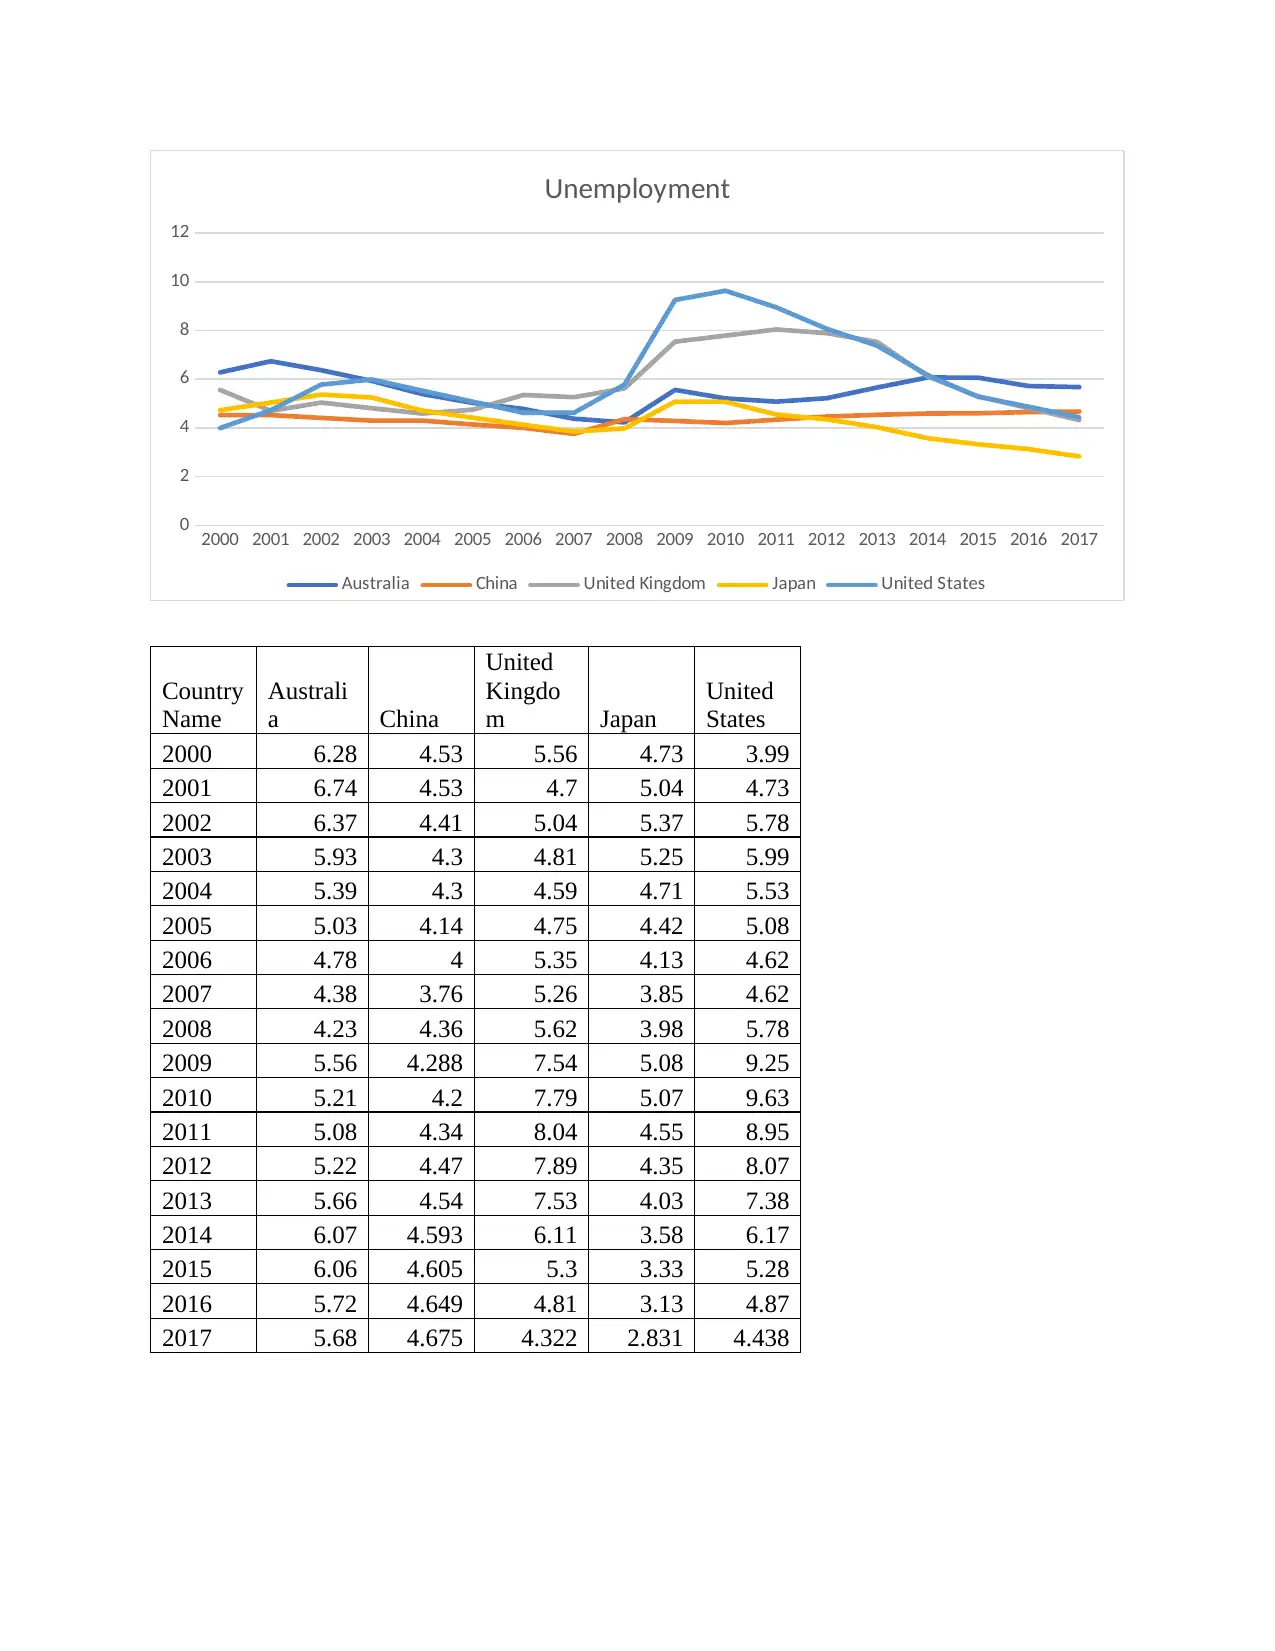
This report presents a comparative analysis of key economic indicators, including GDP per capita, GDP growth rate, inflation rates, unemployment rates, and budget deficits, across Australia, China, the United Kingdom, Japan, and the United States from 2000 to 2017. The analysis reveals distinct trends in each country, highlighting Australia's steady GDP per capita growth, China's rapid economic expansion, and fluctuations in the US, UK, and Japan, particularly during the 2007-2009 financial crisis. The report further examines inflation and unemployment patterns, showing a global decline in inflation during the crisis and a corresponding rise in unemployment. It also explores budget deficits, demonstrating how most countries, excluding China, experienced deficits during the financial crisis due to reduced tax revenues and increased government spending. The study references various sources and provides insights into the interrelationships between these economic variables and their implications for global economic performance. The report concludes by emphasizing the impact of the financial crisis on the economic trajectories of the studied nations.
Document Page
Course
Name
Institution Affiliation
tabler-icon-diamond-filled.svg

Paraphrase This Document

Need a fresh take? Get an instant paraphrase of this document with our AI Paraphraser
Document Page
Comparison of the GDP per capita
2000 2001 2002 2003 2004 2005 2006 2007 2008 2009 2010 2011 2012 2013 2014 2015 2016
0
10000
20000
30000
40000
50000
60000
GDP per capita - Australia
2000 2001 2002 2003 2004 2005 2006 2007 2008 2009 2010 2011 2012 2013 2014 2015 2016
0
1000
2000
3000
4000
5000
6000
7000
8000
GDP per capita - China
Document Page
2000 2001 2002 2003 2004 2005 2006 2007 2008 2009 2010 2011 2012 2013 2014 2015 2016
32000
34000
36000
38000
40000
42000
44000
GDP per capita - UK
2000 2001 2002 2003 2004 2005 2006 2007 2008 2009 2010 2011 2012 2013 2014 2015 2016
39000
40000
41000
42000
43000
44000
45000
46000
47000
48000
49000
GDP per capita - Japan
Document Page
2000 2001 2002 2003 2004 2005 2006 2007 2008 2009 2010 2011 2012 2013 2014 2015 2016
40000
42000
44000
46000
48000
50000
52000
54000
GDP per capita - US
Countr
y Name
Australi
a China
United
Kingdo
m Japan
United
States
2000
44223.5
9
1771.74
2
35576.7
7 42169.7
45055.8
2
2001
44473.4
1
1905.61
1
36341.7
1
42239.1
1
45047.4
9
2002
45626.6
2
2065.71
9
37077.6
5
42190.7
8
45428.6
5
2003
46449.8
5
2258.91
2
38132.8
4
42743.9
9
46304.0
4
2004 47817.9
2472.58
7
38813.0
2
43671.6
8
47614.2
8
2005
48702.7
3
2738.20
5 39740.9
44393.6
6
48755.6
2
2006
49418.6
9
3069.30
5
40418.7
5
44995.5
2 49575.4
2007
50952.4
7
3487.84
6
41050.4
1
45687.3
5
49979.5
3
2008
51788.4
4
3805.02
6
40536.1
3
45165.8
9
49364.6
4
2009
51651.2
2
4142.03
8
38545.9
2
42724.5
3
47575.6
1
2010
51874.0
8
4560.51
3
38893.0
2
44507.6
8
48373.8
8
2011
52372.1
5
4971.54
5
39150.7
6
44538.7
3
48783.4
7
2012
53315.0
3 5336.06
39455.4
1
45276.8
7
49497.5
9
2013 53732 5721.69 39996.5 46249.2 49976.6
tabler-icon-diamond-filled.svg

Paraphrase This Document

Need a fresh take? Get an instant paraphrase of this document with our AI Paraphraser
Document Page
4 1 3
2014
54293.7
9
6108.23
9
40908.7
5
46484.1
6
50881.1
1
2015
54800.3
7
6496.62
4
41536.9
2
47163.4
9
51956.5
8
2016
55478.5
8
6893.77
6
42039.7
4
47660.8
9
52364.2
4
Source: World Bank Indicators
The GDP per capita is a measure of the total output of a country divided by the population of the
country. It provides a measure of the overall increase or decrease in productivity of a country
relative to another country. Australia has had a steady increase in the GDP per capita over time
while china has had a positively sloped increase in GDP per capita over time. The GDP per
capita for UK has also gradually increased though it has experienced some troughs in 2007/2008
similar to Japan and the US. This trend indicates that there was an event which affected the
economy between 2007 and 2009 while Australia and China were not affected. This could
indicate the financial crisis of 2007/2008 which led to a great depression around that time. It is
clear that while Australia maintained its productivity over the years, US and Japan were
struggling and experienced fluctuations. This is expected since there was a decline in consumer
spending in the years leading on to the financial crisis. Further, there was an overall reduction in
trade for many countries during that period as many banks and manufacturing companies
collapsed which could have contributed to the decline in the GDP per capita during that period.
Comparison of the GDP growth rate
Document Page
2.
2000 2001 2002 2003 2004 2005 2006 2007 2008 2009 2010 2011 2012 2013 2014 2015 2016
-10
-5
0
5
10
15
20
GDP Growth rate
Australia China United Kingdom Japan United States
Countr
y Name
Australi
a China
United
Kingdo
m Japan
United
States
2000
3.86786
9
8.49150
8
3.66412
9
2.77954
3
4.09217
6
2001
1.93005
4
8.33991
1
2.54413
1
0.40624
9
0.97598
2
2002
3.85292
7
9.13064
6
2.45787
8
0.11810
1
1.78612
8
2003
3.06830
5 10.0356
3.32590
9
1.52824
2
2.80677
6
2004
4.14567
1
10.1112
2
2.36445
5 2.20473
3.78574
3
2005
3.20354
8
11.3957
8
3.09608
9
1.66275
3
3.34521
6
2006
2.97805
4
12.7194
8 2.456
1.41998
4
2.66662
6
2007
3.74972
7
14.2313
9
2.35670
8
1.65428
3 1.77857
2008
3.69814
1
9.65428
9
-
0.47254
-
1.09348
-
0.29162
2009
1.81195
7
9.39981
3
-
4.18776
-
5.41712
-
2.77553
2010 2.00588 10.6361 1.69454 4.19228 2.53192
Document Page
4 7 9 1
2011
2.37282
1
9.53644
3
1.45262
4
-
0.11542
1.60145
5
2012 3.63425
7.85626
2 1.48133 1.49509
2.22403
1
2013
2.56985
6
7.75763
5
2.05238
9
2.00026
8
1.67733
2
2014
2.60945
7
7.29766
6
3.05425
1
0.37471
9
2.56919
4
2015
2.42161
1
6.90020
5 2.34594
1.35382
3
2.86158
7
2016
2.76577
3 6.68935
1.93579
1
0.93819
4
1.48527
9
Source: World Bank Indicators
Comparison of the inflation rates
2000 2001 2002 2003 2004 2005 2006 2007 2008 2009 2010 2011 2012 2013 2014 2015 2016
-2
-1
0
1
2
3
4
5
6
7
Inflation
Australia China United Kingdom Japan United States
Countr
y Name
Australi
a China
United
Kingdo
m Japan
United
States
tabler-icon-diamond-filled.svg

Paraphrase This Document

Need a fresh take? Get an instant paraphrase of this document with our AI Paraphraser
Document Page
2000
4.47518
3
0.25651
8
0.78526
9
-
0.65302
3.37685
7
2001
4.38084
1
0.71980
8
1.23589
5
-
0.74006
2.82617
1
2002
3.00317
1
-
0.76672
1.25619
2
-
0.92349
1.58603
2
2003
2.77073
5
1.16451
8
1.36292
2
-
0.25654
2.27009
5
2004
2.34361
2
3.88881
6
1.34459
6
-
0.00857
2.67723
7
2005
2.66873
3
1.81399
5
2.04966
8
-
0.28295
3.39274
7
2006
3.53848
7
1.46607
8
2.33352
8
0.24935
5
3.22594
4
2007
2.33236
2
4.76721
1
2.32103
6
0.06003
9
2.85267
2
2008
4.35264
3
5.84302
4
3.61349
9
1.38007
9 3.8391
2009
1.82011
2
-
0.70063
2.16623
1
-
1.35284
-
0.35555
2010
2.84522
6
3.32577
5
3.28571
4
-
0.71998
1.64004
3
2011 3.30385
5.41091
8 4.48424
-
0.26763
3.15684
2
2012 1.76278
2.64305
2 2.82171
-
0.05194
2.06933
7
2013
2.44988
9
2.62808
6
2.55454
7 0.34644
1.46483
3
2014
2.48792
3
2.00034
5
1.46019
2
2.76195
4
1.62222
3
2015
1.50836
7
1.43702
5
0.05002
1
0.78951
8
0.11862
7
2016
1.27699
1 2
0.64161
3
-
0.11667
1.26158
3
Source: World Bank Indicators
Document Page
2000 2001 2002 2003 2004 2005 2006 2007 2008 2009 2010 2011 2012 2013 2014 2015 2016 2017
0
2
4
6
8
10
12
Unemployment
Australia China United Kingdom Japan United States
Country
Name
Australi
a China
United
Kingdo
m Japan
United
States
2000 6.28 4.53 5.56 4.73 3.99
2001 6.74 4.53 4.7 5.04 4.73
2002 6.37 4.41 5.04 5.37 5.78
2003 5.93 4.3 4.81 5.25 5.99
2004 5.39 4.3 4.59 4.71 5.53
2005 5.03 4.14 4.75 4.42 5.08
2006 4.78 4 5.35 4.13 4.62
2007 4.38 3.76 5.26 3.85 4.62
2008 4.23 4.36 5.62 3.98 5.78
2009 5.56 4.288 7.54 5.08 9.25
2010 5.21 4.2 7.79 5.07 9.63
2011 5.08 4.34 8.04 4.55 8.95
2012 5.22 4.47 7.89 4.35 8.07
2013 5.66 4.54 7.53 4.03 7.38
2014 6.07 4.593 6.11 3.58 6.17
2015 6.06 4.605 5.3 3.33 5.28
2016 5.72 4.649 4.81 3.13 4.87
2017 5.68 4.675 4.322 2.831 4.438
Document Page
Source: World Bank Indicators
It is clear that China has had an increasing level of GDP growth rate while for the US, UK and
Japan, they experienced a decline in the GDP growth rate in the years of the depression.
Australia has maintained a steady growth rate over the years. It is clear that in 2009, the world
experienced a decline in inflation compared to the other years which also could have resulted
from the crisis. Also, the unemployment chart shows that unemployment increased sharply in the
years during and slightly after the financial crisis.
Comparison of Budget deficit
tabler-icon-diamond-filled.svg

Paraphrase This Document

Need a fresh take? Get an instant paraphrase of this document with our AI Paraphraser
Document Page
2000 2001 2002 2003 2004 2005 2006 2007 2008 2009 2010 2011 2012 2013 2014 2015 2016
-20000
-15000
-10000
-5000
0
5000
Budget surplus/ Deficit
Australia China United Kingdom Japan United States
2000 821.6109 0 423.832
-
2461.86 1189.876
2001 310.0355 0 339.7811 -2299.3 1.509809
2002 -205.863 0 -558.64
-
2623.61 -1216.95
2003 370.6313 0 -1119.41
-
2583.22 -1784.81
2004 430.7509 0 -993.426
-
2179.04 -1701.98
2005 699.6323
263.553
4 -996.227
-
1749.14 -1363.06
2006 1004.155
310.772
1 -781.814
-
1457.03 -969.998
2007 983.6829
583.371
4 -873.496
-
1229.22 -1101.58
2008 1169.976 421.107 -1452.01 - -2523.3
Document Page
8 2342.55
2009 -1031.28
482.293
8 -3312.02
-
3799.61 -4733.87
2010 -1767.67 511.065 -3263.55
-
3352.06 -4706.76
2011 -1671.15
557.184
9 -2587.73
-
3737.74 -4281.61
2012 -1386.82 0 -3123.87
-
3432.46 -3602.88
2013 -758.108 -63.8766 -1910.92
-
3146.04 -2104.18
2014 -1017.07 -25.6714 -2030.25
-
2445.96 -1956.63
2015 -1253.01 -1067.08 -1496.66
-
2140.46 -1831.23
2016 -1176.18 0 -15680.5
-
2240.98 -2113.67
Source: World Bank Indicators
A budget deficit occurs when the government budget is way above its revenues. It is clear that
most of the countries except china experienced a budget deficit during the time of the financial
crisis. This is expected since the countries would have experienced lower tax revenues levels
compared to other years especially after the financial crisis. Despite the low revenue levels, the
government still has an obligation to provide for the security and the welfare of its citizens and
these obligations may at times be higher than the tax revenues. The budget deficit of the united
states has been increasing at a fast rate especially from the year 2015. The United States has been
incurring particularly high budget deficits especially due to their investment in military resources
which may have increased the government expenditure.
References
chevron_up_icon
1 out of 13
circle_padding
hide_on_mobile
zoom_out_icon
[object Object]