International Trade: Economic Integration of Italy and Sweden Analysis
VerifiedAdded on 2023/04/07
|10
|1478
|190
Report
AI Summary
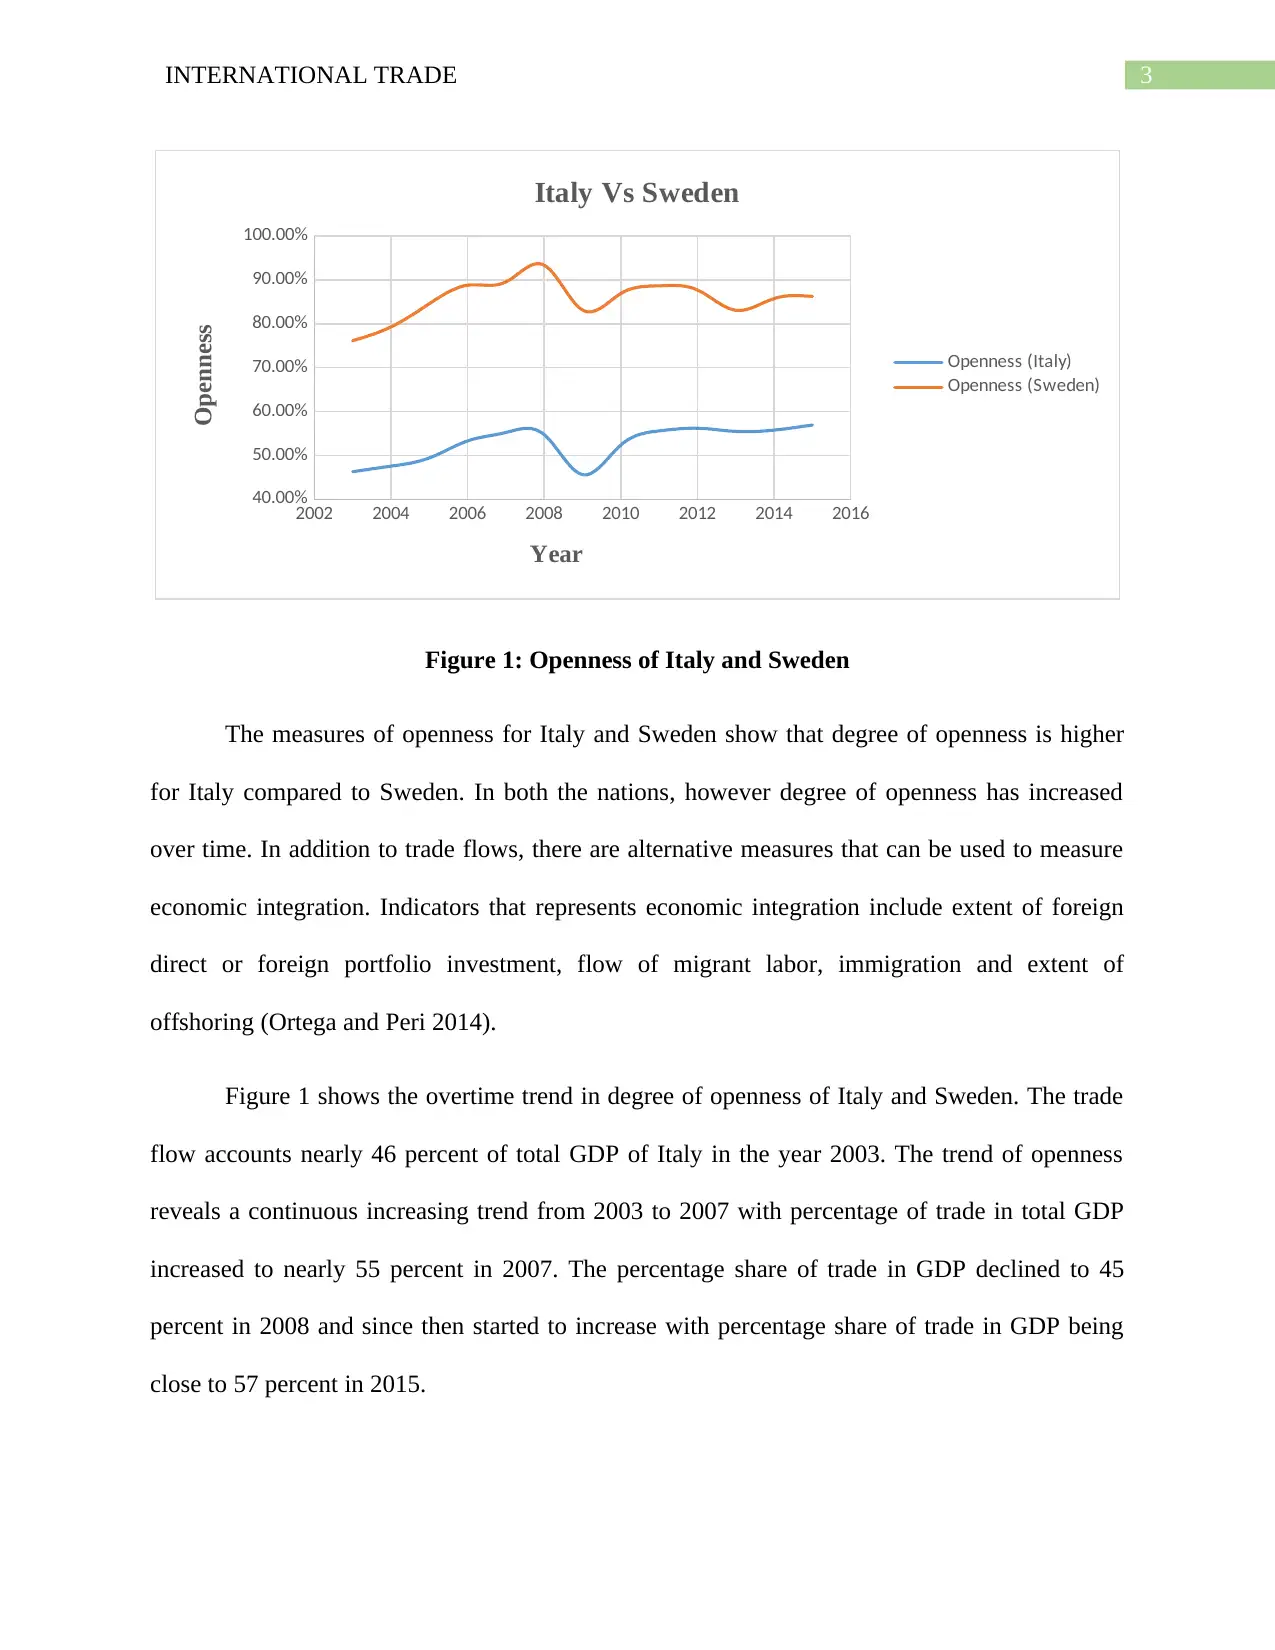
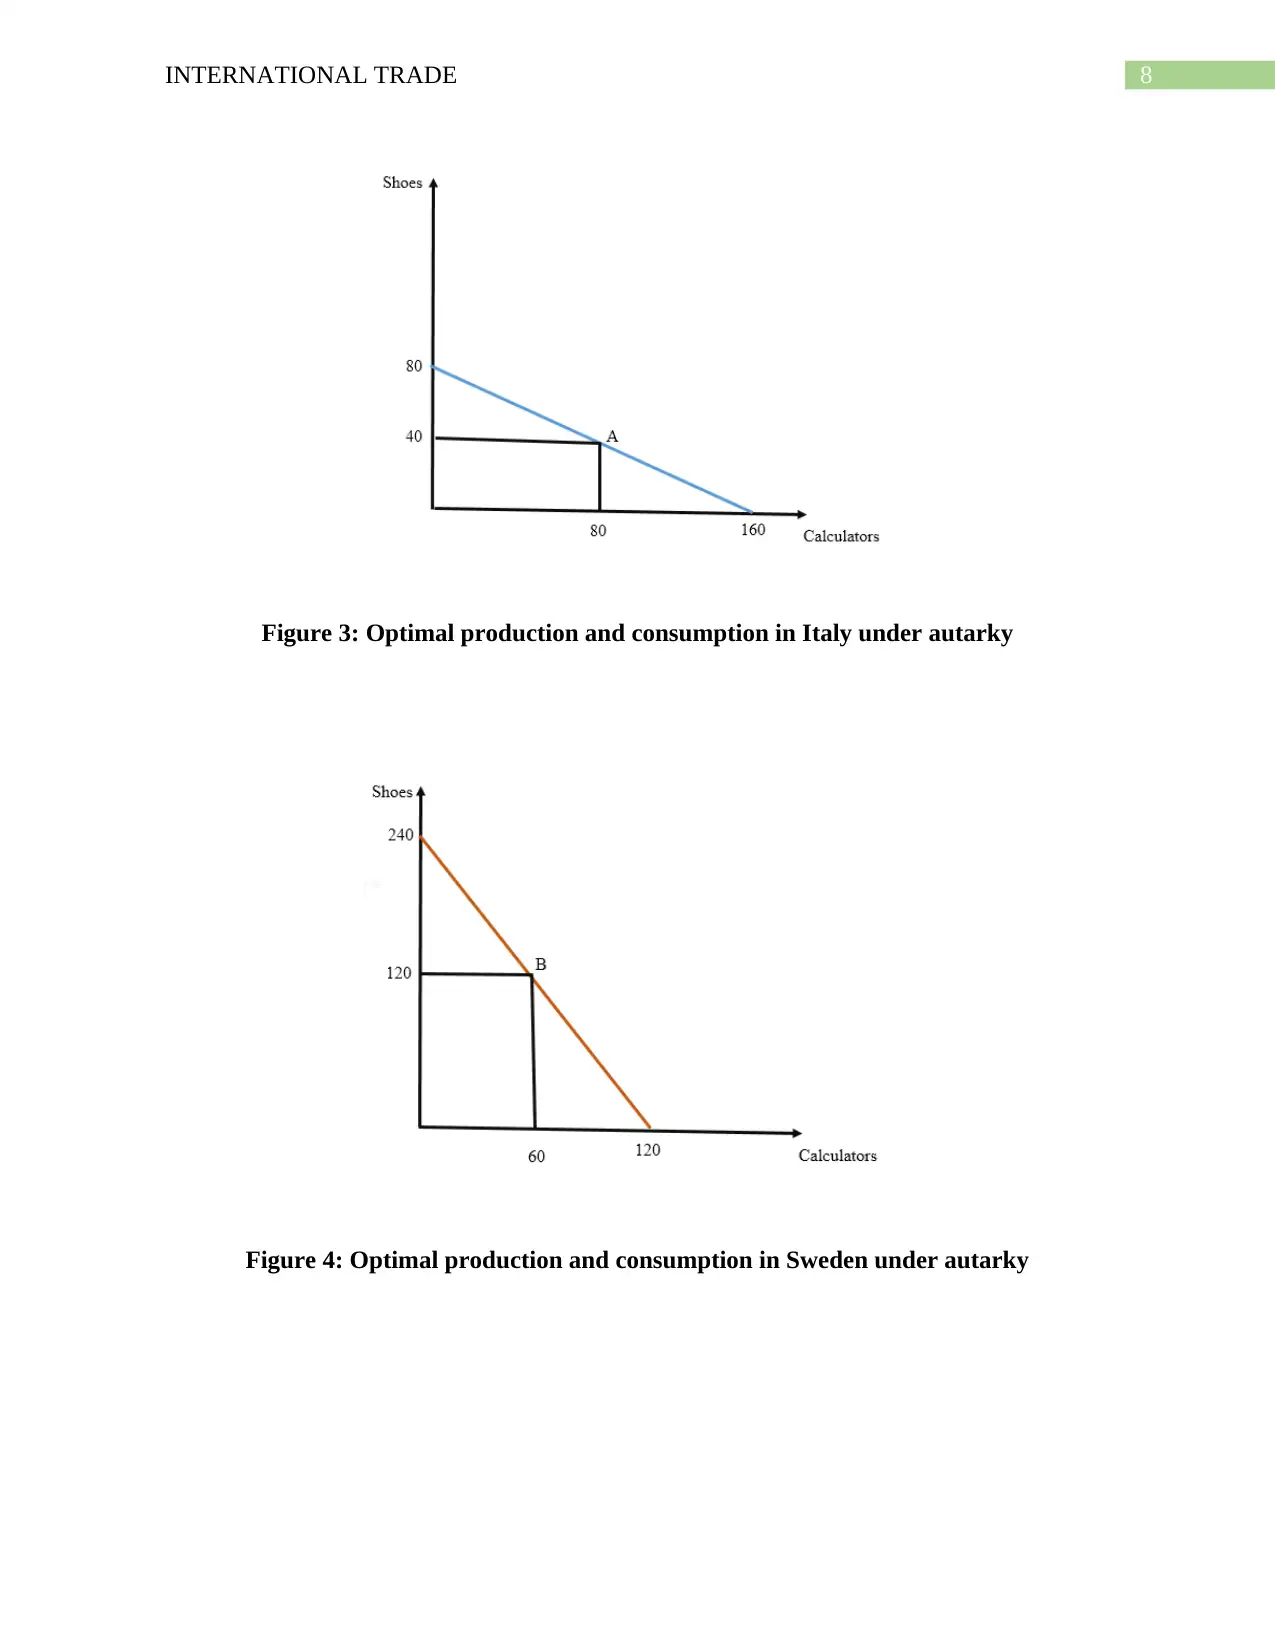
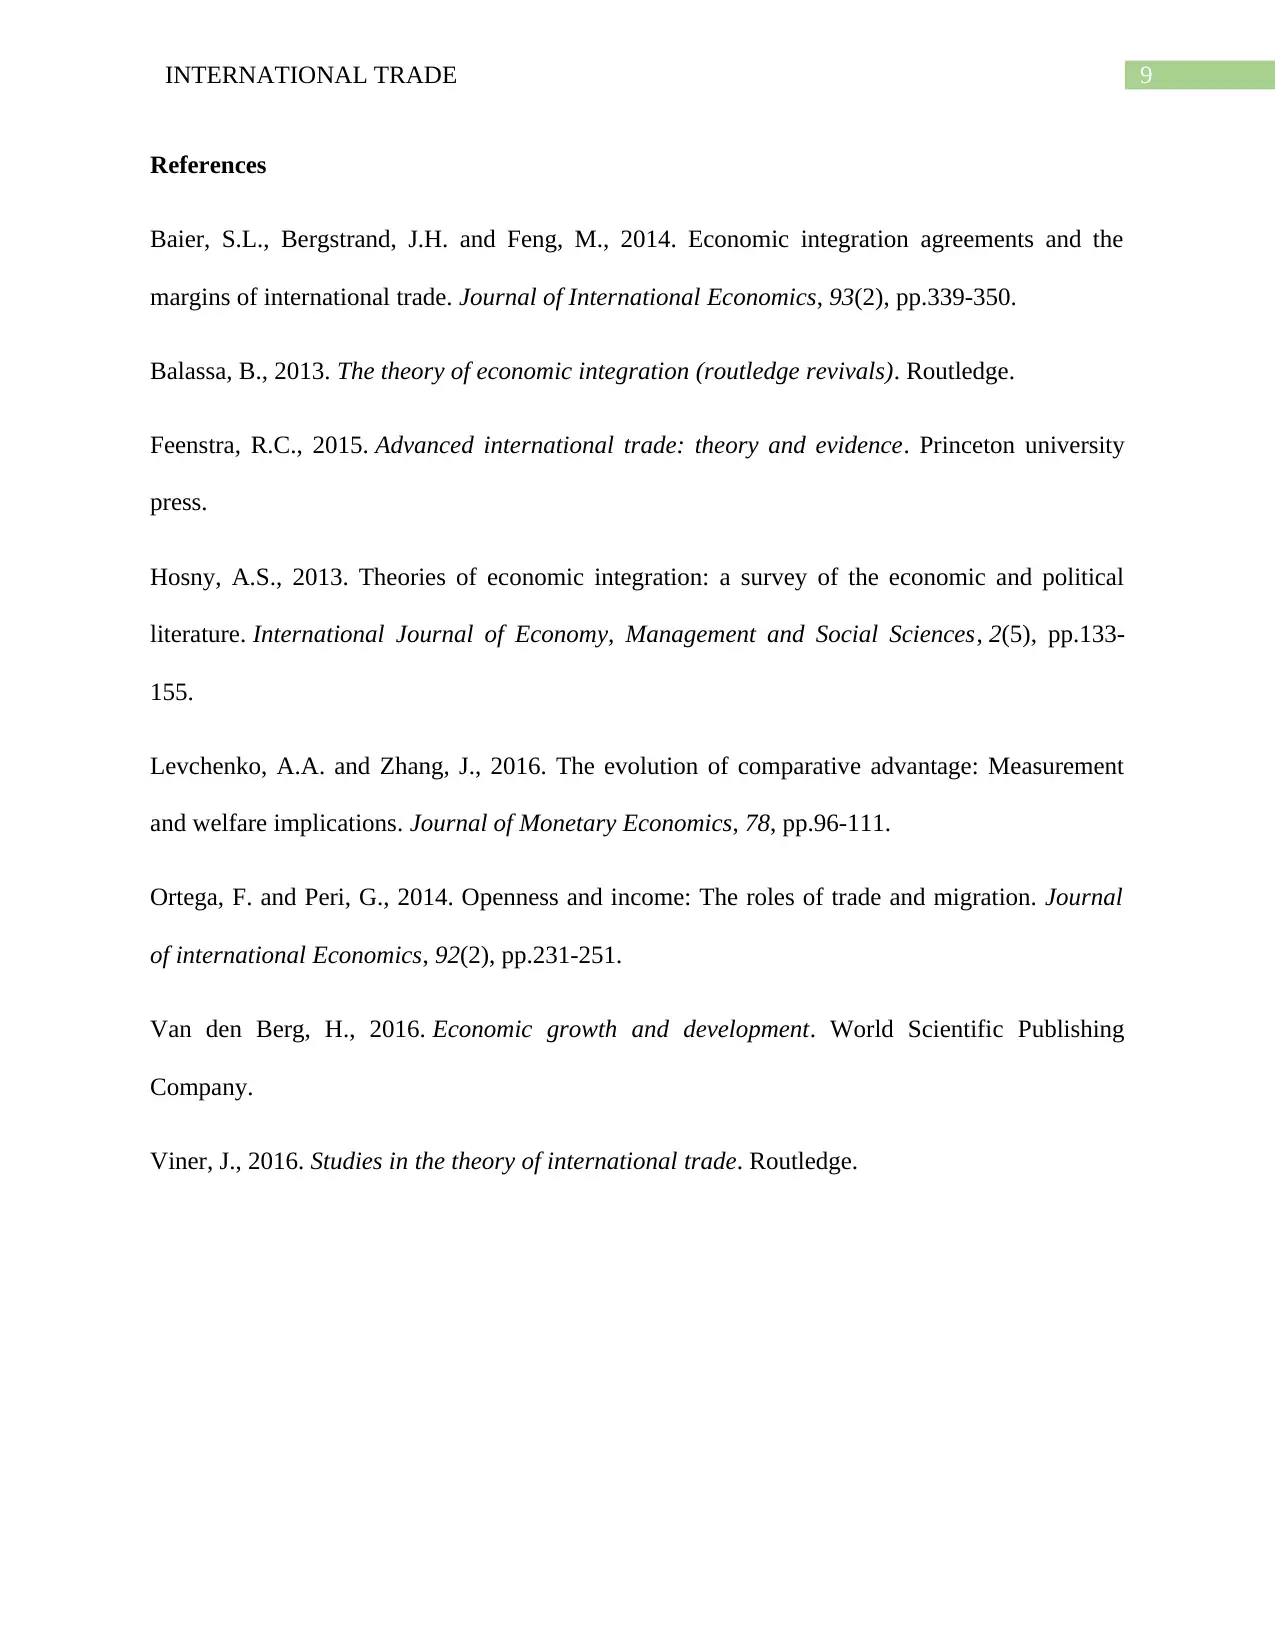
This report analyzes the international trade relationships between Italy and Sweden, focusing on their economic integration. It begins with a data analysis of trade flows, including imports, exports, and GDP, to compute the degree of economic openness for both countries from 2002 to 2016. The analys...

Running head: INTERNATIONAL TRADE
International Trade
Name of the Student
Name of the University
Course ID
International Trade
Name of the Student
Name of the University
Course ID
Paraphrase This Document
Need a fresh take? Get an instant paraphrase of this document with our AI Paraphraser

1INTERNATIONAL TRADE
Table of Contents
Data Analysis...................................................................................................................................2
Economic Integration of Italy and Sweden.................................................................................2
Openness and Economic development........................................................................................4
Technical Analysis...........................................................................................................................5
Ricardian model of trade.............................................................................................................5
References........................................................................................................................................9

2INTERNATIONAL TRADE
Data Analysis
Economic Integration of Italy and Sweden
Economic integration refers to an arrangement between two or more regions that includes
reduction or elimination of tariff or non-tariff trade barriers and coordination between fiscal and
monetary policies. Economic integration among nations aims to lower cost for both consumers
and producers in order to increase trade flow among countries involved in the trade agreement.
Broadly, economic integration is classified into three groups – integration of goods/service
markets, integration of financial markets and integration of factor markets (Baier, Bergstrand and
Feng 2014). The first form of integration is used to evaluate economic integration of Italy and
Sweden. Economic openness of the two nations are computed using the trade flows and GDP of
the nation. Trade flows of countries are computed as a sum of export and import and goods and
services. Export of goods and services refers to sales of domestic product to the international
market while import of goods and services refers to the purchase of goods and services from
abroad. Trade flows include both export and import (Hosny 2013). Gross Domestic Product of a
nation indicates sum of the values of goods and services that a country produces in a given year.
Trade flows presented as a percentage of GDP thus measures share of external activities in
aggregate output or extent of economic integration.
Openness=( Export of goods∧services +Import of goods∧services)
GDP ×100
⊘ This is a preview!⊘
Do you want full access?
Subscribe today to unlock all pages.

Trusted by 1+ million students worldwide

3INTERNATIONAL TRADE
2002 2004 2006 2008 2010 2012 2014 2016
40.00%
50.00%
60.00%
70.00%
80.00%
90.00%
100.00%
Italy Vs Sweden
Openness (Italy)
Openness (Sweden)
Year
Openness
Figure 1: Openness of Italy and Sweden
The measures of openness for Italy and Sweden show that degree of openness is higher
for Italy compared to Sweden. In both the nations, however degree of openness has increased
over time. In addition to trade flows, there are alternative measures that can be used to measure
economic integration. Indicators that represents economic integration include extent of foreign
direct or foreign portfolio investment, flow of migrant labor, immigration and extent of
offshoring (Ortega and Peri 2014).
Figure 1 shows the overtime trend in degree of openness of Italy and Sweden. The trade
flow accounts nearly 46 percent of total GDP of Italy in the year 2003. The trend of openness
reveals a continuous increasing trend from 2003 to 2007 with percentage of trade in total GDP
increased to nearly 55 percent in 2007. The percentage share of trade in GDP declined to 45
percent in 2008 and since then started to increase with percentage share of trade in GDP being
close to 57 percent in 2015.
Paraphrase This Document
Need a fresh take? Get an instant paraphrase of this document with our AI Paraphraser

4INTERNATIONAL TRADE
In case of Sweden, the estimated degree of openness is greater than Italy. Trade accounts
a much larger share of Sweden’s GDP. The estimated share of trade in GDP of Sweden in 2000
approximately equals 76 percent. The trade share continued to increase until 2008 with share
being as high as 93 percent. The share slightly declined in 2009 but still accounted to be 83
percent. Since then the continuous increase in export and import contributed to an increase in
trade share. The share of trade flows in GDP accounted to be 86 percent in 2015.
Openness and Economic development
The standard theory of trade suggests that participating in trade; a country can improve its
welfare. With trade, country can enjoy a wide range of goods and services at a relatively cheaper
price. Before trade, consumption of a nation remains limited by the goods and services produced
within the nation (Balassa 2013). Opening up to trade expands consumption choice of the nation.
Trade thus has a welfare enhancing effect and contributes to economic development. For purpose
of the paper, GDP per capita is taken as a proxy measure of economic development. The relation
between openness and economic development has been evaluated by computing the correlation
between GDP per capita and openness. For Italy, the correlation between GDP per capita and
openness is computed as 0.41. The positive correlation suggests that openness has a positive
association with GDP per capita. That means increase in openness contributes to an increase in
per capita GDP of Italy and hence, increases economic development (Van den Berg 2016). For
Sweden, the correlation between openness and GDP per capita is 0.57. Higher correlation
suggests a relatively stronger association between the two. The evidences for Italy and Sweden
thus suggest that more and more involvement in trade contribute to economic development.

5INTERNATIONAL TRADE
Technical Analysis
Ricardian model of trade
Given that, Each Italian workers can produce 1 shoe or 2 calculator and each Swedish
worker can produce 4 shoes or 2 calculators. The information is presented in the table below
Number of units /unit of time Shoe Calculator
Italy 1 2
Sweden 4 2
Worker in Italy produce 1 shoe while workers in Swede can produce 4 shoes per unit of
time. As Swedish works are able to produce more shoes per unit of time, Sweden enjoys an
absolute advantage in production of shoes (Viner 2016). In case of calculators, workers in both
the countries can produce 2 calculators per unit of time. Therefore, two countries are in same
position in production of calculators.
Comparative advantage of a nation is determined by evaluating opportunity cost of
production. A country is said to have a comparative advantage if it can produce a good at a
relatively lower opportunity cost (Levchenko and Zhang 2016). The opportunity costs of shoe
and calculator for Italy and Sweden are presented in the following table
Opportunity Cost Shoe Calculator
Italy 2/1 = 2 ½
Sweden 2/4 = 1/2 4/2 = 2
⊘ This is a preview!⊘
Do you want full access?
Subscribe today to unlock all pages.

Trusted by 1+ million students worldwide

6INTERNATIONAL TRADE
As shown from the above table, in order to produce 1 shoe, Italy needs to sacrifice 2
calculators while Sweden sacrifices only 1/2 calculator. Sweden thus has a lower opportunity
cost to produce shoe giving Sweden a comparative advantage in shoe production. In order to
produce 1 calculator, Italy needs to forgo ½ shoe while Sweden needs to forgo 2 shoes. The
opportunity cost of calculator is lower in Italy as compared to Sweden. Italy thus has a
comparative advantage in producing calculators.
There are total 80 workers in Italy. Therefore, Italy can produce maximum of 80 shoes or
160 calculators. Slope of PPF for Italy is (80/160) = 1/2. In Sweden, there are 60 workers.
Sweden therefore can produce 240 shoes or 120 calculators. Slope of PPF for Sweden is
therefore, 240/120 =2.
Figure 2: PPF of Italy and Sweden
In autarky, relative price of calculators is same as the opportunity cost of calculators.
Therefore, the autarky relative price of calculators in Italy is ½. The autarky relative price of
calculators in Sweden is 4/2 = 2.
Paraphrase This Document
Need a fresh take? Get an instant paraphrase of this document with our AI Paraphraser

7INTERNATIONAL TRADE
( Relative price of calculator )Italy= Price of calculators
Price of shoes
¿ 1
2
( Relative price of calculator )Sweden= Price of calculators
Price of shoes
¿ 4
2
¿ 2
Under autarky, both countries produce both goods. Each country divides the available
labors equally between the two goods. For Italy, the total available labor is 80. 40 workers then
engage in producing shoes and rest of the 40 workers engage in producing calculators. Optimal
production of shoe in Italy is 40 and optimal production of calculator is 80. For Sweden total
available workers is 60. In Sweden, 30 workers then produce shoe and 30 workers produce
calculators. Optimal productions in Sweden are 120 shoes and 60 calculators. In autarky,
countries cannot consume beyond its domestic production (Feenstra 2015). The optimal
consumption thus is same as optimal production.
Autarky
Production/Consumption
Shoe Calculator
Italy 40 80
Sweden 120 60

8INTERNATIONAL TRADE
Figure 3: Optimal production and consumption in Italy under autarky
Figure 4: Optimal production and consumption in Sweden under autarky
Figure 3: Optimal production and consumption in Italy under autarky
Figure 4: Optimal production and consumption in Sweden under autarky
⊘ This is a preview!⊘
Do you want full access?
Subscribe today to unlock all pages.

Trusted by 1+ million students worldwide

9INTERNATIONAL TRADE
References
Baier, S.L., Bergstrand, J.H. and Feng, M., 2014. Economic integration agreements and the
margins of international trade. Journal of International Economics, 93(2), pp.339-350.
Balassa, B., 2013. The theory of economic integration (routledge revivals). Routledge.
Feenstra, R.C., 2015. Advanced international trade: theory and evidence. Princeton university
press.
Hosny, A.S., 2013. Theories of economic integration: a survey of the economic and political
literature. International Journal of Economy, Management and Social Sciences, 2(5), pp.133-
155.
Levchenko, A.A. and Zhang, J., 2016. The evolution of comparative advantage: Measurement
and welfare implications. Journal of Monetary Economics, 78, pp.96-111.
Ortega, F. and Peri, G., 2014. Openness and income: The roles of trade and migration. Journal
of international Economics, 92(2), pp.231-251.
Van den Berg, H., 2016. Economic growth and development. World Scientific Publishing
Company.
Viner, J., 2016. Studies in the theory of international trade. Routledge.
1 out of 10
Related Documents

Your All-in-One AI-Powered Toolkit for Academic Success.
+13062052269
info@desklib.com
Available 24*7 on WhatsApp / Email
Unlock your academic potential
© 2024 | Zucol Services PVT LTD | All rights reserved.