University Economic and Quantitative Analysis Regression Report
VerifiedAdded on 2022/08/12
|10
|1685
|29
Report
AI Summary
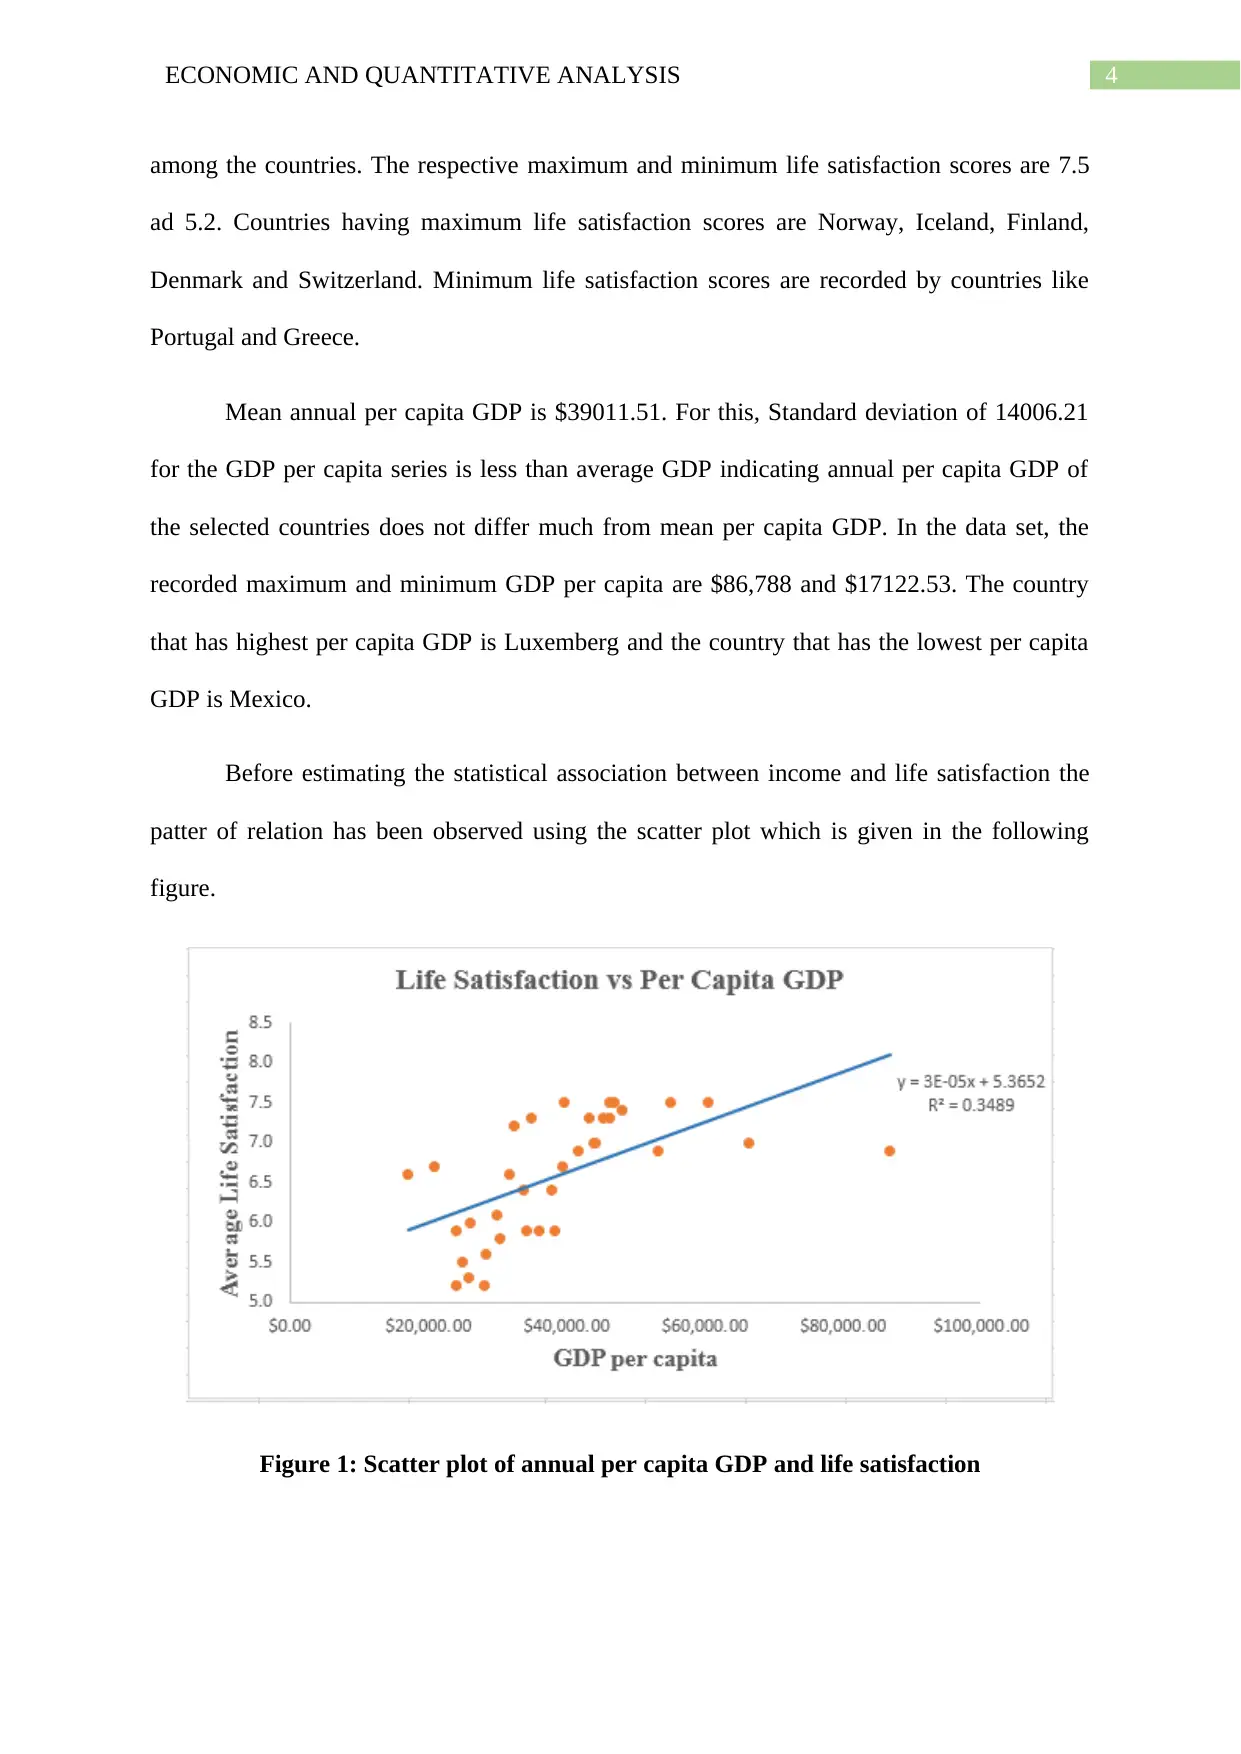
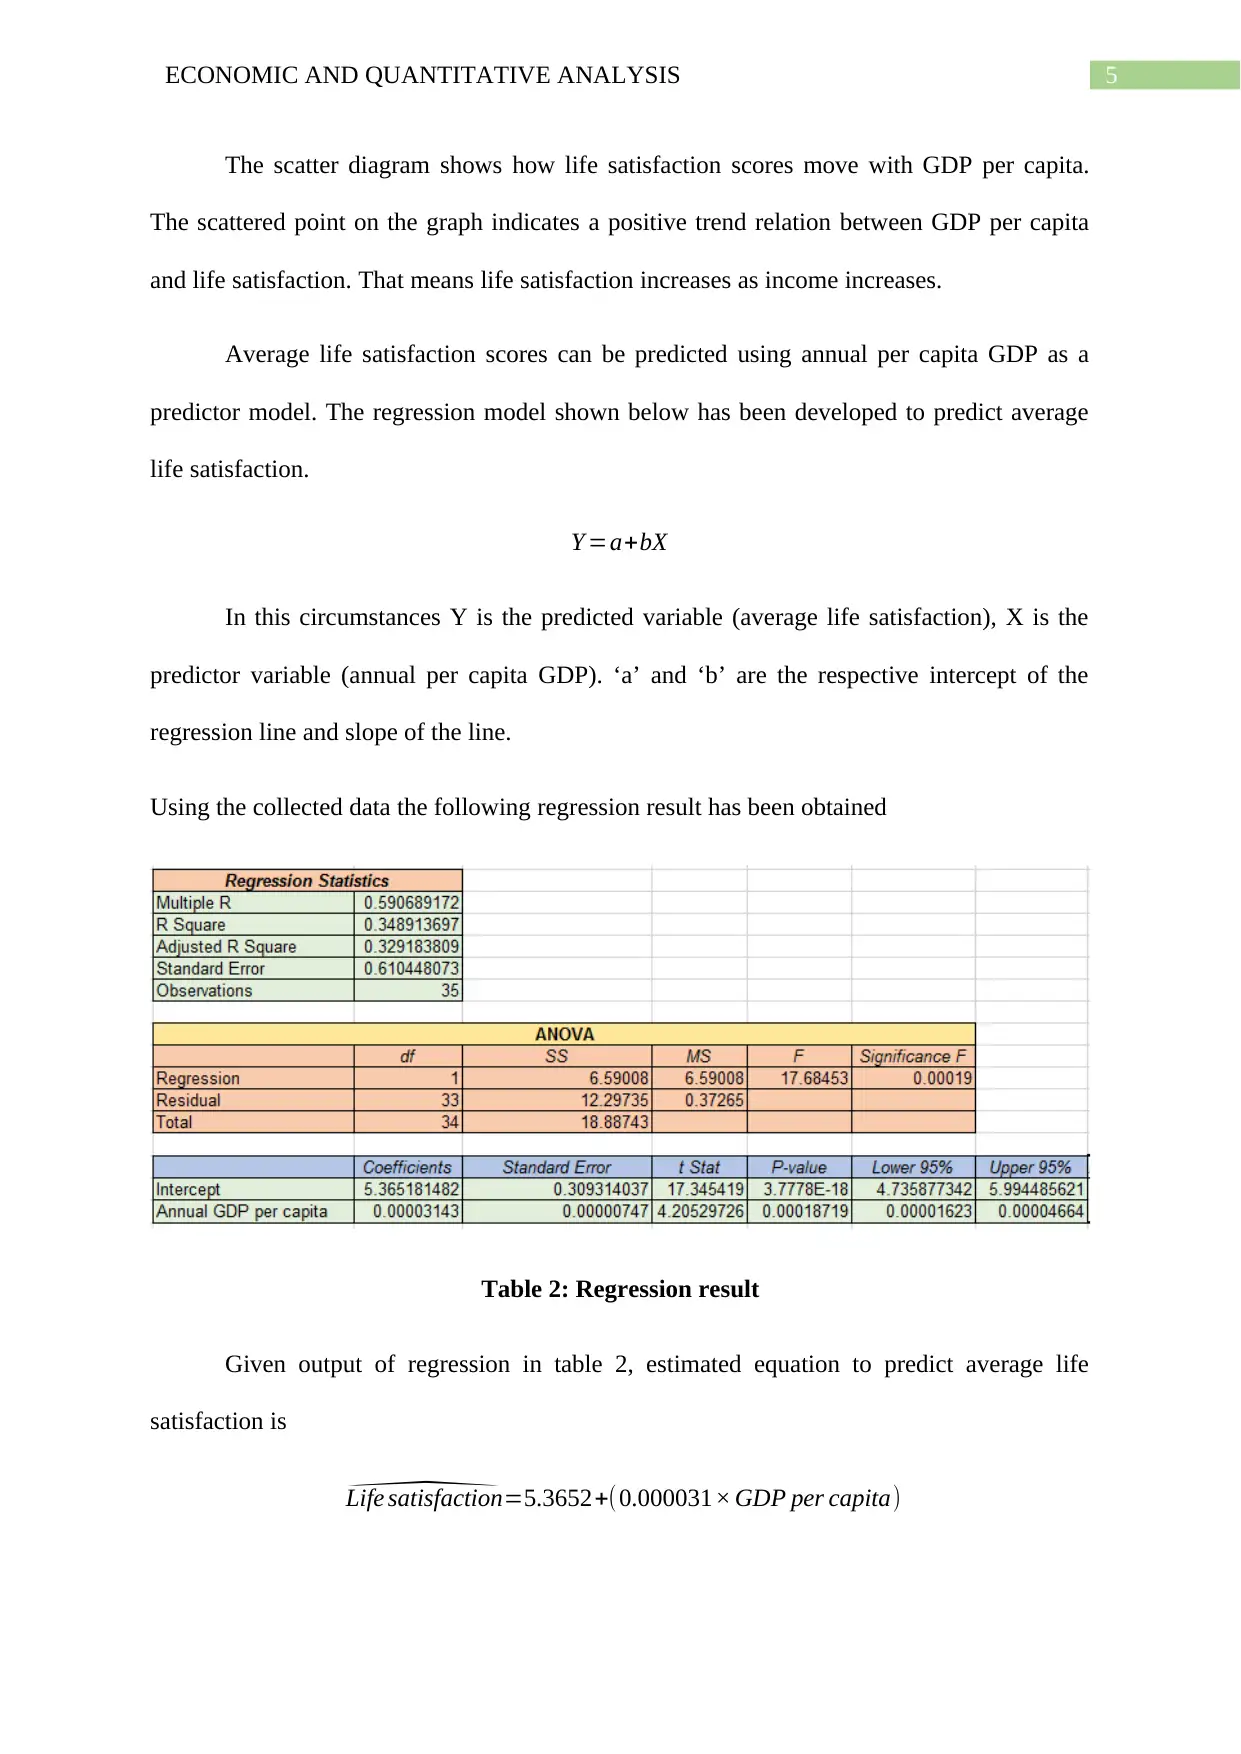
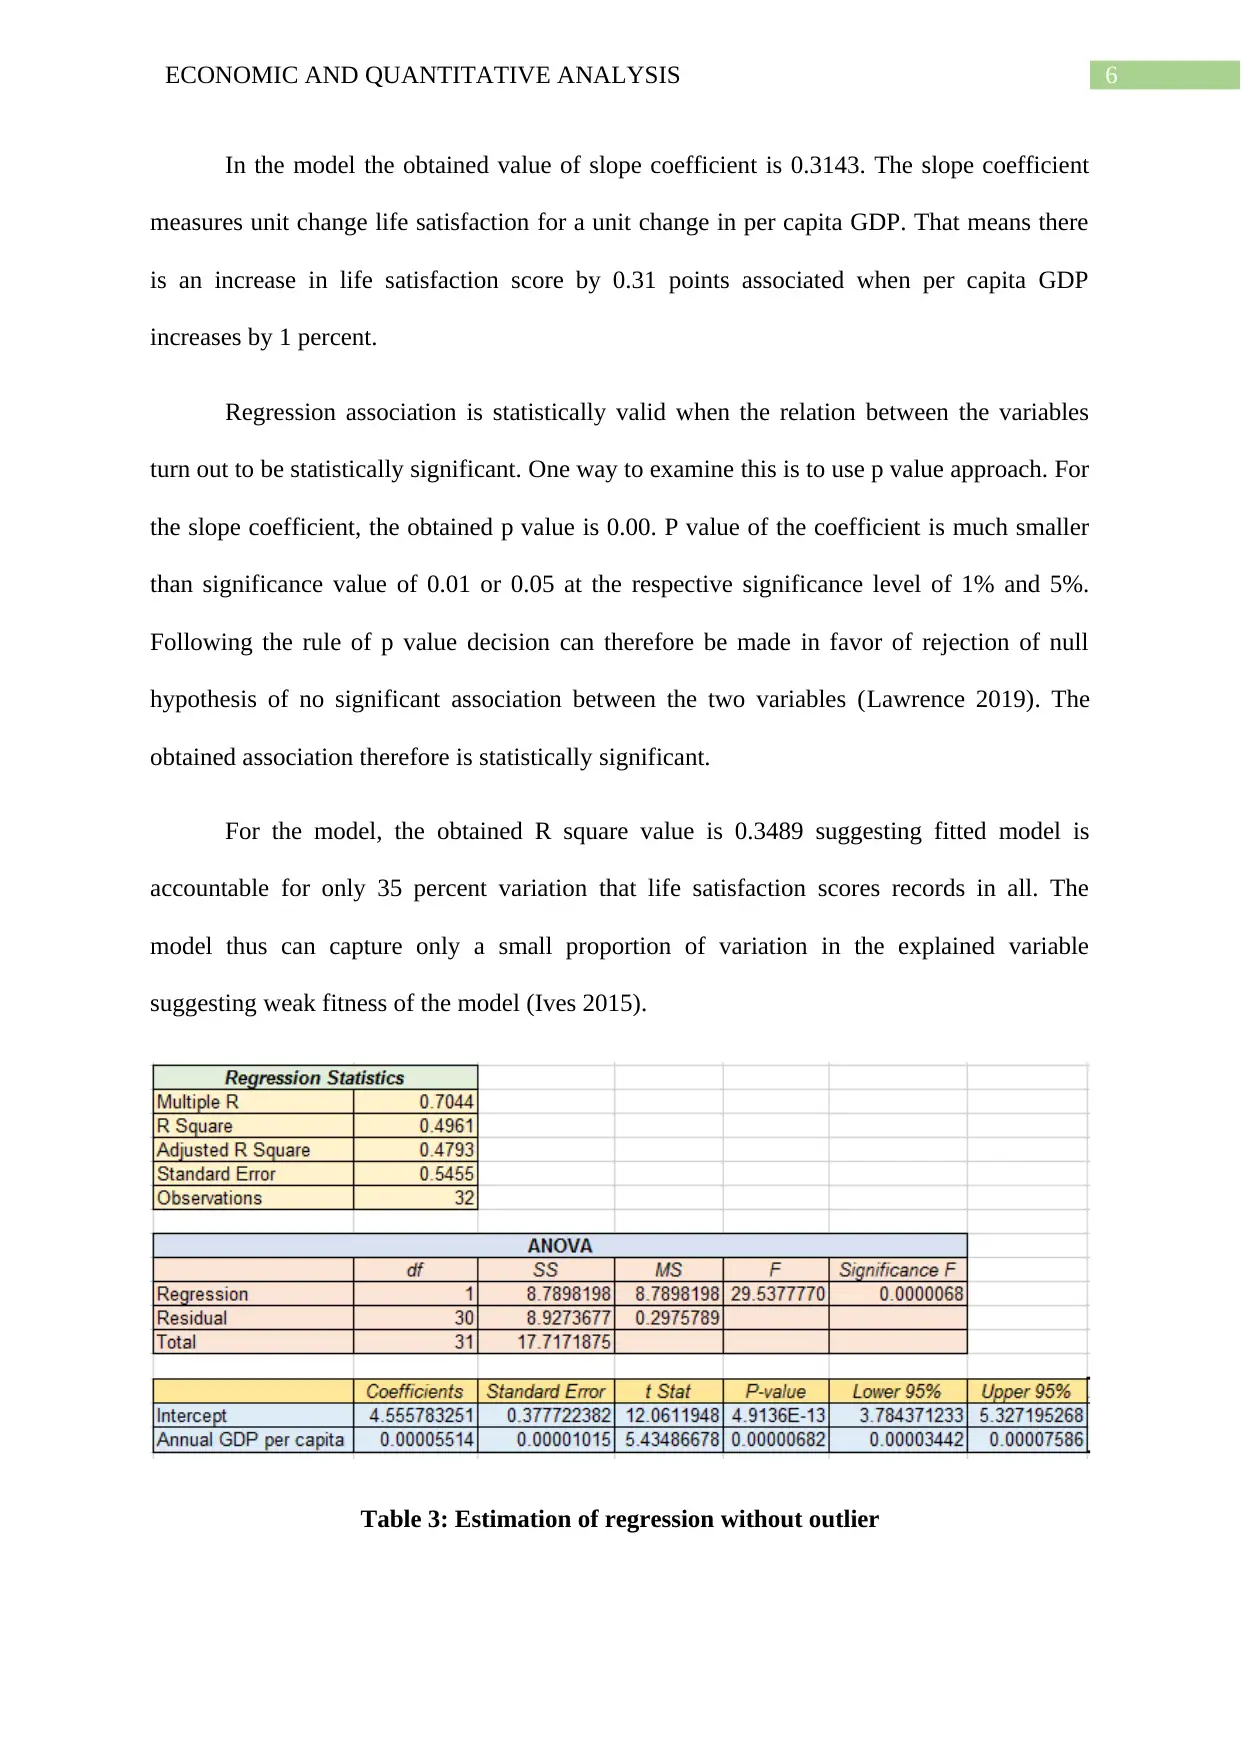
This report, prepared for the OECD, investigates the statistical association between average life satisfaction and GDP per capita across 35 countries. The study begins with a literature review discussing the economic interest in the relationship between income and life satisfaction, referencing the Easterlin Paradox and other relevant studies. The methodology includes data collection from OECD statistics, focusing on annual per capita GDP and life satisfaction scores, employing descriptive statistics, scatter plots, and regression analysis. The results reveal a positive trend between GDP per capita and life satisfaction, with regression analysis indicating a statistically significant association. The report also discusses the limitations of the study, such as the limited sample size and cross-sectional data, while offering recommendations to enhance life satisfaction through income support programs and policies that boost GDP. The analysis uses both descriptive and regression models to ascertain the impact of GDP on life satisfaction and concludes with the implication of these factors on well-being.

Running head: ECONOMIC AND QUANTITATIVE ANALYSIS
Economic and Quantitative Analysis
Name of the Student
Name of the University
Author note
Economic and Quantitative Analysis
Name of the Student
Name of the University
Author note
Secure Best Marks with AI Grader
Need help grading? Try our AI Grader for instant feedback on your assignments.

1ECONOMIC AND QUANTITATIVE ANALYSIS
Table of Contents
1. Purpose...................................................................................................................................2
2. Background............................................................................................................................2
3. Method...................................................................................................................................3
4. Result......................................................................................................................................3
5. Discussion..............................................................................................................................7
6. Recommendation....................................................................................................................7
List of References......................................................................................................................9

2ECONOMIC AND QUANTITATIVE ANALYSIS
1. Purpose
Main purpose of the report is to research how income is associated with life
satisfaction by considering empirical data on yearly per capita GDP and life satisfaction score
of some selected nation.
2. Background
Research on the impact of income on level of satisfaction is long since one attractive
research area for the economists and policy makers. Many economists attempted to establish
a link between economic factors and subjective well-being. One reason for studying state of
life satisfaction of people is attainment of happiness is primary target of many policies.
Previous literatures conducted extensive researches to identify different factors affecting life
satisfaction (Cheung and Lucas 2015). One pioneering literature in the discussion of income
and life satisfaction is the Easterlin Pardox (1974). The literature was based on the study of
happiness in USA. The paper described the link between happiness and income as no
significant relation between life satisfaction and income from the observation that after World
War II responses to happiness among people remained flat in the phase of increasing average
income (Mikucka, Sarracino and Dubrow 2017). Study carried out on Germany, UK and
Japan later support the result of Easterlin’s finding. On the other end there are literatures
supporting a positive relation of life satisfaction and happiness. Another panel study found a
positive association between household wealth level and consumption spending and
happiness. These conflicting literatures raised question on whether macroeconomic factors in
effect have any significant impact on life satisfaction (Lenzi and Perucca 2016). On such a
background of research, the paper develops its own model to examine the relation.

3ECONOMIC AND QUANTITATIVE ANALYSIS
3. Method
The research methodology has two sections – data collection and data analysis. The
paper aims to study the association of level of life satisfaction with the level of per capita
GDP. In order to measure income data has been collected on the indicator of annual per
capita GDP. For the purpose of measuring the life satisfaction data has been collected on life
satisfaction scores. Data on the selected indicators have been accumulated for 35 countries.
Data are collected across countries for a given time period and therefore the study is a cross
sectional study. The source of data is the official statistics of OECD. The collection of data
has been followed by the different statistical techniques of quantitative research method
(Walliman 2017). Statistical measures carried out in the report include descriptive measures,
scatter plot and regression analysis technique.
4. Result
The section summarizes finding of different statistical measures.
Table 1: Summary measures of life satisfaction and annual per capita GDP
For the sample data mean score of life satisfaction is 6.6. In the life satisfaction series
the standard deviation of 0.75 is far less than mean suggesting life satisfaction varies less
Secure Best Marks with AI Grader
Need help grading? Try our AI Grader for instant feedback on your assignments.

4ECONOMIC AND QUANTITATIVE ANALYSIS
among the countries. The respective maximum and minimum life satisfaction scores are 7.5
ad 5.2. Countries having maximum life satisfaction scores are Norway, Iceland, Finland,
Denmark and Switzerland. Minimum life satisfaction scores are recorded by countries like
Portugal and Greece.
Mean annual per capita GDP is $39011.51. For this, Standard deviation of 14006.21
for the GDP per capita series is less than average GDP indicating annual per capita GDP of
the selected countries does not differ much from mean per capita GDP. In the data set, the
recorded maximum and minimum GDP per capita are $86,788 and $17122.53. The country
that has highest per capita GDP is Luxemberg and the country that has the lowest per capita
GDP is Mexico.
Before estimating the statistical association between income and life satisfaction the
patter of relation has been observed using the scatter plot which is given in the following
figure.
Figure 1: Scatter plot of annual per capita GDP and life satisfaction

5ECONOMIC AND QUANTITATIVE ANALYSIS
The scatter diagram shows how life satisfaction scores move with GDP per capita.
The scattered point on the graph indicates a positive trend relation between GDP per capita
and life satisfaction. That means life satisfaction increases as income increases.
Average life satisfaction scores can be predicted using annual per capita GDP as a
predictor model. The regression model shown below has been developed to predict average
life satisfaction.
Y =a+bX
In this circumstances Y is the predicted variable (average life satisfaction), X is the
predictor variable (annual per capita GDP). ‘a’ and ‘b’ are the respective intercept of the
regression line and slope of the line.
Using the collected data the following regression result has been obtained
Table 2: Regression result
Given output of regression in table 2, estimated equation to predict average life
satisfaction is
^Life satisfaction=5.3652+(0.000031× GDP per capita)

6ECONOMIC AND QUANTITATIVE ANALYSIS
In the model the obtained value of slope coefficient is 0.3143. The slope coefficient
measures unit change life satisfaction for a unit change in per capita GDP. That means there
is an increase in life satisfaction score by 0.31 points associated when per capita GDP
increases by 1 percent.
Regression association is statistically valid when the relation between the variables
turn out to be statistically significant. One way to examine this is to use p value approach. For
the slope coefficient, the obtained p value is 0.00. P value of the coefficient is much smaller
than significance value of 0.01 or 0.05 at the respective significance level of 1% and 5%.
Following the rule of p value decision can therefore be made in favor of rejection of null
hypothesis of no significant association between the two variables (Lawrence 2019). The
obtained association therefore is statistically significant.
For the model, the obtained R square value is 0.3489 suggesting fitted model is
accountable for only 35 percent variation that life satisfaction scores records in all. The
model thus can capture only a small proportion of variation in the explained variable
suggesting weak fitness of the model (Ives 2015).
Table 3: Estimation of regression without outlier
Paraphrase This Document
Need a fresh take? Get an instant paraphrase of this document with our AI Paraphraser

7ECONOMIC AND QUANTITATIVE ANALYSIS
The new estimated model for predicting average life satisfaction is obtained as
Life satisfaction=4.5558+(0.000055 ×GDP per capita)
Slope coefficient of the new estimated model is 0.5514. Slope coefficient’s value is
larger relative to the previous estimated model meaning impact of income on life satisfaction
now has become stronger because of dropping outliers. In case of goodness of fit, R square
value in the new model is 0.4961. The larger value of R square indicates a better fitness of the
model as compared to the previously fitted model.
5. Discussion
The statistical analysis of relation between income and life satisfaction suggests that
the impact of income on per capita GDP is positive. Income therefore supports people for
living a better and more satisfied life. Use of quantitative analysis technique following a
systematic approach to research the relation between the variables is the strength of the paper.
Adaption of easy empirical techniques has made the analysis simple and the result can be
interpreted easily (Patten and Newhart 2017). First limitation of the paper is limited sample
size. Moreover, the paper considers cross sectional data where period of time is fixed.
Happiness or life satisfaction however tends to vary overtime. The report gives a consistent
result with previous literatures that concluded GDP and life satisfaction has positive
association and has clear insights for policy design for increasing life satisfaction.
6. Recommendation
The report concludes a positive significant association of income with life
satisfaction. Recommendations therefore can be made to increase life satisfaction in the
following ways.

8ECONOMIC AND QUANTITATIVE ANALYSIS
In order to make people happier or more satisfied government should design some direct or
indirect income support program for people having a relatively smaller income.
Policy for boosting aggregate output or GDP is another way to support happiness which in
turn leads to more satisfaction.
People put significant importance on condition of health, educational facilities, environment
in which they live in, self-esteem, cultural values and others while determining life
satisfaction. These indicators should also be developed for attaining a higher satisfaction.

9ECONOMIC AND QUANTITATIVE ANALYSIS
List of References
Cheung, F. and Lucas, R.E., 2015. When does money matter most? Examining the
association between income and life satisfaction over the life course. Psychology and
aging, 30(1), p.120.
Ives, A.R., 2015. For testing the significance of regression coefficients, go ahead and log‐
transform count data. Methods in Ecology and Evolution, 6(7), pp.828-835.
Lawrence, K.D., 2019. Robust regression: analysis and applications. Routledge.
Lenzi, C. and Perucca, G., 2016. Life satisfaction across cities: Evidence from Romania. The
Journal of Development Studies, 52(7), pp.1062-1077.
Mikucka, M., Sarracino, F. and Dubrow, J.K., 2017. When does economic growth improve
life satisfaction? Multilevel analysis of the roles of social trust and income inequality in 46
countries, 1981–2012. World Development, 93, pp.447-459.
Patten, M.L. and Newhart, M., 2017. Understanding research methods: An overview of the
essentials. Routledge.
Walliman, N., 2017. Research methods: The basics. Routledge.
1 out of 10
Related Documents

Your All-in-One AI-Powered Toolkit for Academic Success.
+13062052269
info@desklib.com
Available 24*7 on WhatsApp / Email
Unlock your academic potential
© 2024 | Zucol Services PVT LTD | All rights reserved.